
EB Daily Market Report - Friday, September 4, 2020
Executive Market Summary
- Futures painted another troubled outlook for growth stocks and the NASDAQ
- The open has confirmed this as the Dow Jones and S&P 500 are significantly outperforming the NASDAQ
- August nonfarm payrolls came in mostly as expected, with the unemployment rate dropping more than expected
- U.S. equities don't really care about payrolls today as fear is gripping stocks, especially growth stocks (IWF)
- Commodities are mostly lower, but the 10 year treasury yield ($TNX) has surged nearly 7 basis points to 0.69% - a positive development
- Financials (XLF, +1.71%) and industrials (XLI, +1.34%) are benefiting the most from surging treasury yields
- Meanwhile, technology (XLK, -1.91%) and communication services (XLC, -1.91%) are lagging badly for a second consecutive day
- American Express (AXP) and JP Morgan (JPM) are leading the Dow Jones to gains today, despite the selling pressure in the key technology sector
- Salesforce.com (CRM) and Apple (AAPL) are the two worst performers in the Dow Jones
Market Outlook
Let me address the obvious and most-asked question over the past 24 hours. "When and what should I buy?" Both questions are very difficult to address with any certainty and everyone has different timeframes, objectives, and risk profiles. So this is definitely not a "one size fits all" type of question. Two years from now, I suspect that it won't matter exactly at what price you bought many of today's leaders. But if you're looking at making money by the end of September on these same names, it gets much trickier and much more dicey. I believe there's a very good chance that we've begun to unwind the severely overbought conditions, but I would be shocked if we didn't see more fallout in September. Once the selling begins, it normally needs to run its course. There are a couple of charts that I'd want to watch closely this month. The first is the growth vs. value (IWF:IWD) ratio. I posted this in the EB Digest article this morning, so be sure to check that out. You can find it in the left navigational panel on our website once you've signed in.
The second chart I'd watch is the 60 minute chart of the NASDAQ 100 ($NDX) or the QQQ (ETF that tracks the NASDAQ 100). Short-term downtrends will many times result in price remaining below the declining 20 hour EMA - until a positive divergence forms. That will likely take a few days to a week to print, depending on the severity of the selling the next few days. Here's a current look at the chart, just after today's opening bell:
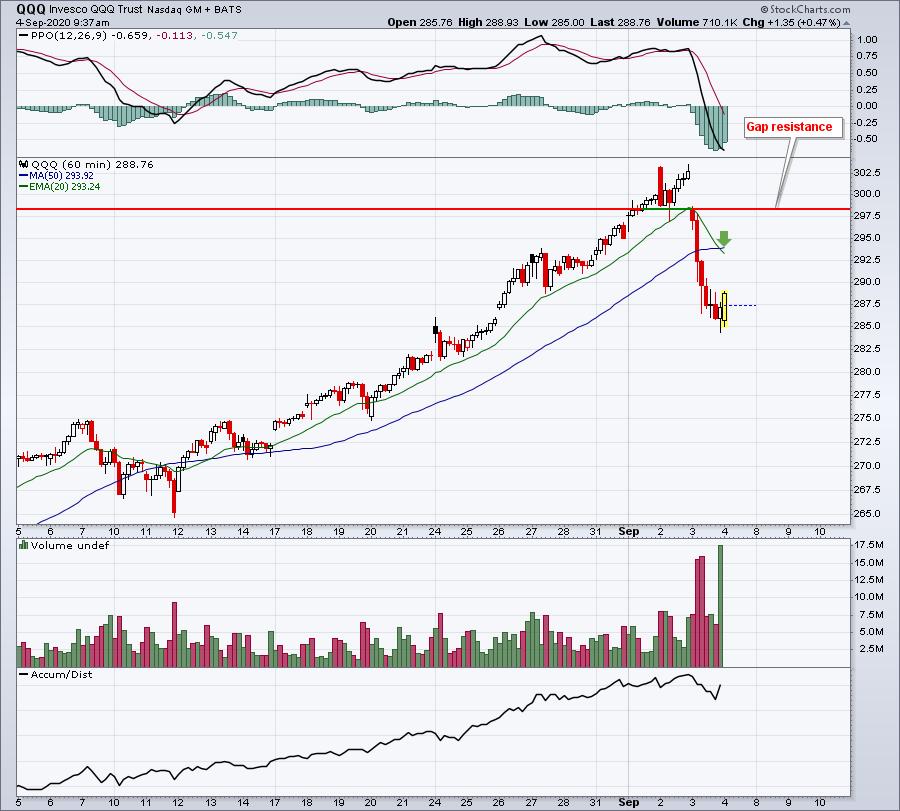
If the QQQ can rebound and pierce the 20 day EMA, there still remains what should be very significant gap resistance closer to 298 or so. I don't believe the low is in. I'd look for further short-term weakness, but beginning to build positions using this short-term weakness is not a bad idea. Again, it just depends on your willingness to accept risk, because I cannot eliminate that risk. Everyone has to assess their own risk tolerance and decide if accumulating positions in a down market makes sense.
Sector/Industry Focus
I will continue to follow the IWF:IWD ratio quite closely for the primary purpose of determining what kind of appetite traders have. As long as this ratio is falling, I want to be very careful with growth names. Here's a quick morning update on where this ratio stands today:
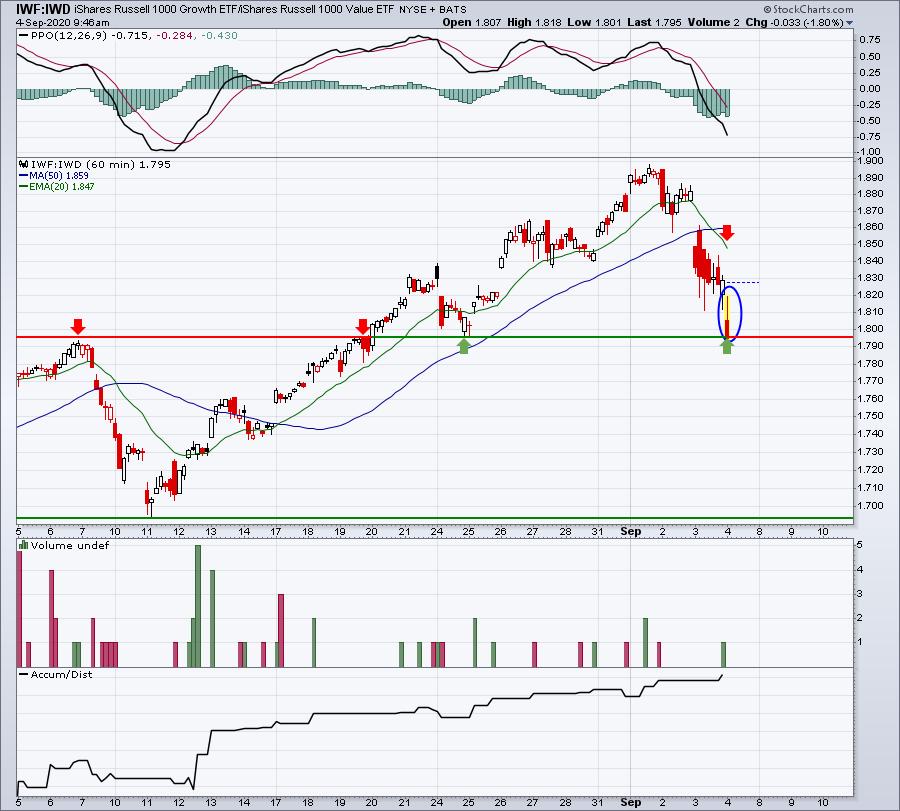
The new low this morning and the relative weakness on the NASDAQ again today tells me to be very careful with this group. Beginning to build a position isn't a horrible idea, but I'd begin to do it slowly. We could see better opportunities in growth names throughout this month as the market rotates and consolidates.
ChartLists
The weaker performers during the pandemic might be better short-term trading candidates as the market is currently shunning growth names. That suggests that our Weak AD ChartList might not be a bad option for now. Here's a quick look at some of the highest SCTR names on this list:
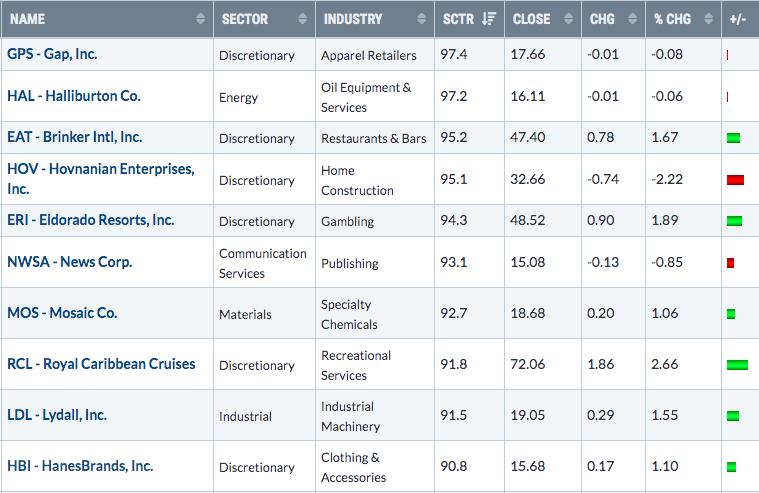
The market is shunning the high growth names, but the Dow Jones is higher today. So there are buyers, but not in every area of the market. From the list above, two that I like are as follows:
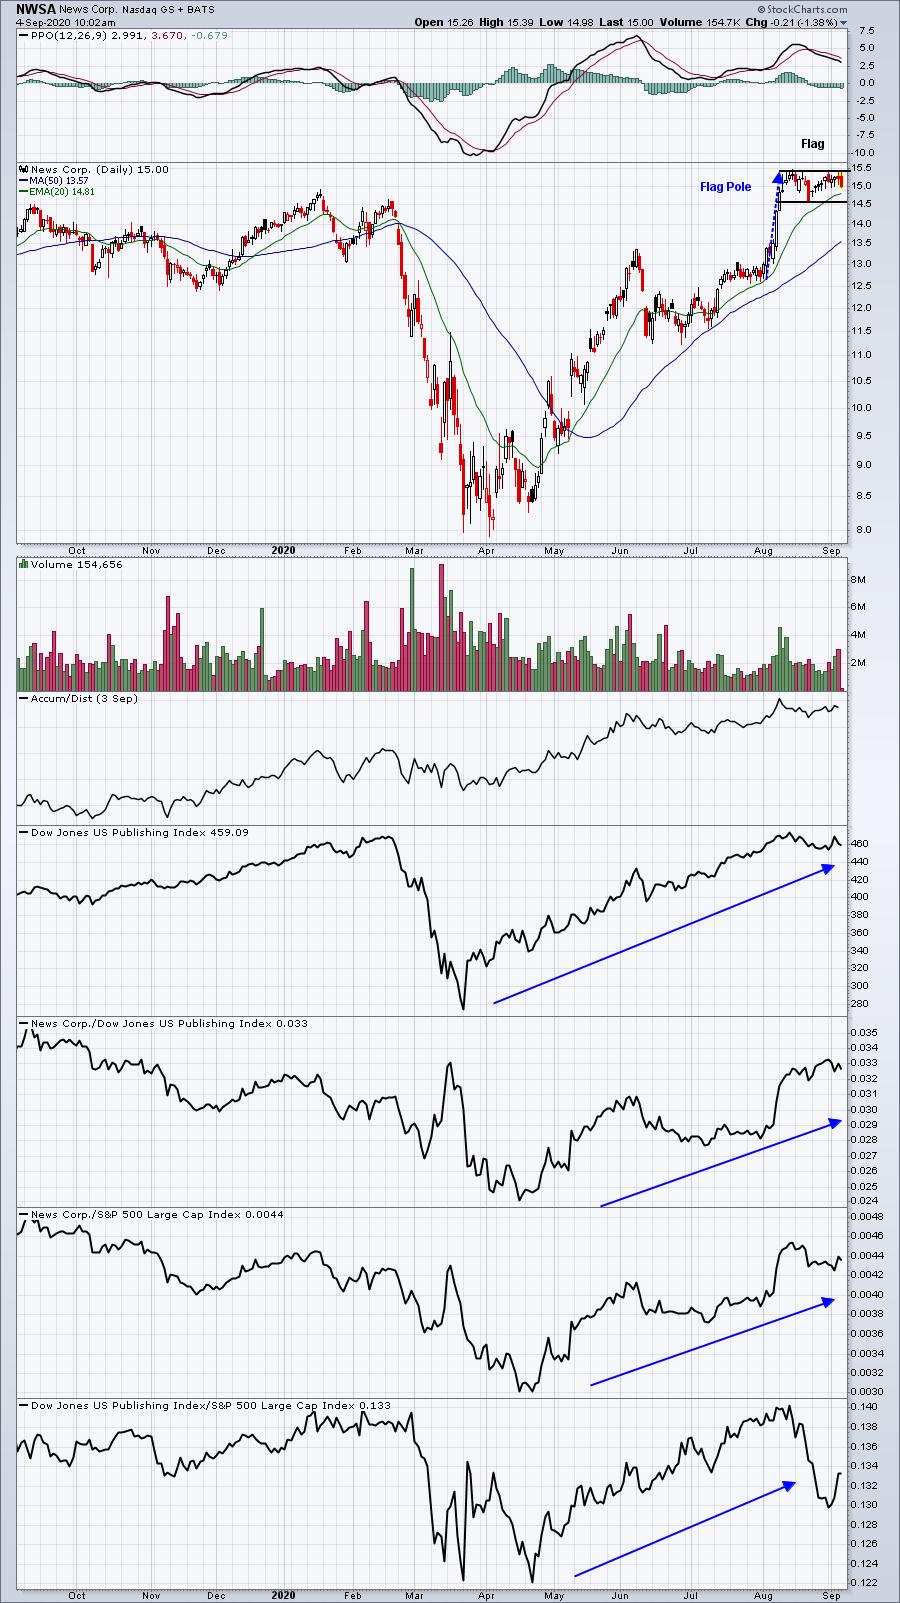
NWSA:
HBI:
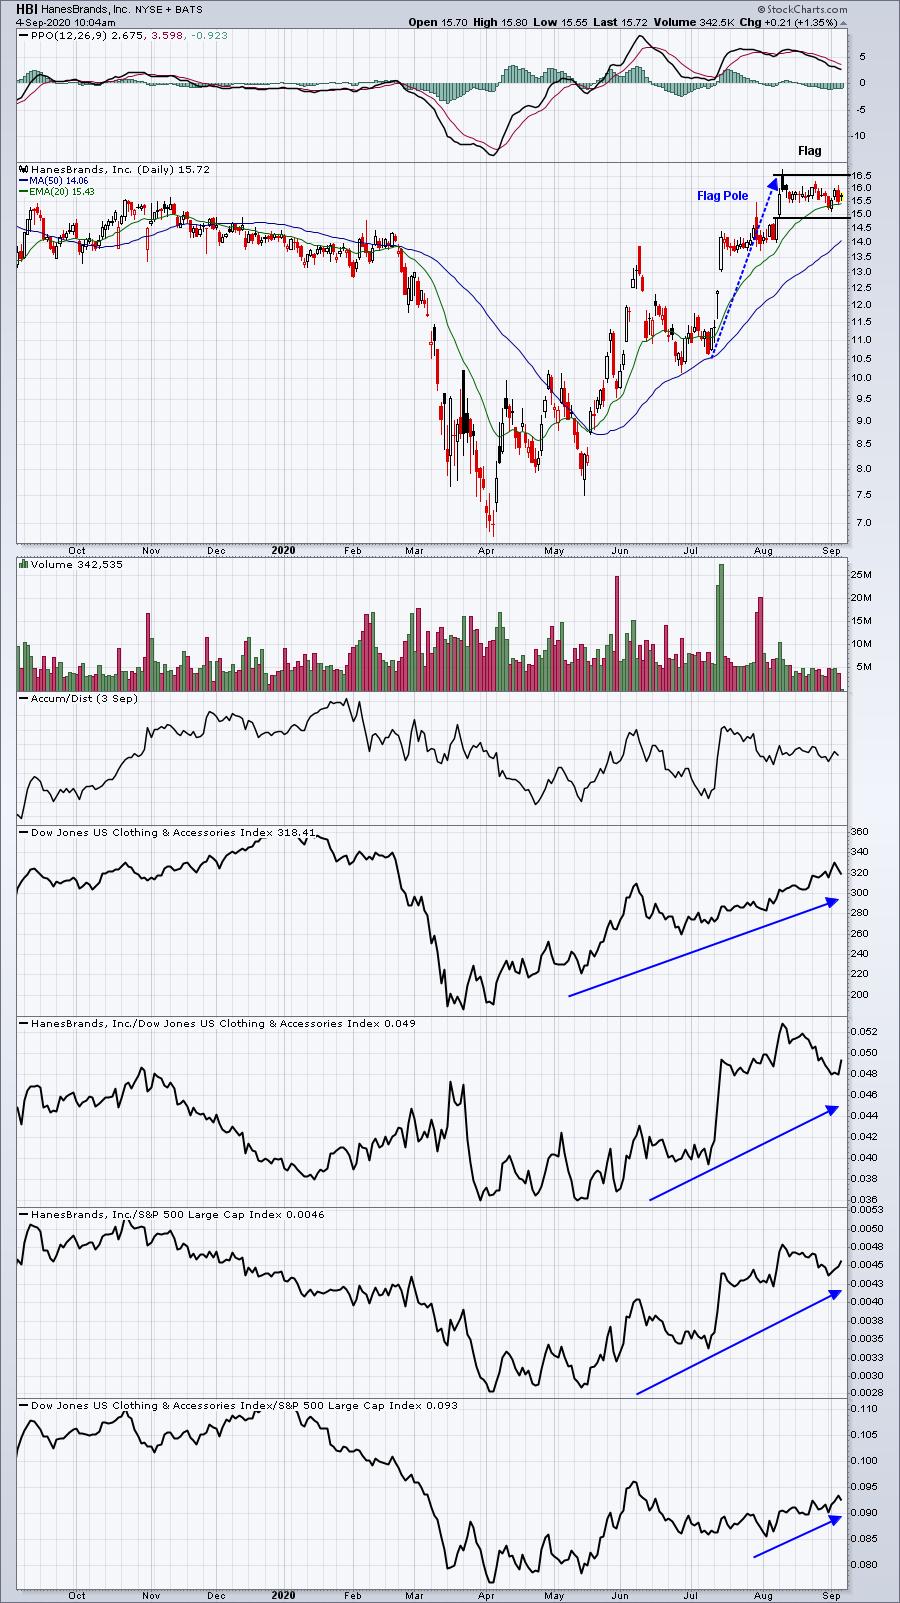
Both of these charts have similarities. They've both become leaders. They both are consolidating after strong advances and both are in bullish patterns. It also helps that both have pulled back recently to improve their reward to risk scenarios. I'd be careful if either lose their short-term price support levels shown.
Earnings Reports
Here are the key earnings reports for today and tomorrow, featuring stocks with market caps of more than $10 billion. I also include a few select companies with market caps below $10 billion. Finally, any portfolio stocks that will be reporting results are highlighted in BOLD. If you decide to hold a stock into earnings, please understand the significant short-term risk that you are taking. Please be sure to check for earnings dates for any companies you own or are considering owning.
Friday, September 4:
None
Monday, September 7:
None
Economic Reports
August nonfarm payrolls: 1,371,000 (actual) vs. 1,400,000 (estimate)
August private payrolls: 1,027,000 (actual) vs. 1,358,000 (estimate)
August unemployment rate: 8.4% (actual) vs. 9.8% (estimate)
August average hourly earnings: +0.3% (actual) vs. +0.0% (estimate)
Happy trading!
Tom