
EB Daily Market Report - Friday, September 18, 2020
Executive Market Summary
- Futures were mostly higher this morning, but selling has again kicked in - "careful" remains the word as we work our way through September
- 50 day SMAs are being threatened today, which could trigger additional short-term selling
- The Volatility Index ($VIX) remains flat today just above 26 - GREAT news from a longer-term bullish perspective
- Technology (XLK, -2.02%) remains the primary laggard, but many of these names are heavily traded with options and today is "quad-witching" options expiration day
- 7 of our 11 sectors are down by 1% or more; financials (XLF, +0.22%) are bucking the trend, but few of those stocks likely have significant net in-the-money call premium implications
- Cruise lines are being hit hard today as NCLH and CCL are the two worst performers in the S&P 500
- Apple (AAPL, -3.08%) and Microsoft (MSFT, -2.23%) are weighing heavily on the Dow Jones
Market Outlook
Not much has changed in terms of the SPX chart and the IWF:IWD ratio and that's what I'm focusing on quite closely right now as we approach next week - the 3rd worst historical calendar week of the year since 1950 (September 21-27). Check out these two charts:
S&P 500:
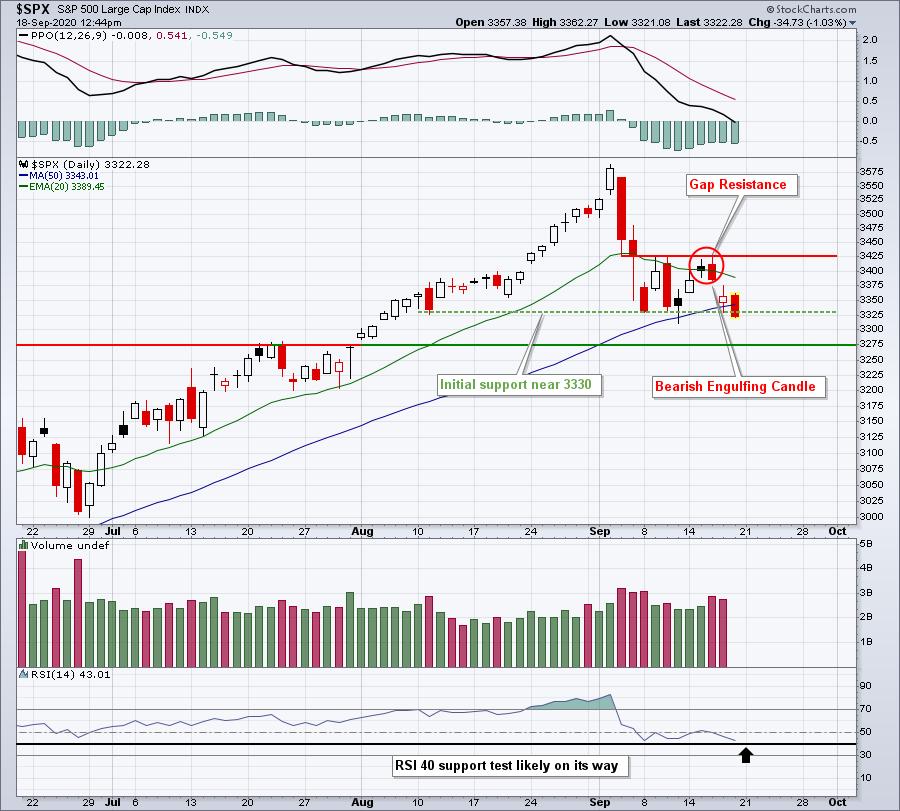
We're threatening a close beneath the recent price low AND the 50 day SMA, which could trigger more short-term selling later today and next week. Always remember to keep the longer-term weekly chart in mind too, though:
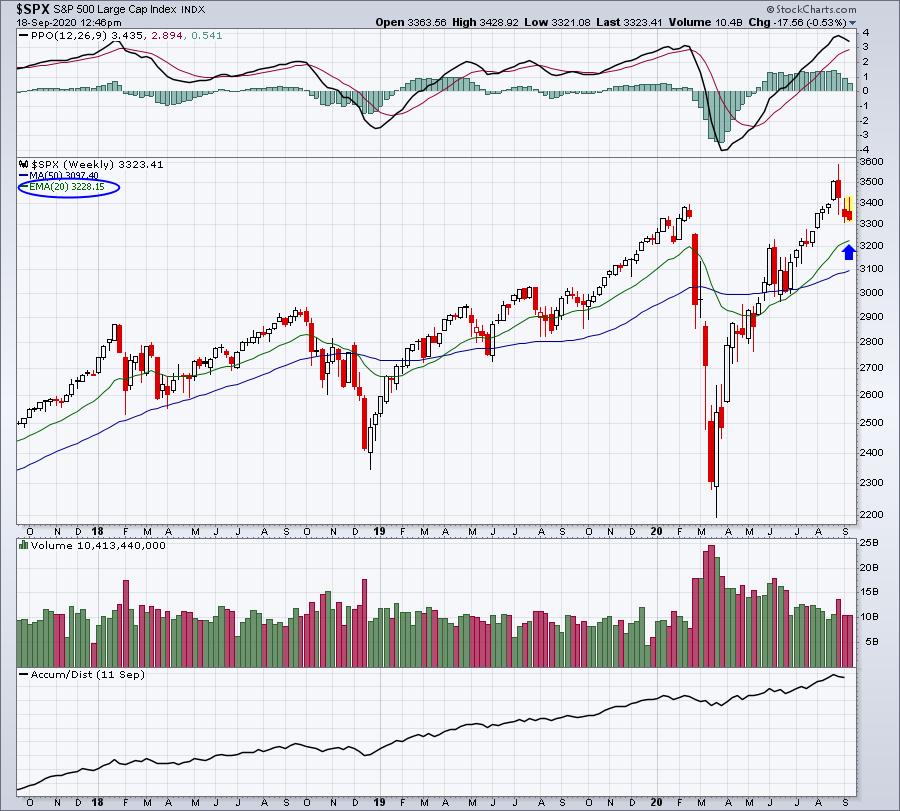
There's room down to that 20 week EMA and a test of it would be considered a normal technical development and actually would provide us a solid entry into this secular bull market advance. An intraweek "tail" below the 20 week EMA is possible too. Therefore, don't be shocked if many traders get knocked out of the market next week if the short-term selling persists. I wouldn't rule out an intraweek move below perhaps even 3200. I'm not saying it will happen, just that technically I wouldn't be shocked if it did. I've pointing out what I believe is support from 3200-3300 and we're nearly there.
IWF:IWD:
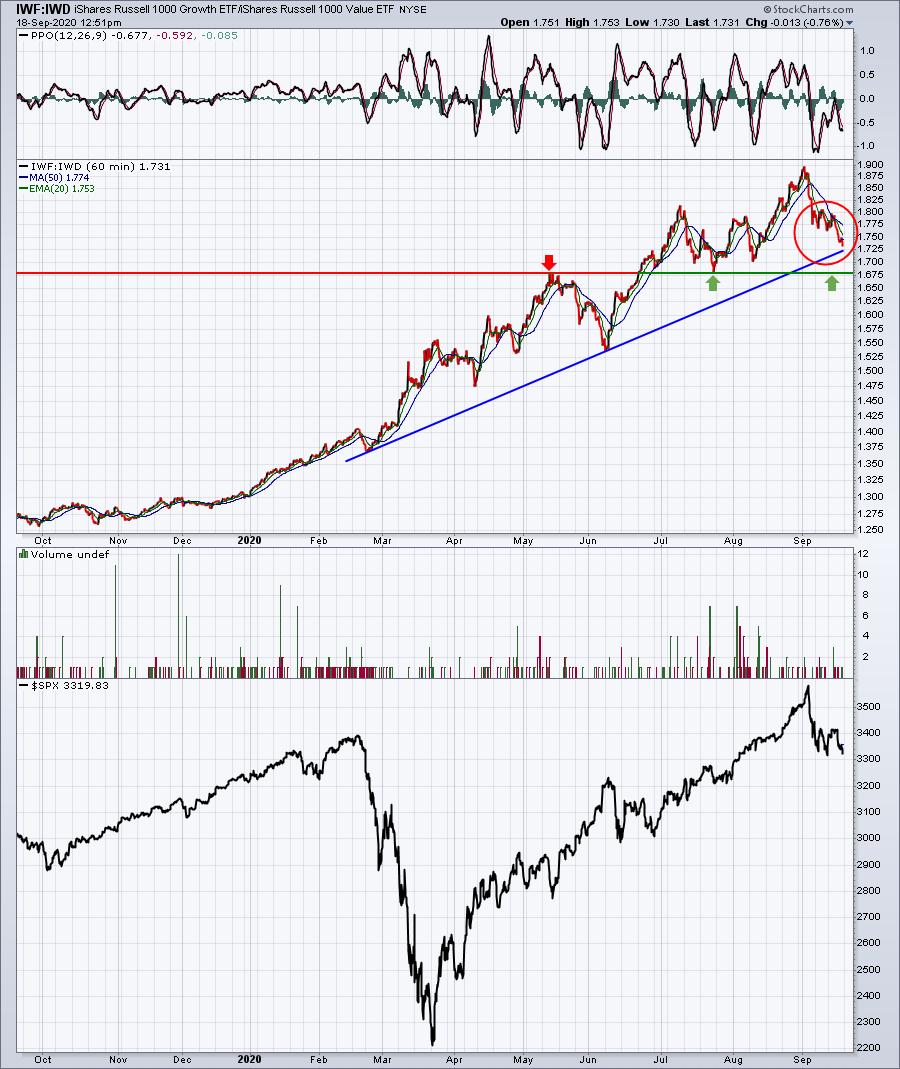
The short-term downtrend in this growth vs. value ratio continues as well. I believe the overall market will be in better shape technically when this relative downtrend ends. There's a reasonable chance we'll see 1.68 next week. That would be a very interesting level to begin anticipating a market reversal. Perhaps it'll correspond with a 60 minute positive divergence just as we're testing that 20 week EMA on the S&P 500? Just thinking out loud here....
Sector/Industry Focus
Many economically-sensitive areas of the market are not likely to perform very well on a relative basis until we see a meaningful rally in the 10 year treasury yield ($TNX). The one area I watch just about every day is banks ($DJUSBK). Their relative strength tends to rise and fall with the movement in the TNX. The following chart is a perfect example of this relationship:
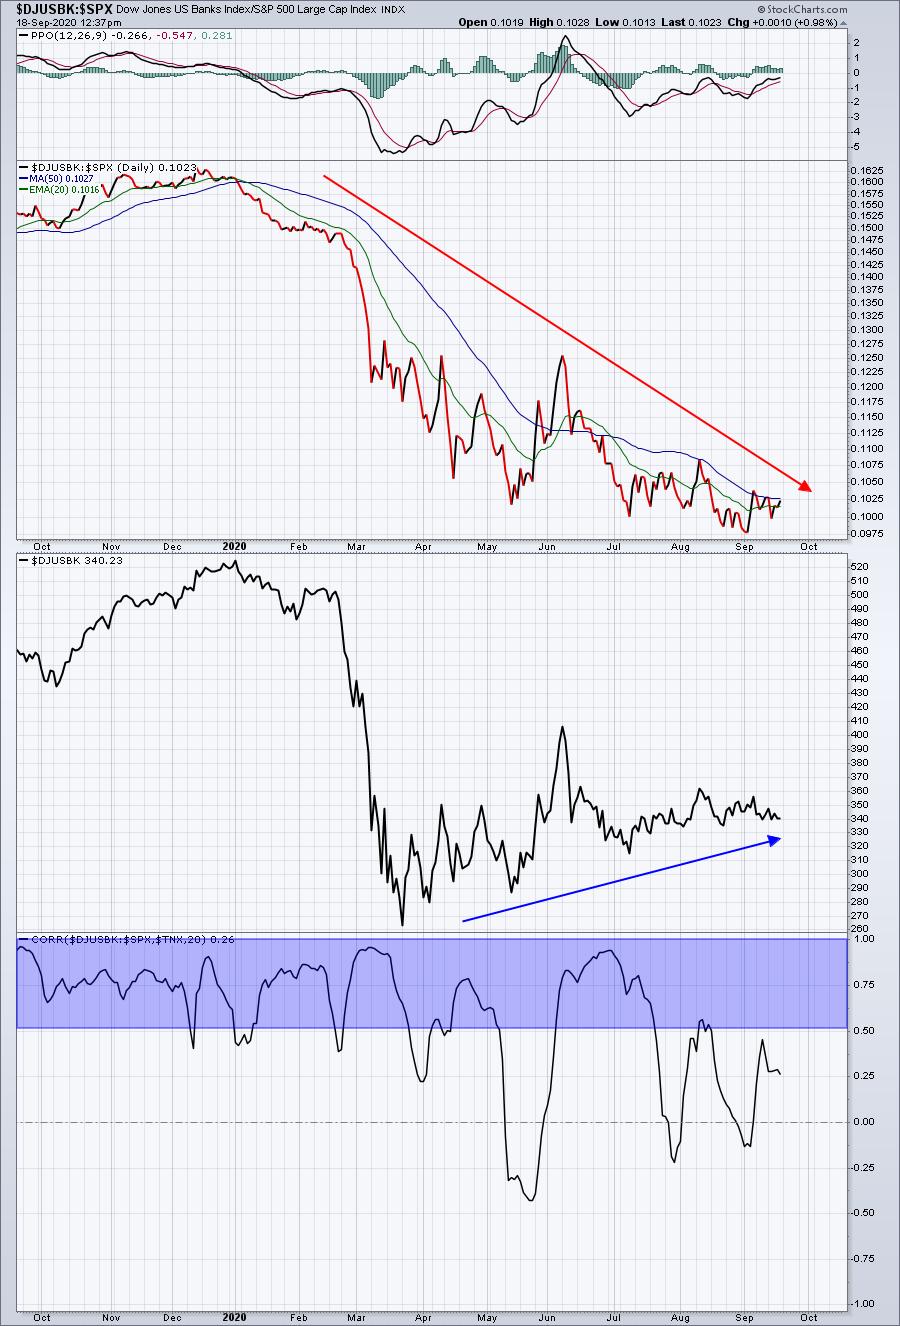
The top part of this chart shows the relative strength of banks declining throughout 2020 and we know the TNX has declined mostly during the year as well. That relationship is highlighted in the bottom panel where the blue-shaded area tells us the positive correlation is above 0.50. Recently, we've moved below that area, but overall, the positive correlation between the relative performance of banks (vs. the SPX) and the direction of the TNX is quite evident.
The middle panel, by the way, shows that banks have moved higher since that March low, but unfortunately it's the relative strength that really matters.
ChartLists
I like cash right now as a trader. I've been discussing better opportunities ahead and stocks are getting cheaper. I see no need to rush into anything right now. A few of those recent Short Squeeze ChartList stocks that I've discussed continue to perform well. As long as their uptrends remain in play, I'd be interested.
Otherwise, I think sitting mostly on our hands makes sense. The market's short-term technical picture is broken. Trading beneath a declining 20 day EMA is step 1 in recognizing that momentum is not on our side right now. Don't force things from a trading perspective. Again, building a portfolio slowly as prices decline makes sense because it's very difficult to spot the absolute exact bottom.
Earnings Reports
Here are the key earnings reports for the next two days, featuring stocks with market caps of more than $10 billion. I also include a few select companies with market caps below $10 billion. Finally, any portfolio stocks that will be reporting results are highlighted in BOLD. If you decide to hold a stock into earnings, please understand the significant short-term risk that you are taking. Please be sure to check for earnings dates for any companies you own or are considering owning.
Friday, September 18:
None
Monday, September 21:
None
Economic Reports
September consumer sentiment: 78.9 (actual) vs. 75.0 (estimate)
August leading indicators: +1.2% (actual) vs. +1.3% (estimate)
Happy trading!
Tom