
EB Daily Market Report - Wednesday, September 23, 2020
Executive Market Summary
- Futures were strong at the opening bell, although favoritism towards growth stocks dissipated
- Another strong home construction report was released this morning as the FHFA house price index topped expectations
- Traders turned quite negative this afternoon, however, as overall selling kicks back in
- As previously stated, the September 21-27 period represents the 3rd worst calendar week of the year historically, dating back to 1950
- Growth stocks are underperforming value stocks today (IWF:IWD)
- Energy (XLE, -3.07%) and technology (XLK, -2.32% are leading the selling
- Footwear ($DJUSFT) is strong on the heels of a very bullish quarterly report from Nike (NKE), which is offsetting big losses in the Dow Jones from technology stocks
- Salesforce.com (CRM, -4.17%) and Apple (AAPL, -3.26%) are the two biggest losers on the Dow Jones
- Tesla's (TSLA) weakness is driving auto stocks ($DJUSAU) lower
Market Outlook
The U.S. Dollar (UUP) has been gaining strength the past week and it's adding to it today. The UUP has broken above both its 20 day EMA and 50 day SMA and the former is quickly approaching the latter. We could see a "golden cross" in the very near future and that type of strength does not bode well for materials (XLB) and energy (XLE). To be quite honest, I'm not really sure what to make of the dollar. We saw a rather significant 9-year uptrend snapped recently, which adds to the bearish case. However, the 10 year U.S. treasury yield ($UST10Y) has been gaining vs. its German counterpart ($DET10Y) and that would normally point to a strengthening of the dollar. That's what we're seeing now. The following two charts should help you visualize this relationship:
$UST10Y - $DET10Y:
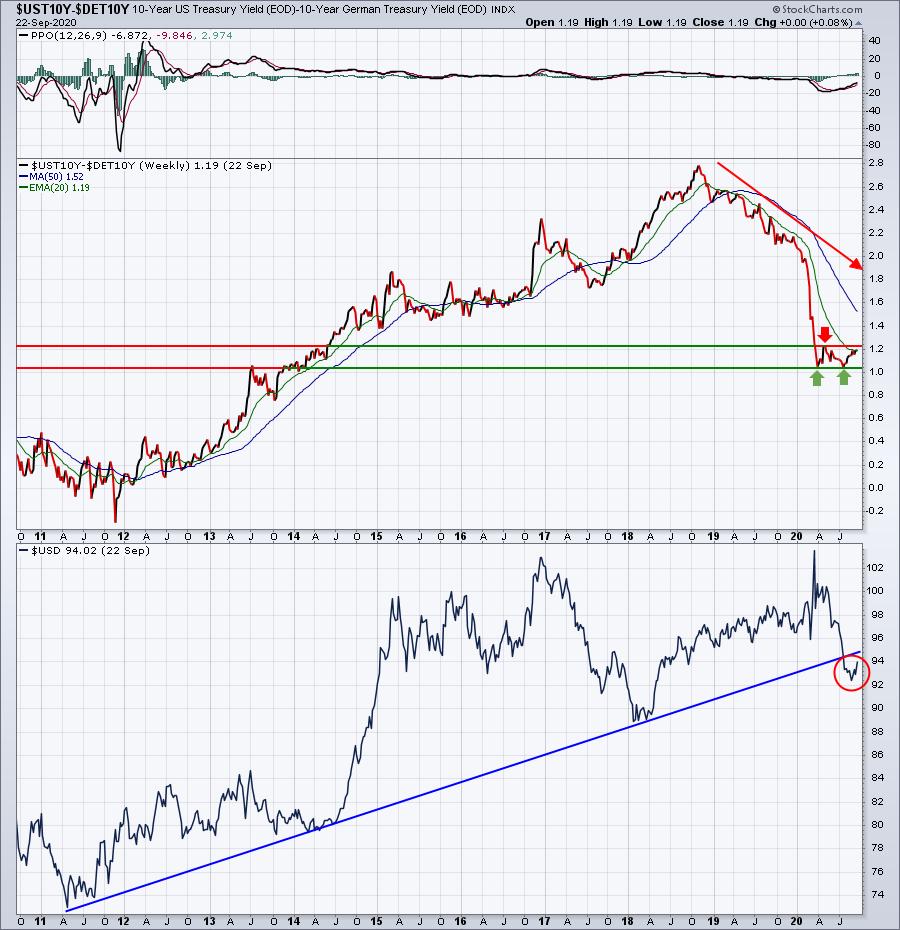
The obvious relationship here is that as the U.S. treasury yields rise faster than Germany's, the U.S. dollar rises. This makes good common sense as this would suggest that the U.S. economy is expanding more rapidly than Germany's. But in 2019, and especially in 2020, we've seen the reverse as this ratio has been declining rapidly. That led to dollar weakness that broke the 9-year uptrend.
UUP and XLB:$SPX:
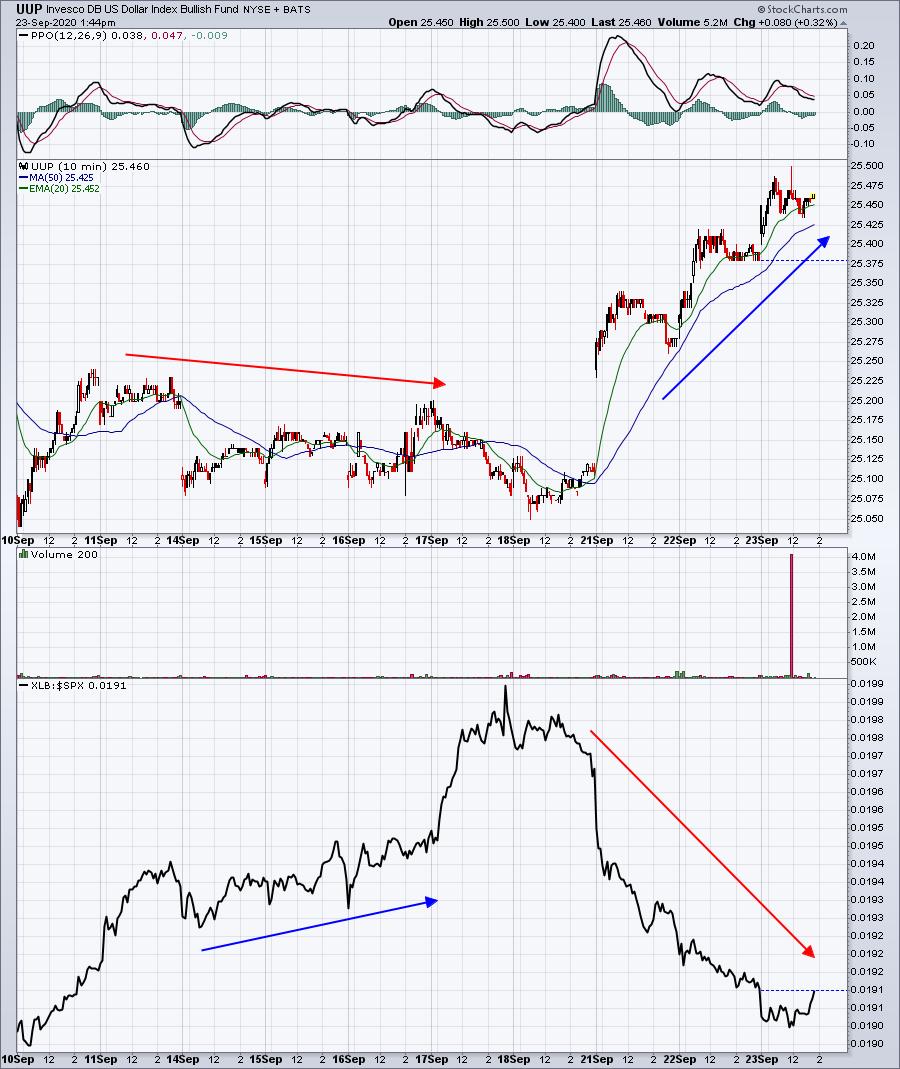
This is a 10 day chart that helps to explain the inverse relationship between the U.S. dollar proxy (UUP) and the relative performance of materials stocks (XLB:$SPX). This is the primary reason I didn't trust the recent leadership in materials. In order for the XLB to lead us to the upside, we'd need a resurgence in most commodities - not just a short-term uptrend, but a long-lasting one. Given my hesitation to call a bull or bear market in the dollar right now, it's very difficult to determine whether I'd want to include materials stocks in my portfolio. For now, I remain on the sidelines in terms of investing in this area of the market.
Sector/Industry Focus
Footwear ($DJUSFT) is clearly today's best performing industry group, and Nike's (NKE) blowout earnings report is the reason. I see the DJUSFT remaining a leader throughout the balance of 2020 as a result of its recent absolute and relative breakouts. A more notable leader today might be renewable energy ($DWCREE), however. It's the best industry group not named footwear and it's bouncing from a key level of support:
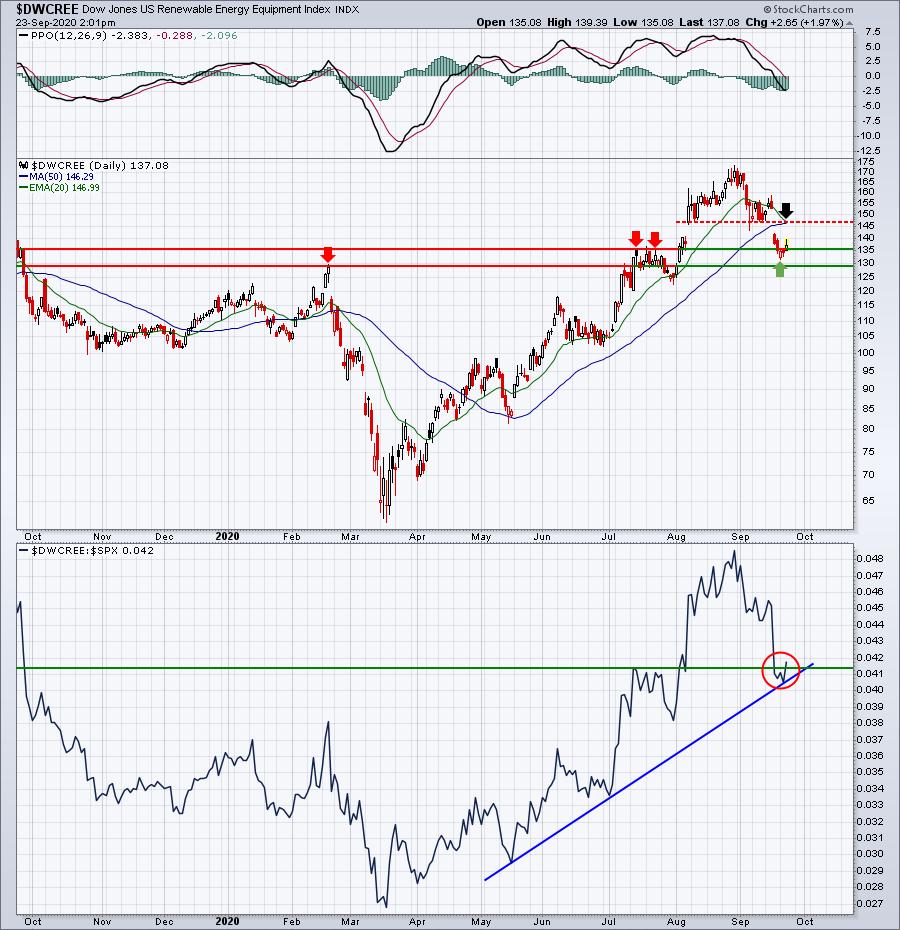
It might be premature to call a definitive bottom in place, but I do like the successful test of its relative uptrend line and price reversal from an important support zone. The red-dotted horizontal line marks both gap resistance and the declining 20 day EMA. The bulls will need to negotiate both of these before a confirmed bottom is in place.
ChartLists
The average annual return of the S&P 500 since 1950 is approximately 9%. The annualized return of the October 1st through October 18th period over these same 70 years is +14.48%, well above that 9% level. I ran a scan against the Strong Earnings ChartList (SECL). The purpose was to find stocks that could present great opportunities if we begin to see a pre-Q4 earnings advance as we historically do. I wanted top performing stocks on our SECL as of the early September market high, so I used SCTR scores > 95 as 15 trading days ago and SCTR scores <85 currently). Here is how you write the scan:
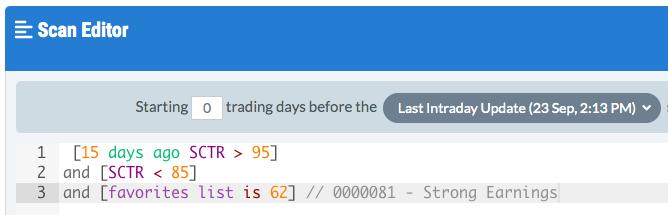
It returned 4 stocks, as follows:
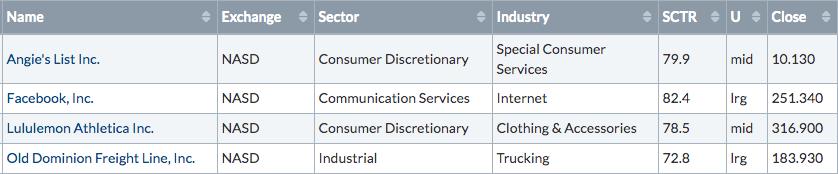
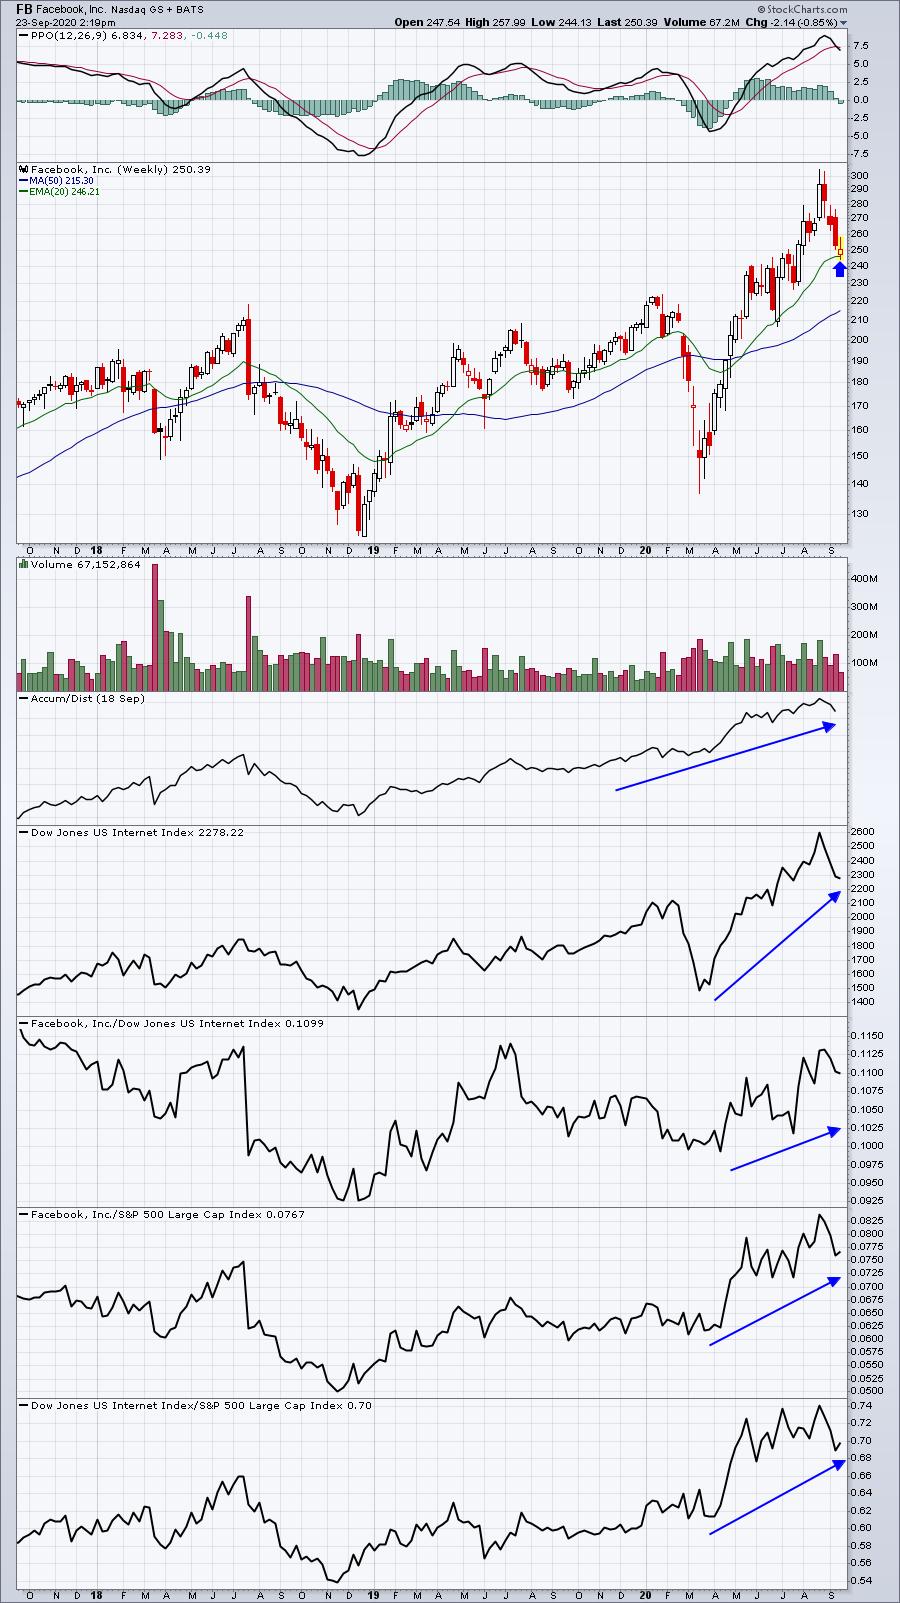
Of these four, two of them - FB and ODFL - are currently testing their rising 20 week EMAs on their Big Picture weekly charts:
FB:
ODFL:
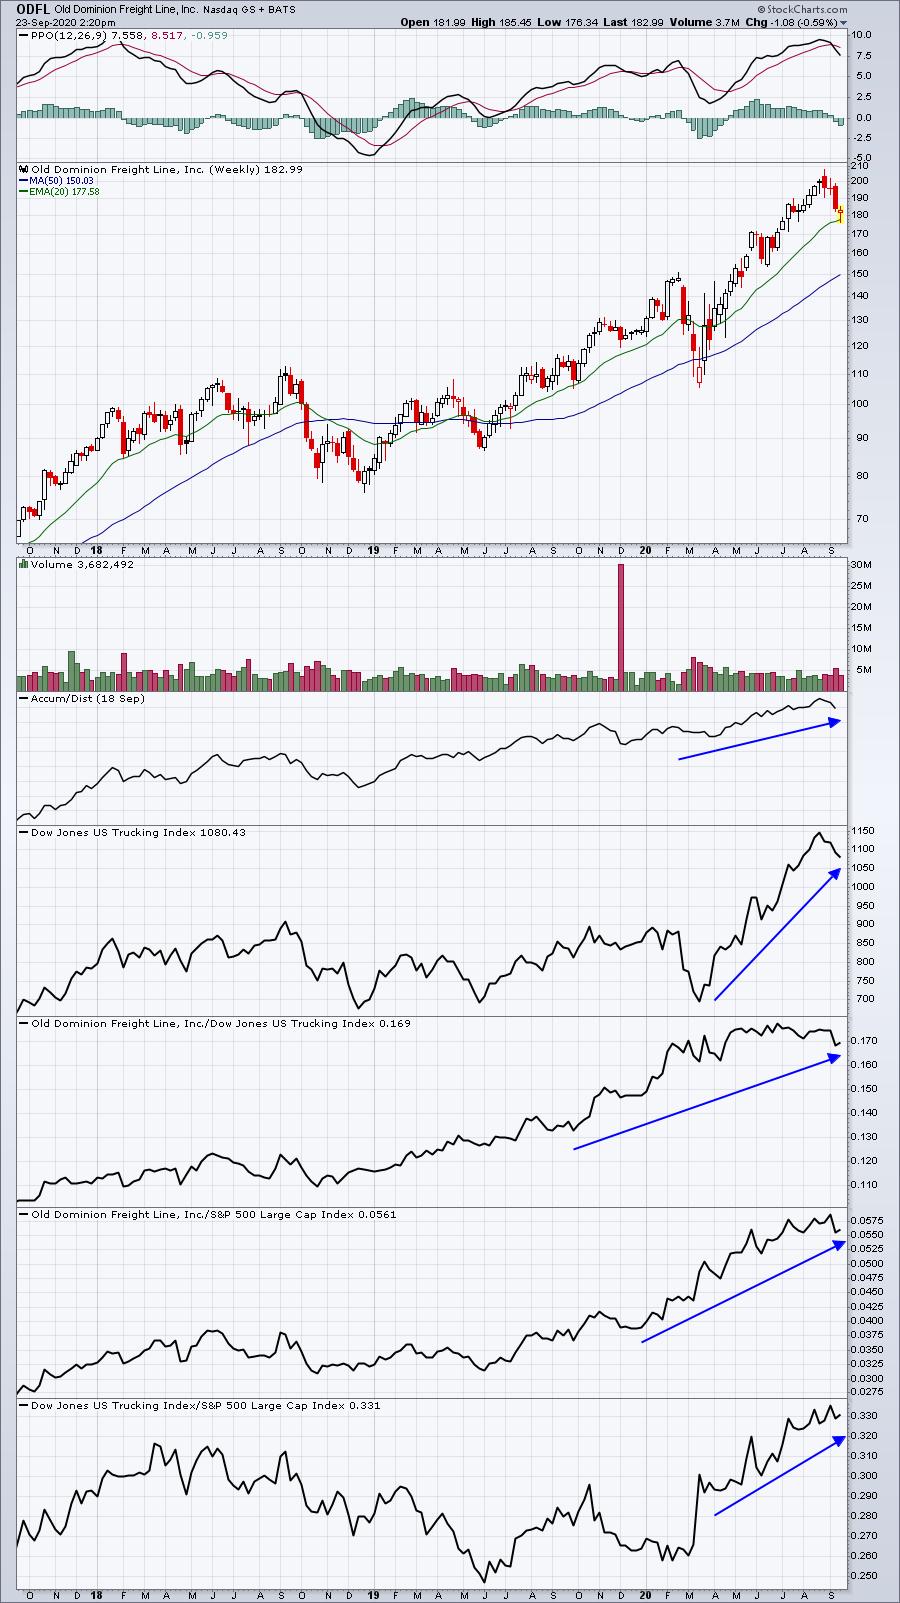
Both FB and ODFL look solid as we head for Q4. 20 week EMA tests are routine and both companies are leaders within strong industry groups. While I'm still ok with both ANGI and LULU, the current technical picture, in my view, supports FB and ODFL.
Earnings Reports
Here are the key earnings reports for the next two days, featuring stocks with market caps of more than $10 billion. I also include a few select companies with market caps below $10 billion. Finally, any portfolio stocks that will be reporting results are highlighted in BOLD. If you decide to hold a stock into earnings, please understand the significant short-term risk that you are taking. Please be sure to check for earnings dates for any companies you own or are considering owning.
Wednesday, September 23:
GIS, CTAS, FUL, WOR, JKS
Thursday, September 24:
COST, ACN, KMX, TCOM, FDS, DRI, MTN, JBL, BB, RAD, AIR
Economic Reports
July FHFA house price index: +1.0% (actual) vs. +0.6% (estimate)
September PMI composite flash: 54.4 (actual) vs. 54.5 (estimate)
Happy trading!
Tom