
EB Daily Market Report - Thursday, September 24, 2020
Executive Market Summary
- Futures were weak and our major indices opened lower
- All key indices have turned positive, however, with leadership coming from the NASDAQ and technology (XLK, +1.38%)
- Computer hardware ($DJUSCR) is up more than 2% on the session with semiconductors ($DJUSSC) and software ($DJUSSW) both strong as well
- The dollar (UUP) has backed off an earlier high, providing a bit of relief for materials, which are in the upper half of sector performers
- Defensive groups are also performing well, led by real estate (XLRE, +1.09%)
- New home sales blew away estimates in August and home construction ($DJUSHB) is higher by 2%
- Goldman Sachs (GS, +4.74%) is rebounding, helping to lead the Dow Jones higher; Boeing (BA, -2.75%) weakens
Market Outlook
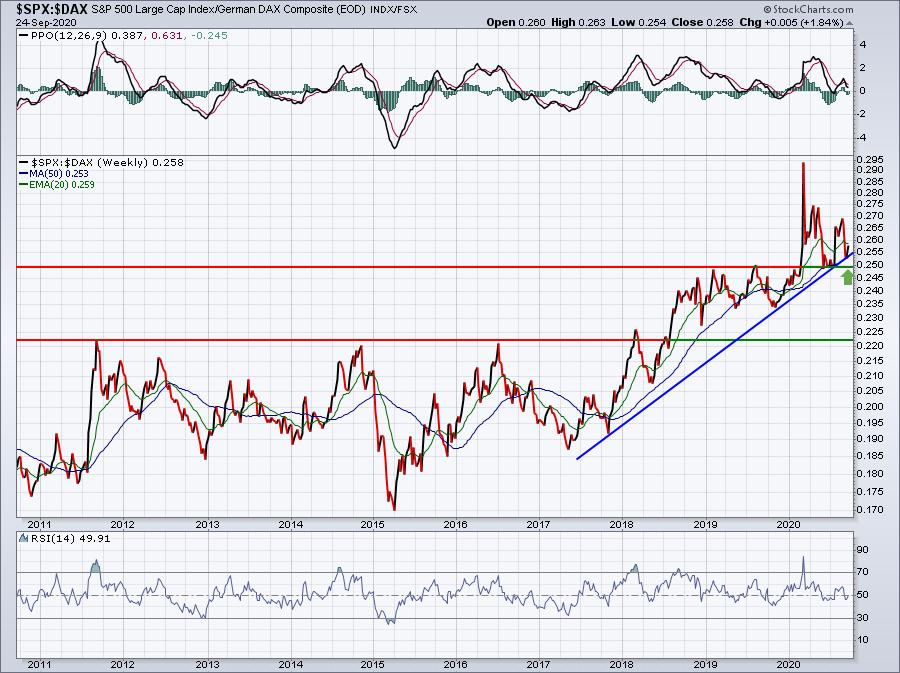
Is it better to invest in the U.S. or in Europe, more specifically Germany? I tend to follow the relative chart of the 2 countries and let the market tell me. I have found through all of my research that Germany is the best country in Europe to follow as it has mostly a positive correlation with the U.S. In other words, if we see the German DAX ($DAX) break out, we should expect the same from the S&P 500. And vice versa. Here's a current long-term look at this relationship:
Most investors who gain exposure to Germany do so via EWG (iShares MSCI Germany ETF). There's one major consideration, however, that you need to be aware of. These foreign ETFs have a currency component. In other words, the EWG will not track the DAX exactly. During a rising dollar environment, there'll be a negative impact by owning the EWG. It will underperform the DAX. If the dollar is declining, however, you'll get a currency-related bump in your EWG return. Just be aware of that impact.
Looking at the chart, I'd say it still makes sense to overweight the U.S. We remain in a multi-year relative uptrend. If that relative support at the green arrow is violated, I'd reconsider. Until then, stick with the U.S. into Q4.
Sector/Industry Focus
Financials (XLF) have not been leading, but there are healthy areas within that sector. One leader throughout the pandemic was specialty finance ($DJUSSP), but it needs to see some buying very soon:
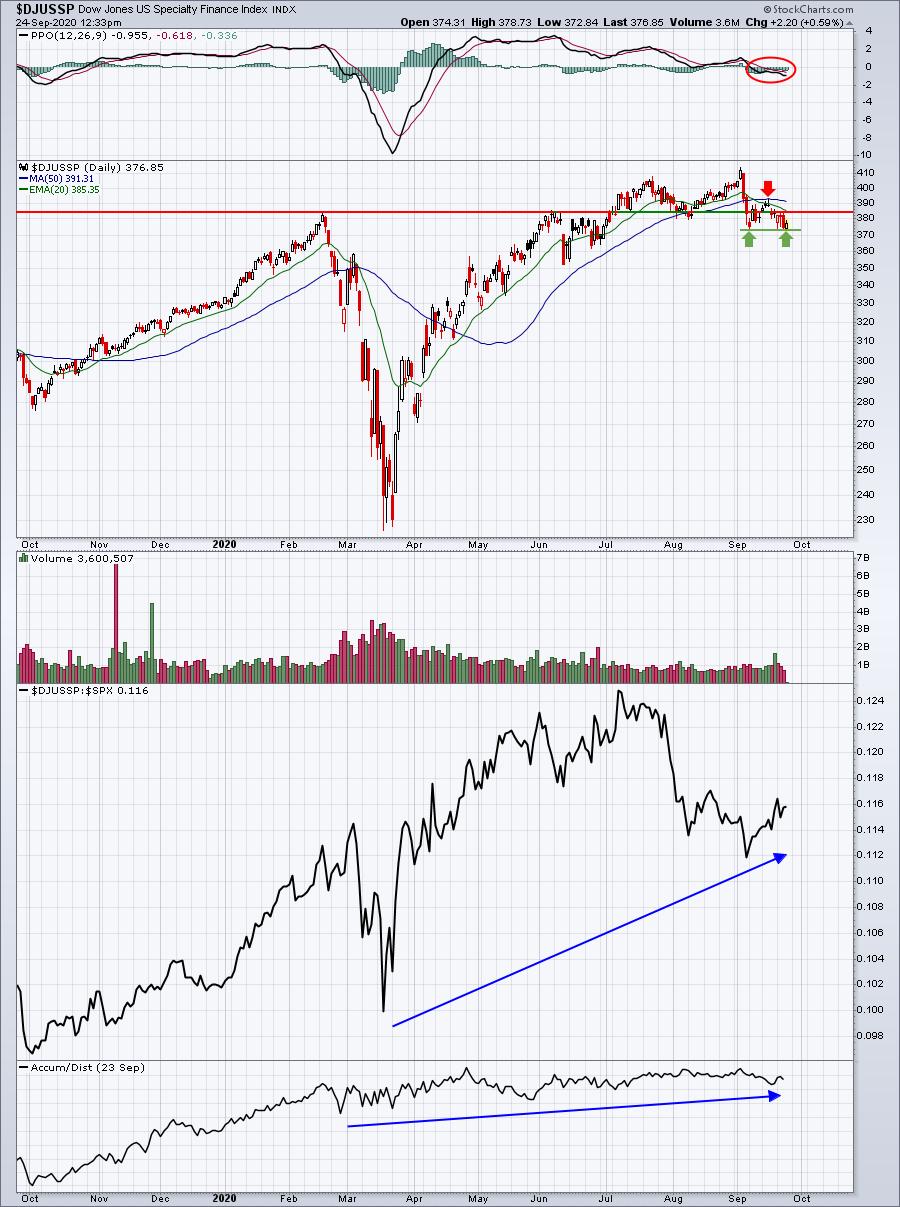
The two green arrows mark a double bottom that's occurred just beneath what was pretty solid price support. In addition, relative strength vs. the benchmark S&P 500 has been falling. Finally, that daily PPO is below the centerline and falling. It's time for a recovery here or there could be more technical selling around the corner.
ChartLists/Strategies
I wrote an article this morning in my Trading Places blog at StockCharts.com, explaining why I believe that Tesla (TSLA) is being accumulated currently, despite the drop in its stock price during September. You can read that article by CLICKING HERE. I also mentioned that I would be providing a stock tomorrow in our EB Digest newsletter that is showing similar characteristics (ie, falling stock price in September, but with rising AD line). I wanted to share with our members how I ran this scan and the rationale behind it. First, here's the scan:
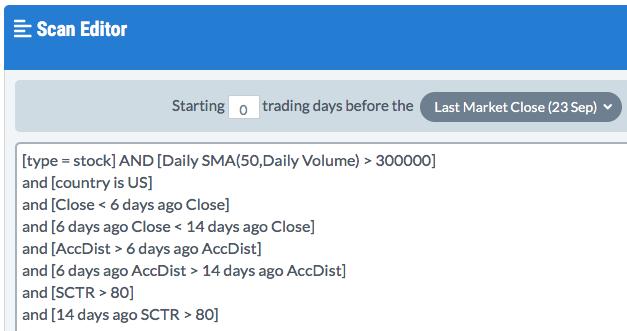
Here's the rationale. The S&P 500 topped on the close September 2nd ("14 days ago" from yesterday's close). After a selloff and reaction bounce, it set another short-term top on September 15th ("6 days ago" from yesterday's close). So that's why you see the "14 days ago" and "6 days ago" in the scan syntax. The idea was to find stocks that showed lower closing prices from September 2nd to September 15th to September 23rd, while also simultaneously showing higher AD lines at each of those dates. So prices move lower, but AD lines rise - a different type of positive divergence in my view. Also, the SCTR must have been above 80 on both September 2nd and September 23rd (solid relative strength). Here were the stocks (and ETFs) that were returned:
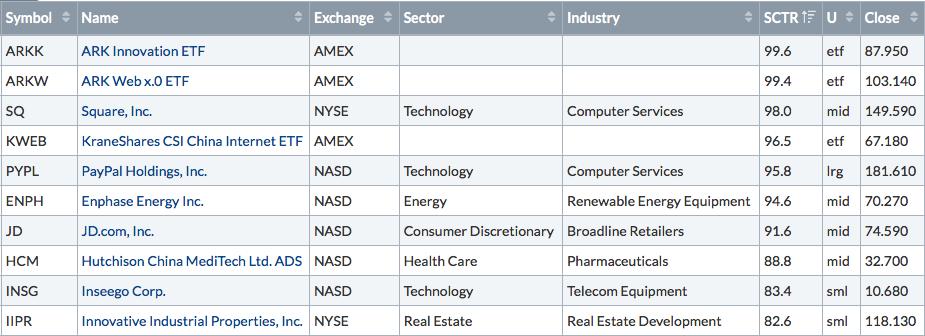
You can see that there weren't many. I find PYPL, JD, and INSG the most interesting. Both PYPL and JD remain quite positive technically, especially JD, which is the stock I plan to feature in the EB Digest Friday morning. INSG is interesting because it's actually been beaten up rather badly. Is it, in fact, being accumulated during what appears to be a bearish technical period? INSG will be very interesting to watch. If it rallies significantly in Q4, the above scan syntax should be considered in future weeks/months (especially during short-term selloffs), but the syntax will need to be tweaked based on key tops (won't be 14 days ago and 6 days ago) in the S&P 500. Anyhow, here's the current charts on JD and INSG:
JD:
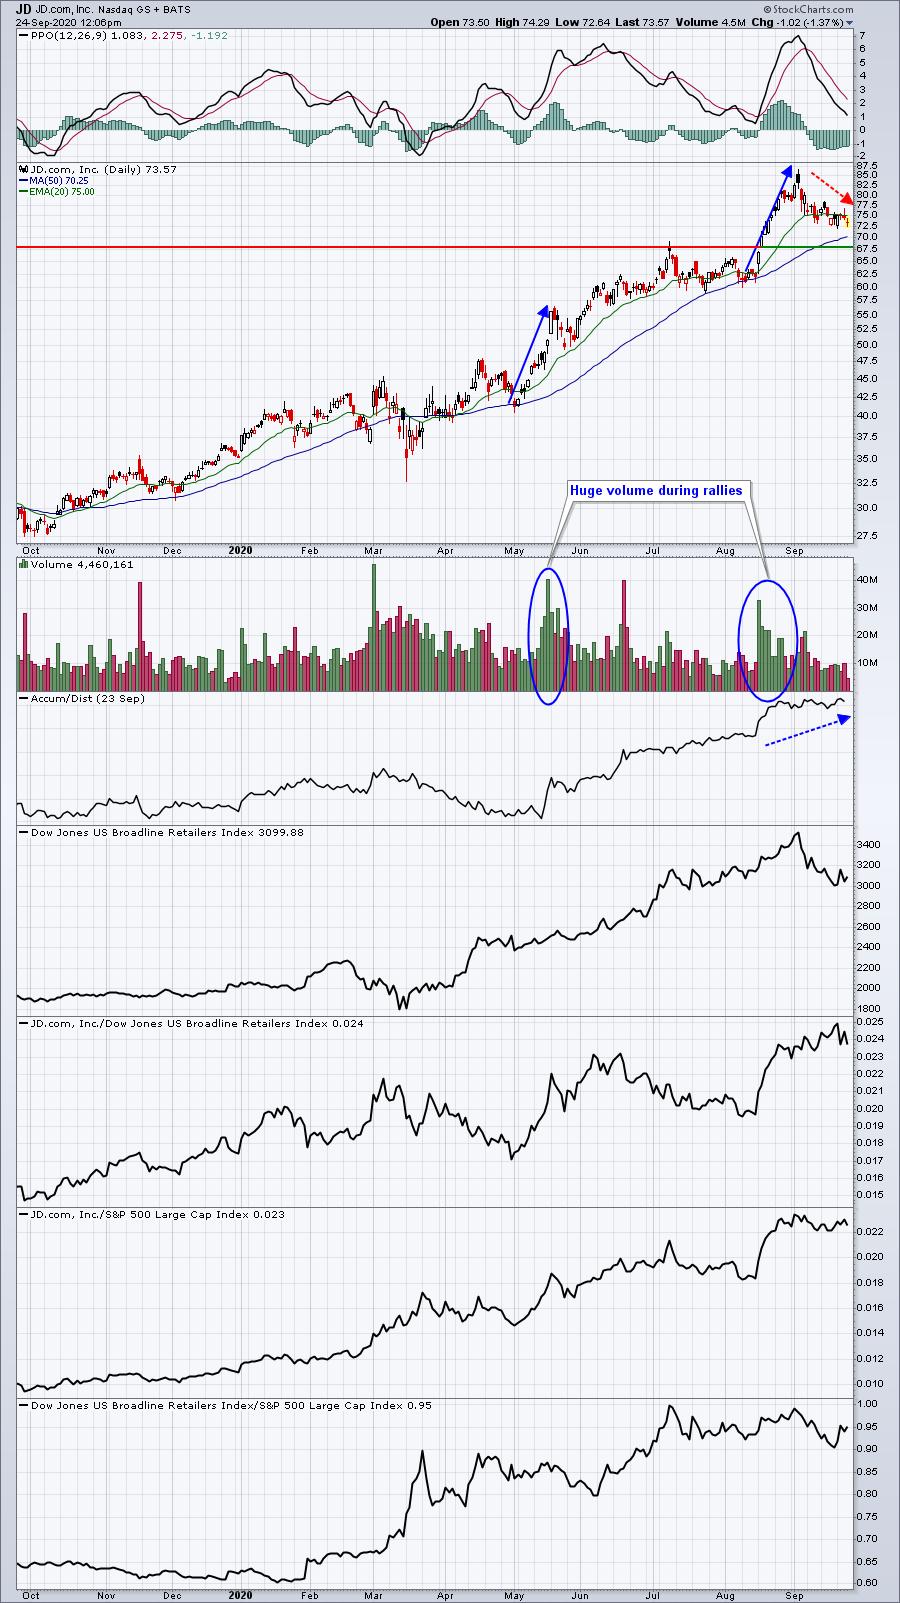
JD is right up there, along with TSLA, as a leader in the stock market right now. It's a leader among a very strong broadline retail group ($DJUSRB). The rising AD line simply adds confirmation to an otherwise already bullish price chart.
INSG:
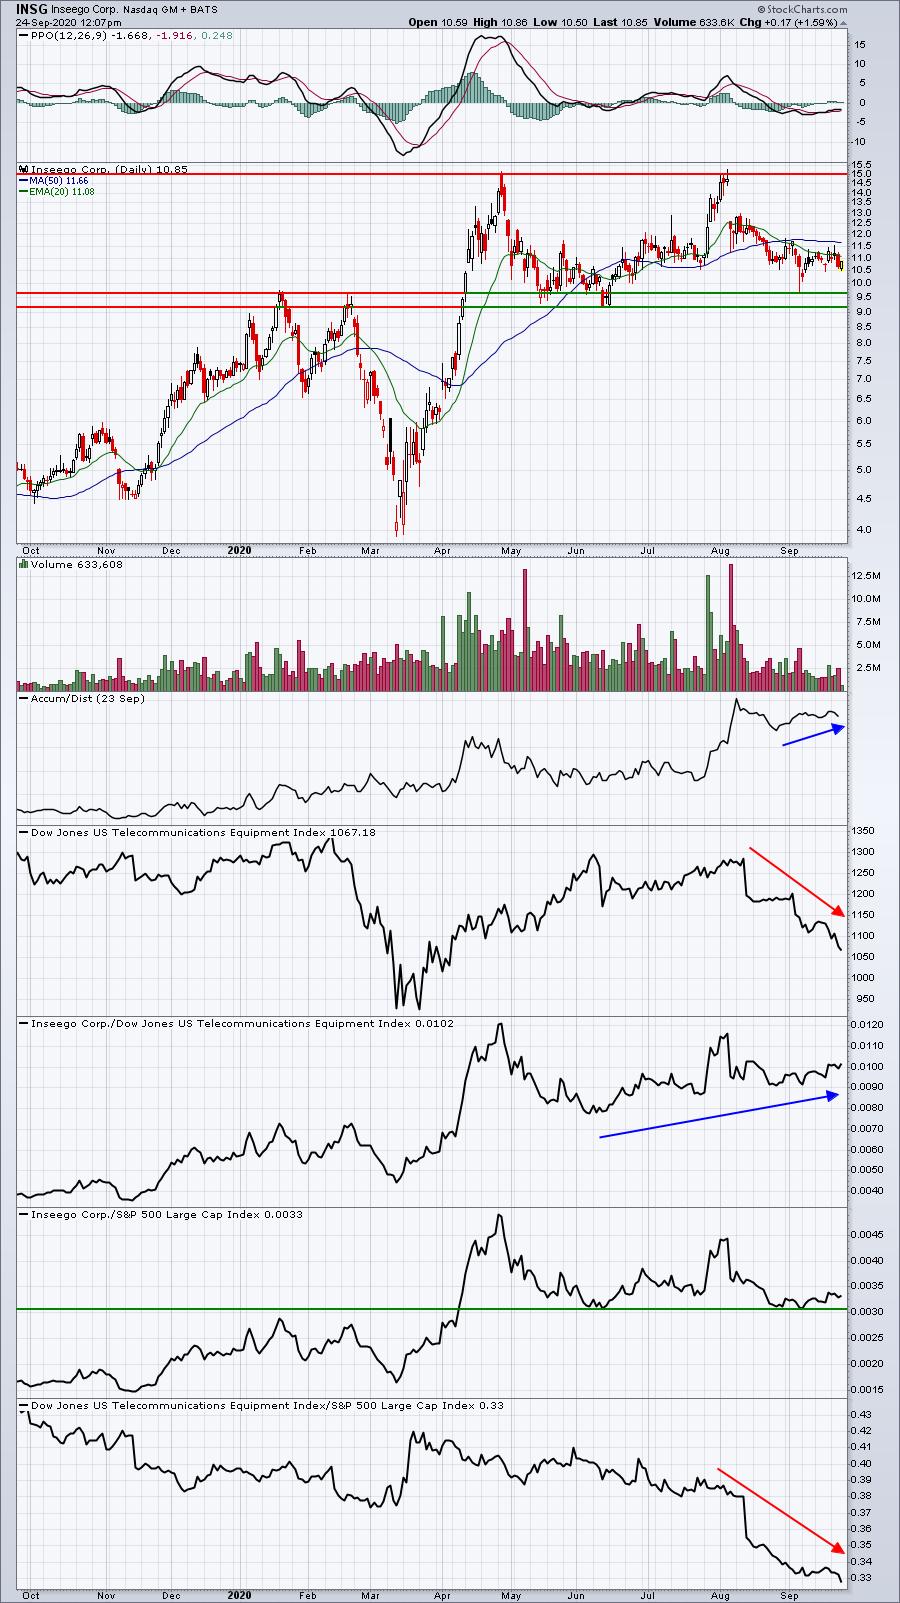
INSG is part of an incredibly weak telecom equipment ($DJUSCT), but has still managed to hang in with the overall S&P 500 as it remains a leader among its peers. That AD line tells me this stock could be worth a trade. I wouldn't be surprised at all if we see a Q4 explosion higher here. You must keep stops in play, however, and 9.20-9.70 appears to be major price support.
Earnings Reports
Here are the key earnings reports for the next two days, featuring stocks with market caps of more than $10 billion. I also include a few select companies with market caps below $10 billion. Finally, any portfolio stocks that will be reporting results are highlighted in BOLD. If you decide to hold a stock into earnings, please understand the significant short-term risk that you are taking. Please be sure to check for earnings dates for any companies you own or are considering owning.
Thursday, September 24:
COST, ACN, KMX, TCOM, FDS, DRI, MTN, JBL, BB, RAD, AIR
Friday, September 25:
None
Economic Reports
Initial jobless claims: 870,000 (actual) vs. 880,000 (estimate)
August new home sales: 1,011,000 (actual) vs. 875,000 (estimate)
Happy trading!
Tom