
EB Daily Market Report - Friday, September 25, 2020
Executive Market Summary
- Futures were higher overnight, but turned lower this morning
- Durable goods were released and came in below expectations (this report does tend to be quite volatile)
- Technology (XLK, +1.28%) is once again the market's leader as the NASDAQ outperforms
- The IWF:IWD (growth vs. value) has risen above 1.82 as money continues rotating back to growth
- Costco (COST) reported quarterly results, easily surpassing EPS estimates, but is down more than 2%
- Commodities remain under pressure as the dollar (UUP, +0.43%) continues strengthening
- Crude oil ($WTIC) is hovering near the $40 per barrel level as energy (XLE, -0.99%) is underperforming
- Consumer staples (XLP, -0.19%) is the only other sector in negative territory
- Cruise lines are strong today as NCLH, CCL, and RCL are among the top 5 S&P 500 stocks
Market Outlook
The S&P 500 is down roughly 52 points, or 1.65%, for the week, but there's definitely been a very important bullish development taking place beneath the surface. One of our favorite ratios, the IWF:IWD is climbing again as money rotates in very bullish fashion:
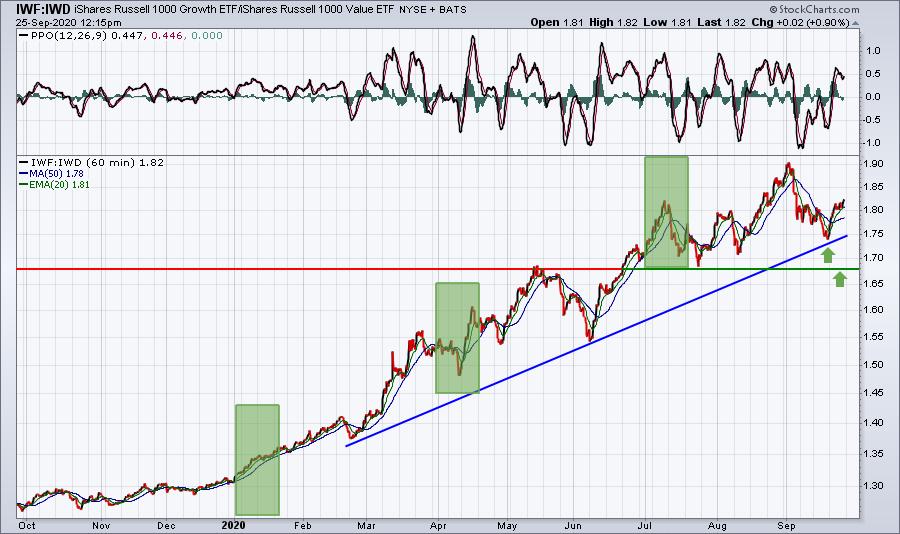
I will be sharing the above chart in the ChartWatchers newsletter this weekend. The green-shaded area marks "pre-earnings" run ups in growth stocks vs. value stocks in each of the prior 3 quarters and we're beginning to see it again now. This chart alone will tell us where Wall Street is placing its bets as a huge earnings season approaches. I like what I'm seeing thus far. Yes, this week is historically bearish and, yes, the S&P 500 is lower. But watching key intermarket developments as they occur is critical in truly assessing market conditions.
Sector/Industry Focus
Another way to view rotation is to compare performance of the S&P 500 to the relative performance of aggressive sectors vs. the S&P 500. Let me show you a chart and I think you'll once again be able to see the relative strength shifting towards aggressive areas of the market, while the S&P 500 is falling. Just looking the S&P 500 might have you thinking bearish thoughts, but it's really difficult to think too bearishly when you see money rotating towards offense:

The XLK, XLY, and XLC are all gaining vs. the S&P 500. So the selling that's occurring is, by default, coming out of areas that tend to be more value-oriented. Certainly, financials remain under intense selling pressure, and should mostly be avoided.
Everyone can interpret different charts in different ways, but I nearly always view a rising XLK:$SPX, XLY:$SPX, and XLC:$SPX as bullish. If Wall Street was truly bearish U.S. equities in the weeks and months ahead, we'd see the opposite rotation into defensive areas of the market. I see a VERY strong Q4 ahead.
ChartLists/Strategies
I ran our Downtrend Reversal scan this morning against our Strong Earnings ChartList (SECL) and Strong Future Earnings ChartList (SFECL) to see which stocks might be poised for short-term turnarounds. There were 6 stocks returned as follows:
CRTO, FRTA, MRNA, SGRY, SHYF, TTM
2 caught my interest:
MRNA:

There's a bottoming reverse head & shoulders in play here. If MRNA can clear 70.50, it would not only clear neckline resistance, but also the 50 day SMA, currently at 70.22. The AD line remains strong and the daily PPO is just now climbing above its centerline. An increase in volume to clear overhead resistance would represent confirmation of a bottom.
SGRY:

SGRY has been one of the best, if not the best, health care provider ($DJUSHP) performers throughout this pandemic. The recent selling has led to a 50 day SMA test, and was likely prompted by the negative divergence that formed on its most recent price high. Gap support is closer to 17, so building a position from current price down to that level wouldn't be a bad strategy for anyone with a higher-than-normal risk tolerance level.
Earnings Reports
Here are the key earnings reports for the next two days, featuring stocks with market caps of more than $10 billion. I also include a few select companies with market caps below $10 billion. Finally, any portfolio stocks that will be reporting results are highlighted in BOLD. If you decide to hold a stock into earnings, please understand the significant short-term risk that you are taking. Please be sure to check for earnings dates for any companies you own or are considering owning.
Friday, September 25:
None
Monday, September 28:
WB, THO, SINA, UNFI
Economic Reports
August durable goods: +0.4% (actual) vs. +1.5% (estimate)
August durable goods ex-transports: +0.4% (actual) vs. +1.2% (estimate)
Happy trading!
Tom