
EB Daily Market Report - Tuesday, September 29, 2020
Upcoming Events
We have a VERY ambitious schedule of events for our members (and some are open to the public as well) in October and we have them summarized HERE.
Executive Market Summary
- Futures were down slightly as we approached the opening bell
- Our major indices have been mostly lower today, but are attempting to claw their way into positive territory
- At last check, only utilities (XLU, +0.12%) were higher with the remaining 10 sectors lower on the session
- The only sector to lose more than 1%, however, is energy (XLE, -2.59%) as crude oil ($WTIC, -3.52%) is back below $40 per barrel
- Renewable energy ($DWCREE) and footwear ($DJUSFT) are among today's leaders, while REITs and oil areas are primary underperformers
- Semiconductors ($DJUSSC) are up nearly 1%, but other technology industry groups are relatively flat
- The U.S. dollar (UUP) has retreated for a second straight day; gold ($GOLD) and silver ($SILVER) are performing very well as a result
- S&P 500 top performers include Paycom Software (PAYC) and Advanced Micro Devices (AMD)
- Oil stocks litter the bottom of the S&P 500 leaderboard
Market Outlook
As you likely already know, I'm a HUGE fan of history. I believe many historical trends happen for a very good reason. For instance, the 26th of one calendar month to the 6th of the next calendar month historically is very bullish. In fact, it's so bullish that it nearly accounts for all of the S&P 500 gains since 1950. Yep, you just read that right. About 35% of all days (those days that fall from the 26th through the 6th) since 1950 account for more than 90% of the gains. And it's all about money flows. Money comes into the market at the beginning of the month from pensions, 401(k)s, etc. and those anticipating the new money are buying ahead of that inflow.
So I took this one step further yesterday and did an analysis of the S&P 500 since November 19, 2018. That was the day we started the Model Portfolio. I actually did the analysis of annualized returns for four different periods of the calendar month on the S&P 500, and then did the same calculation for our Model Portfolio, which has trounced the S&P 500 since its inception nearly two years ago. Here is the breakdown for each:
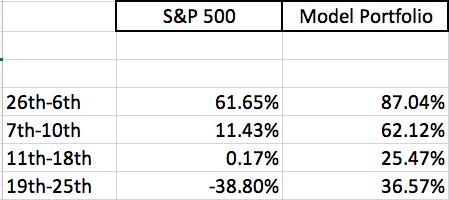
Remember, these are "annualized" returns. Our Model Portfolio is crushing the S&P 500 during every period, and performing quite well even during the periods that typically represent profit taking periods, like the 7th through the 10th and the 19th through the 25th.
I thought it was interesting and wanted to share it.
Sector/Industry Focus
Plenty of investors choose to "diversify", which essentially means putting half your money into lagging areas of the market. I don't like this theory. Even Warren Buffett, one of the best investors of all time, says that "diversification is a protection against ignorance". I don't believe Mr. Buffett meant it any sort of mean way. Instead, I think he was saying that if you choose to diversify, you're completely ignoring what's working in the market and putting your money to work in things that aren't working. And "going up" is not the same as "working". For me, my money is only working if I'm outperforming. If the S&P 500 goes up 20% and my account grows 10%, how well have I truly done? I don't think very well.
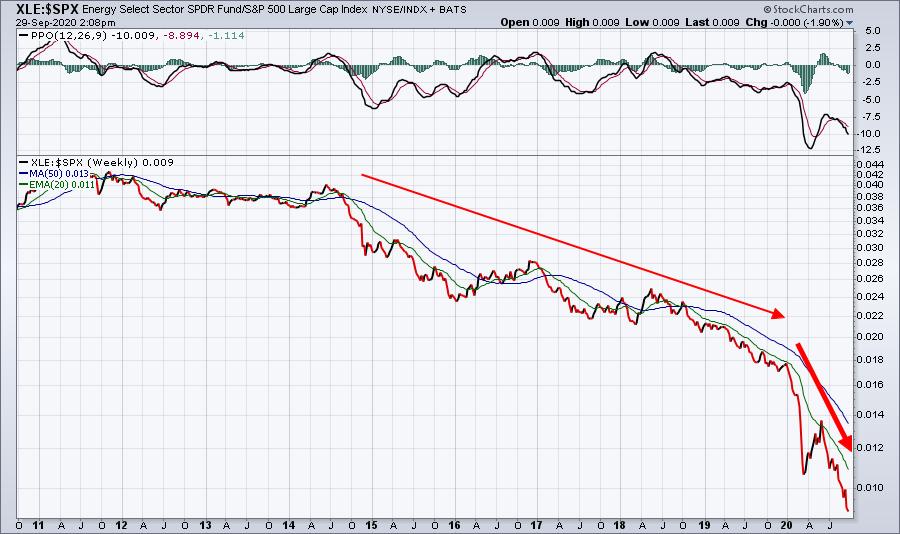
The poster child of Mr. Buffett's "ignorance" over the past decade has to be energy stocks (XLE), which is lagging the market badly once again today. I have no problem owning energy names when they're in favor, but look at this relative chart for the past 10 years:
Many diversification strategies "rebalance" their portfolios every quarter or every year, meaning that money is taken out of areas that have been outperforming and "rebalanced" by putting those gains to work in areas that are underperforming. Imagine taking money out of Apple (AAPL) or Amazon.com (AMZN) the past several years and "rebalancing" by buying energy.
What has diversification done for you?
In my opinion, the only time it would make sense to begin thinking about the XLE as an investment is when the relative price action is above the 20 week EMA, which in turn is above the 50 week SMA. It's only happened a three times in the past 9 years - in 2014, 2016, and 2018 - and each time it failed. When it fails, it makes sense to stay away from the group until it can show relative strength again. We want to AVOID areas not working, not continue to pour money down a rat hole.
ChartLists/Strategies
I looked at all 72 Short Squeeze ChartList (SSCL) stocks today and I'd be interested in perhaps 30% of them. The other 70% I wouldn't touch, and that's consistent with how I typically approach this ChartList. Many of these stocks are being shorted for good reason. High short % of float does not scream "BULLISH!" We need to see companies build relative strength, begin to trend above key moving averages, and ultimately break out on heavy volume to trigger the emotional panic buying. Here's how I'd break down the 30% of this ChartList that interests me:
Currently In A Short Squeeze
There are a dozen stocks on the SSCL that I believe are putting pressure on short sellers based on current or recent price action. The top 5, in my opinion, are JKS, GME, WKHS, GOGO, and RH. Others putting pressure on the shorts include BBBY, OTRK, HIBB, SCVL, DKS, W, and BGFV. JKS could be a poster child for what a short squeeze looks like:
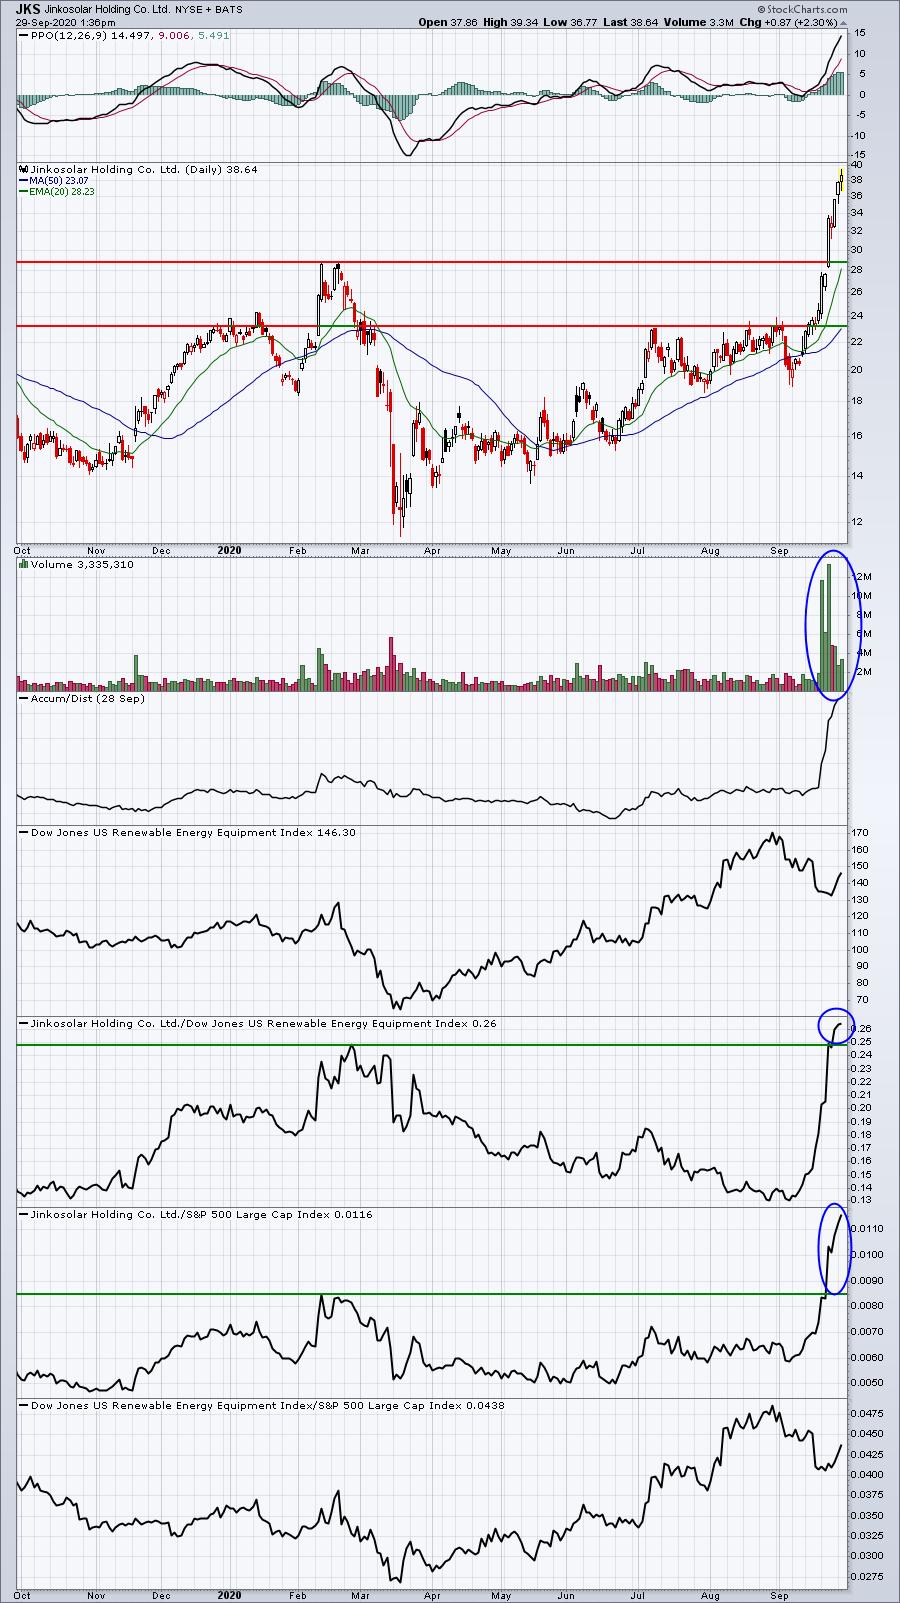
Volume here has been crazy and we're seeing a melt up. There's no doubt that shorts are trampling each other, heading for the exit.
On The Verge Of A Potential Short Squeeze
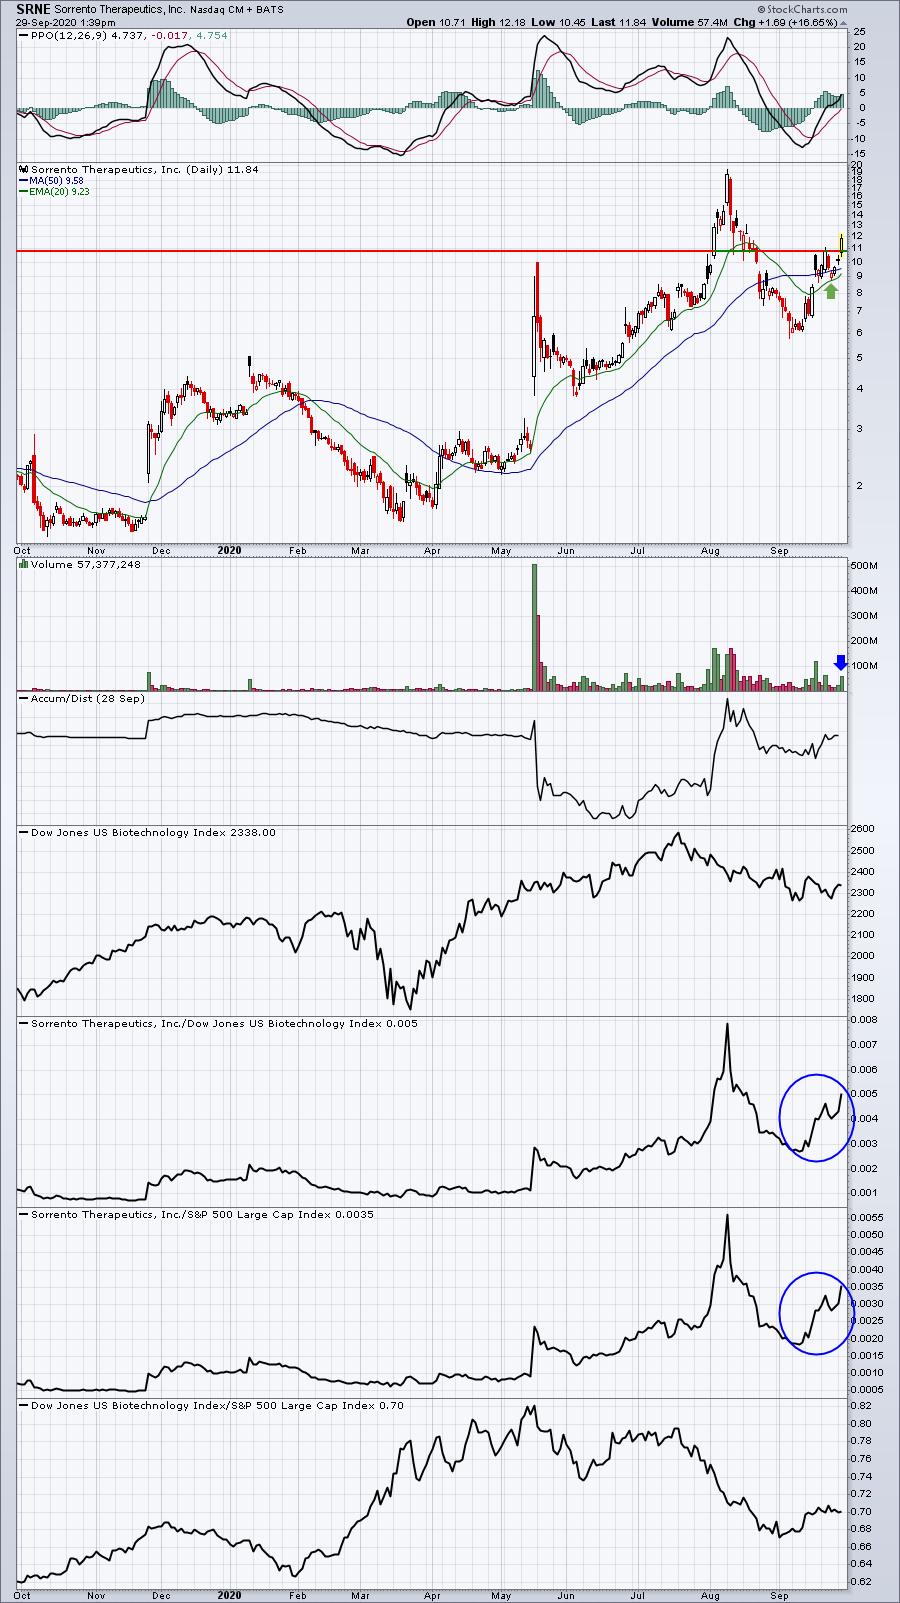
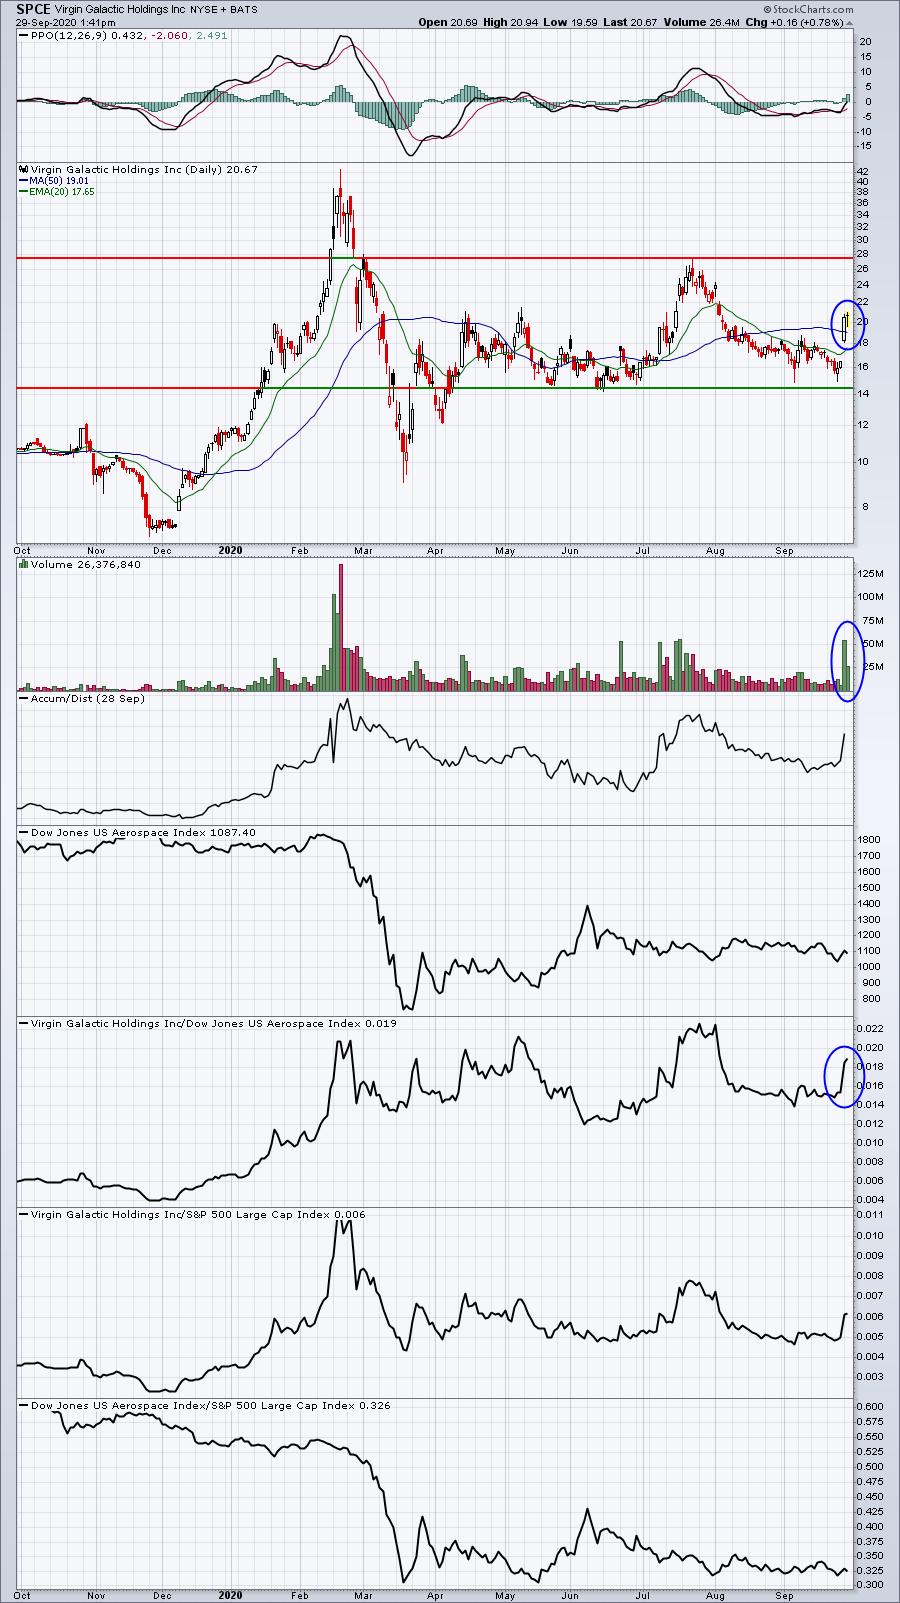
I see 3 stocks that could just be starting a significant short squeeze - SRNE, SPCE, and SPWR. Here are their charts:
SRNE:
SPCE:
SPWR:
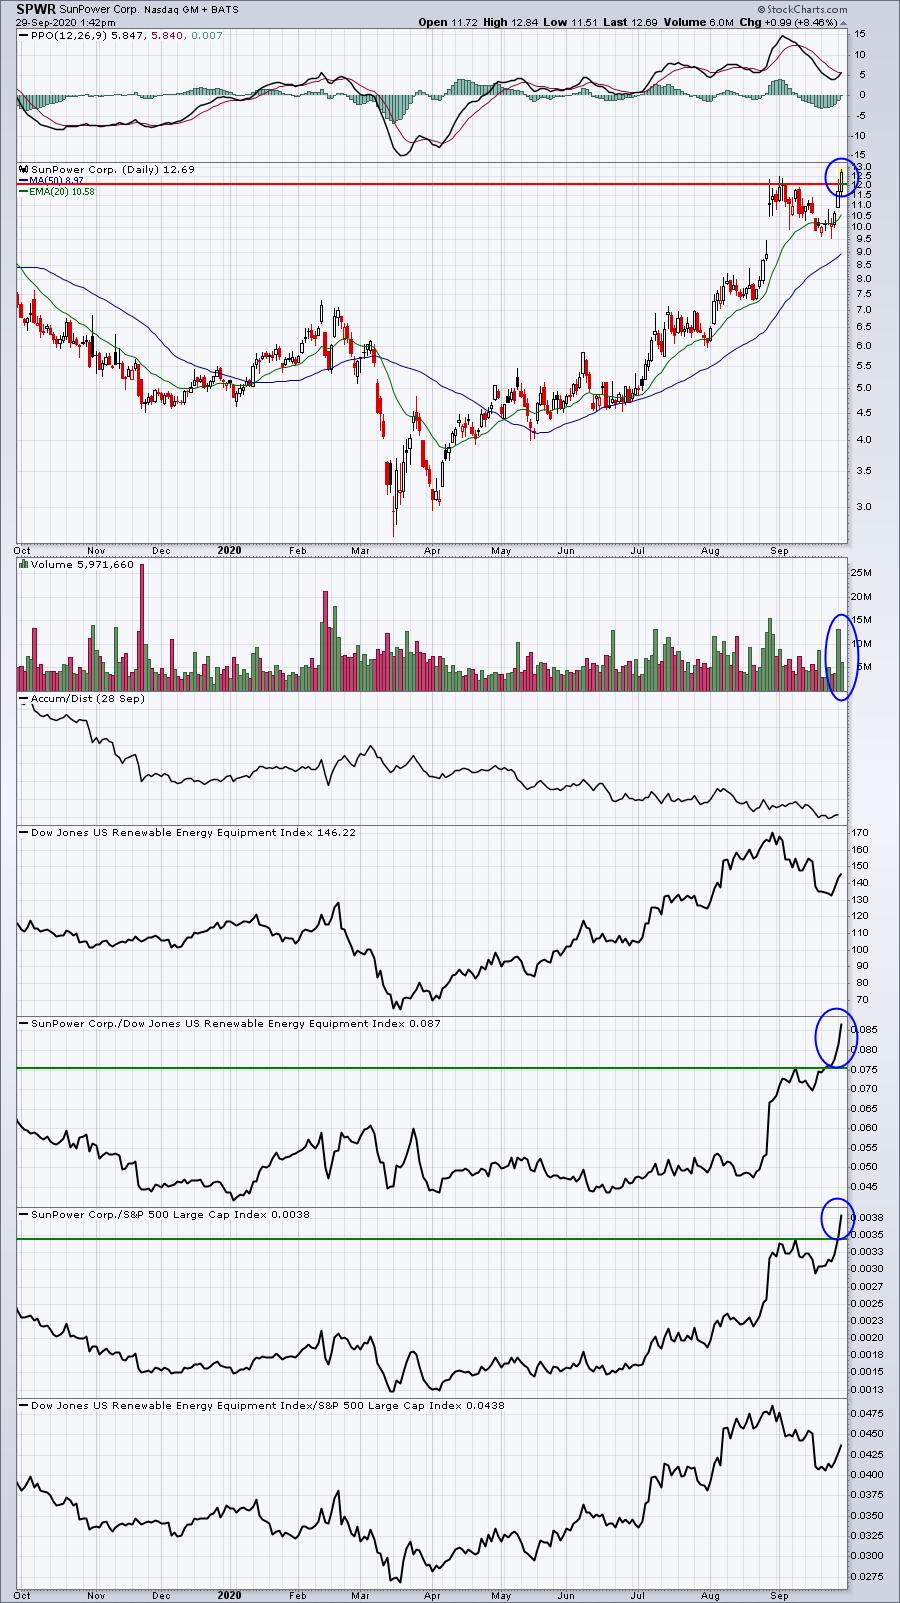
Of these 3, the least reliable in my opinion would be SPCE, which is part of the very weak aerospace group ($DJUSAS). The most reliable, if there is such a thing, would be SPWR simply because the renewable energy space ($DWCREE) is hot right now. The entire group is up more than 13% since Thursday's low. It also doesn't hurt that SPWR is setting new 52 week highs, which could trigger more buying from momentum traders as well.
Setting Up In Bullish Short Squeeze Fashion, But Needs A Catalyst
I see another 7 stocks on the SSCL that need a boost to trigger some of the panic buying necessary to start a major short squeeze. The stocks are SDC, AKTS, SIG, CVNA, BE, and AVYA. As an example, let's look at AKTS:
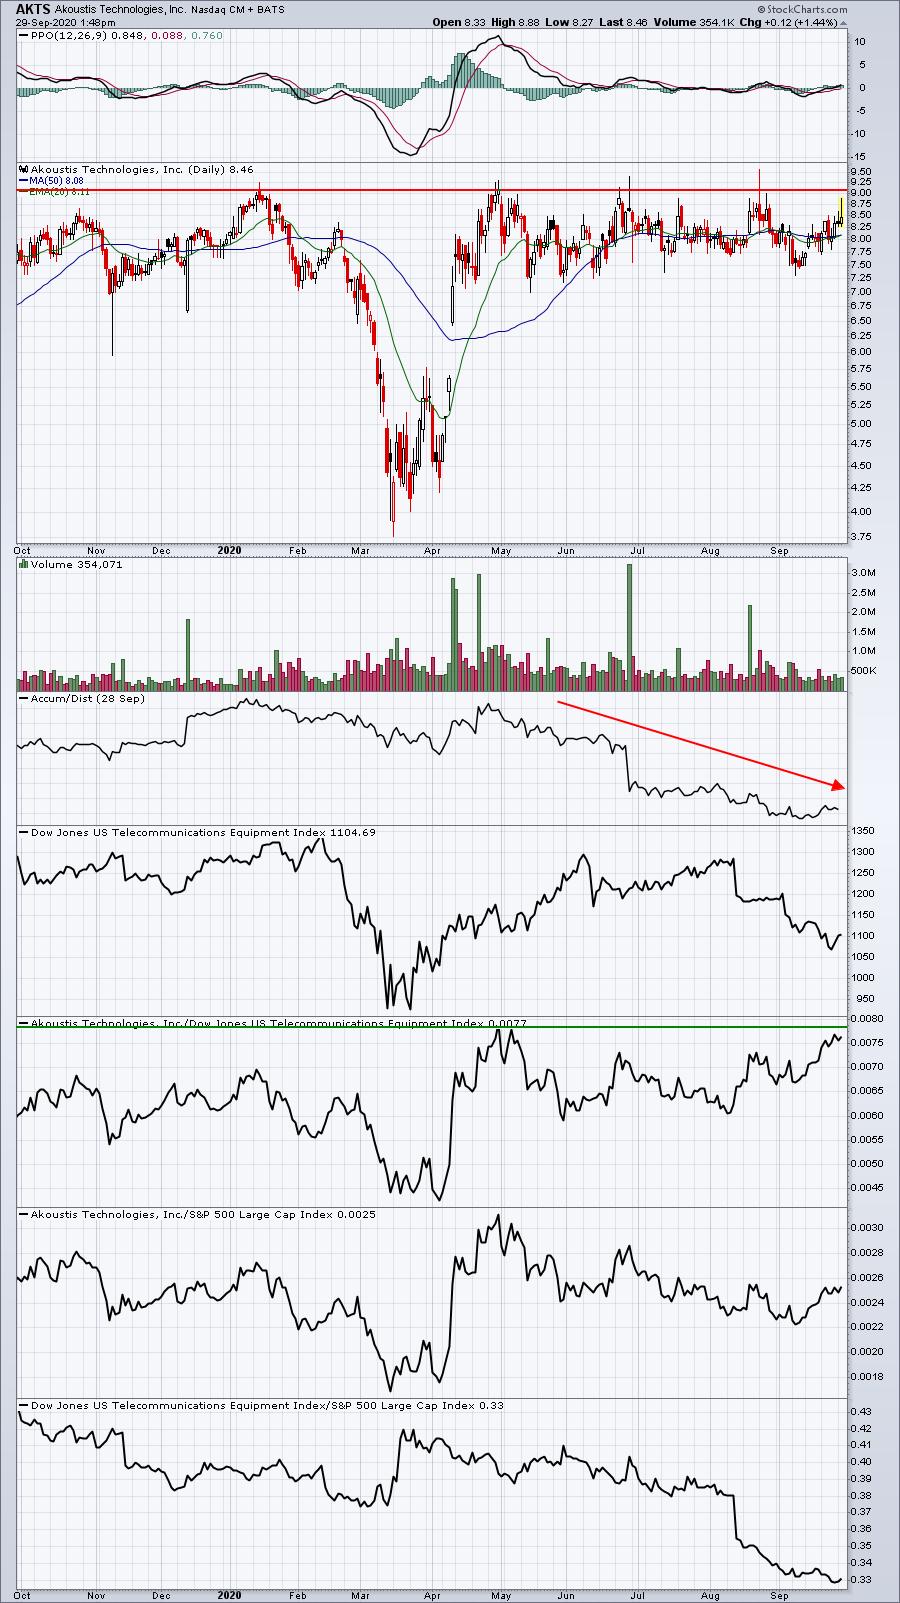
Personally, I wouldn't buy a stock like this, anticipating a breakout, because it may never happen. AKTS has strengthened on a relative basis, but hasn't broken out yet. Also, its AD line remains quite weak, so there are definitely signs to be cautious here. However, a close above 9.10-9.15 would likely begin to spook some bears on the stock as we've tested that level of resistance multiple times in the past year. Volume could soar on a breakout, forcing many shorts to cover their positions, sending the stock even higher.
Earnings Reports
Here are the key earnings reports for the next two days, featuring stocks with market caps of more than $10 billion. I also include a few select companies with market caps below $10 billion. Finally, any portfolio stocks that will be reporting results are highlighted in BOLD. If you decide to hold a stock into earnings, please understand the significant short-term risk that you are taking. Please be sure to check for earnings dates for any companies you own or are considering owning.
Tuesday, September 29:
MU, INFO, MKC, SNX, PRGS
Wednesday, September 30:
NG
Economic Reports
July Case-Shiller house price index: +0.6% (actual) vs. +0.2% (estimate)
September consumer confidence: 101.8 (actual) vs. 88.8 (estimate)
Happy trading!
Tom