
EB Daily Market Report - Friday, October 2, 2020
Saturday Event
I want to remind everyone that we have an open-to-the-public event tomorrow, "Creating a User-Defined Index". The webinar room should open at approximately 10:30am ET and you can access the room in the morning by clicking on this link:
https://us02web.zoom.us/j/83192450948
I hope to see you there! If you can't make it, no worries. We'll record the event and make sure it's available for you to view at your leisure.
Executive Market Summary
- Futures were down sharply overnight after the President and First Lady were reported to have contracted COVID-19
- September nonfarm payrolls came in below expectations, adding to the market's opening misery
- After the market opened, there was a clear shift in relative strength to the Dow Jones and S&P 500 vs. the NASDAQ
- Value stocks (IWD) also have performed much, much better today than growth stocks (IWF)
- 6 sectors have advanced 1% or more, lead by real estate (XLRE) and utilities (XLU), two defensive sectors
- The other 5 sectors are negative as technology (XLK, -2.25%) and communication services (XLC, -1.71%) are the primary laggards
- LyondellBassell (LYB, +6.81%), a materials stock, is printing a bullish engulfing candle and leads the S&P 500
Market Outlook
There's definitely a much different feel to today's market environment vs. earlier this week. One of our favorite ratios - growth stocks vs. value stocks (IWF:IWD) - is tumbling today after rallying all week long. I'm not reading too much into this as the market is in consolidation mode and literally just about anything goes from day-to-day. We're also seeing the NASDAQ significantly underperform as well. Here's today's DIA:QQQ chart showing the money rotate into the Dow Jones and away from the tech-laden NASDAQ:
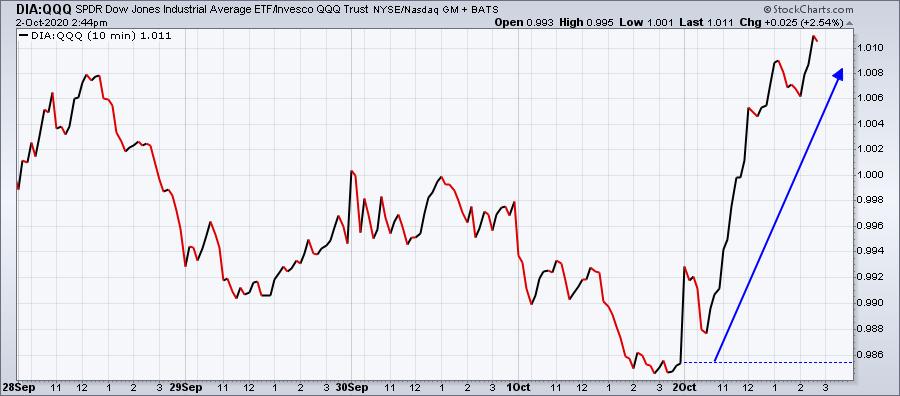
It's certainly been a big reversal from what we saw throughout the week, but if we look at the longer-term, I believe it's quite clear that the overall relative downtrend in the Dow Jones vs. the NASDAQ 100 remains in play:
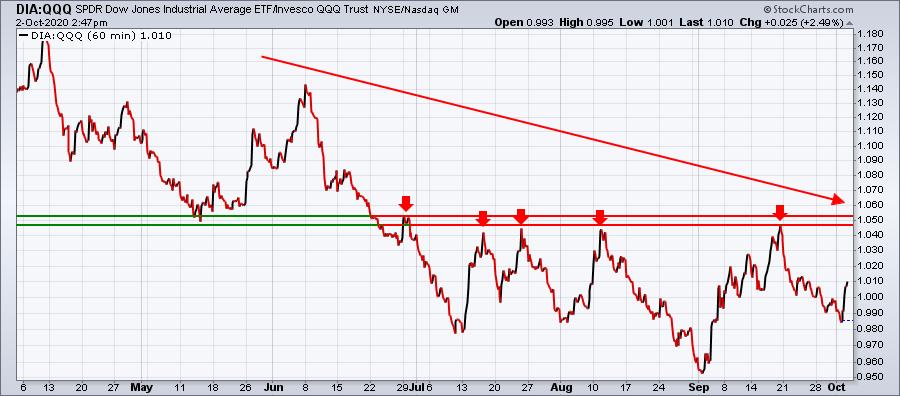
There seems to be quite a bit of relative resistance near that 1.05 level. I wouldn't read too much into the short-term back and forth relative action. If we clear 1.05, certainly 1.06, then we might need to re-evaluate as that could be sending us a signal that the next leg up in the rally could be led by the larger cap, non-technology companies.
Sector/Industry Focus
When I say the market environment has changed today, confirmation lies quite simply in the sector leaderboard as the strongest areas of the market are planted firmly at the bottom of the sector leaderboard:
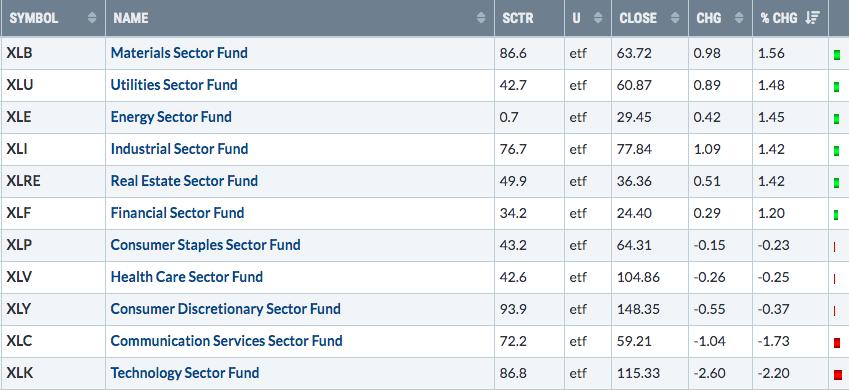
The good news is that despite the selling, 6 of our 11 sectors are actually higher - all of them by more than 1%.
ChartLists/Strategies
I ran a scan of 20 day EMA tests against our Strong Earnings ChartList. I used the same scan syntax as we show on our website, except that I changed the SCTR from 75 to 90. I wanted to see which strong relative performers were pulling back today given the market weakness (especially the NASDAQ). There were 6 stocks returned as follows:
CELH, VUZI, GNMK, PYPL, EYE, SPWH
When I looked at the charts, I really liked the bases being built in the two that are bold-highlighted. Check these out:
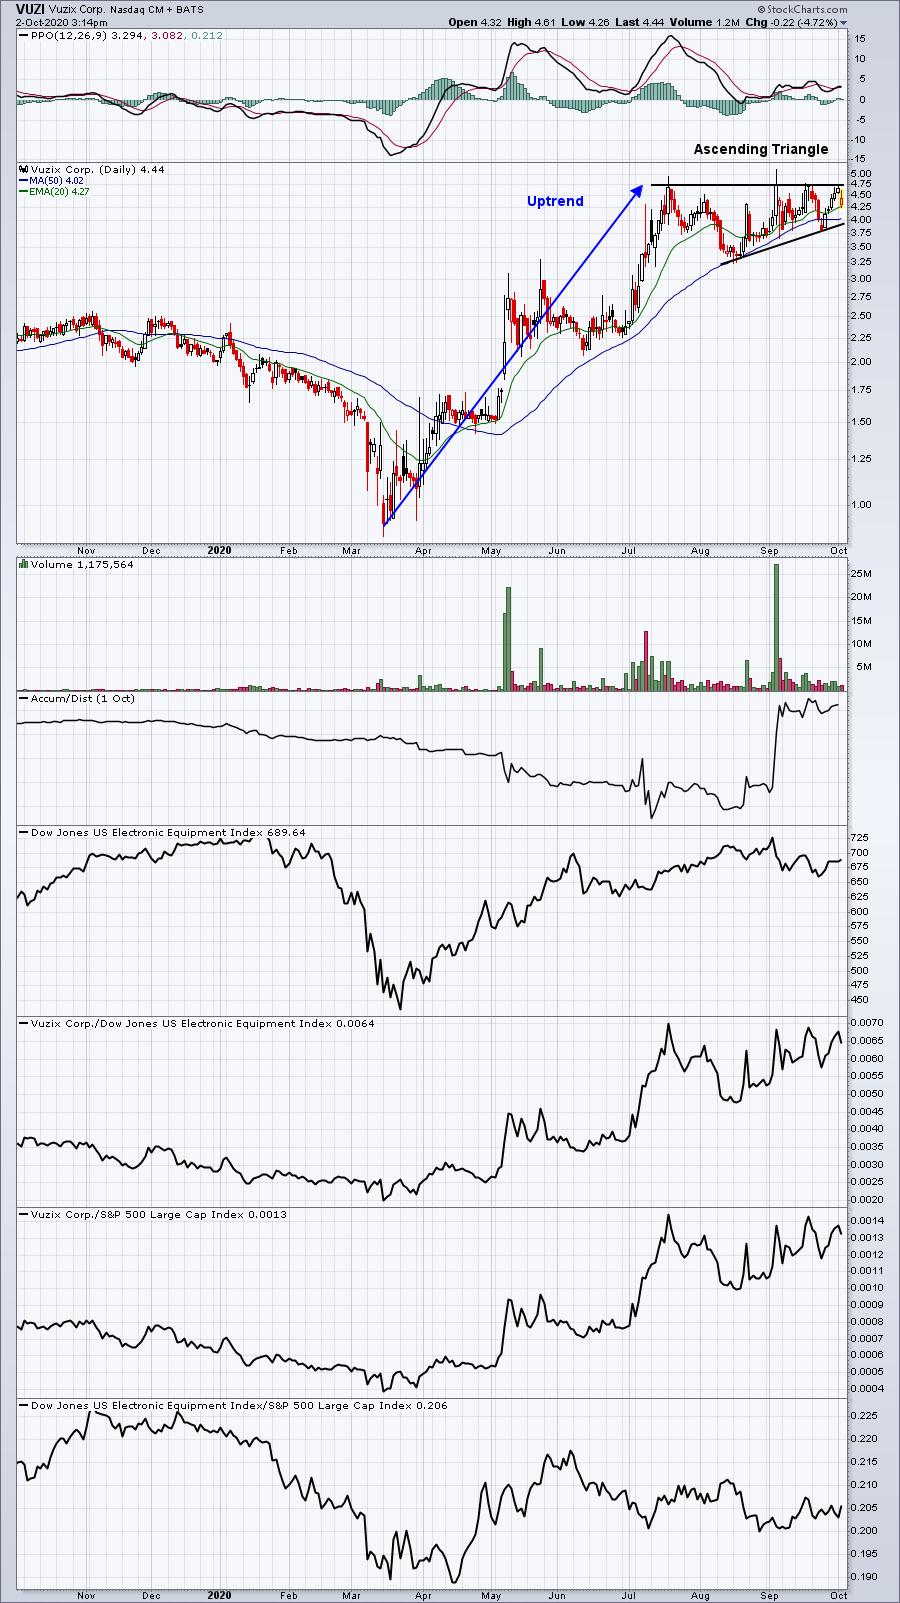
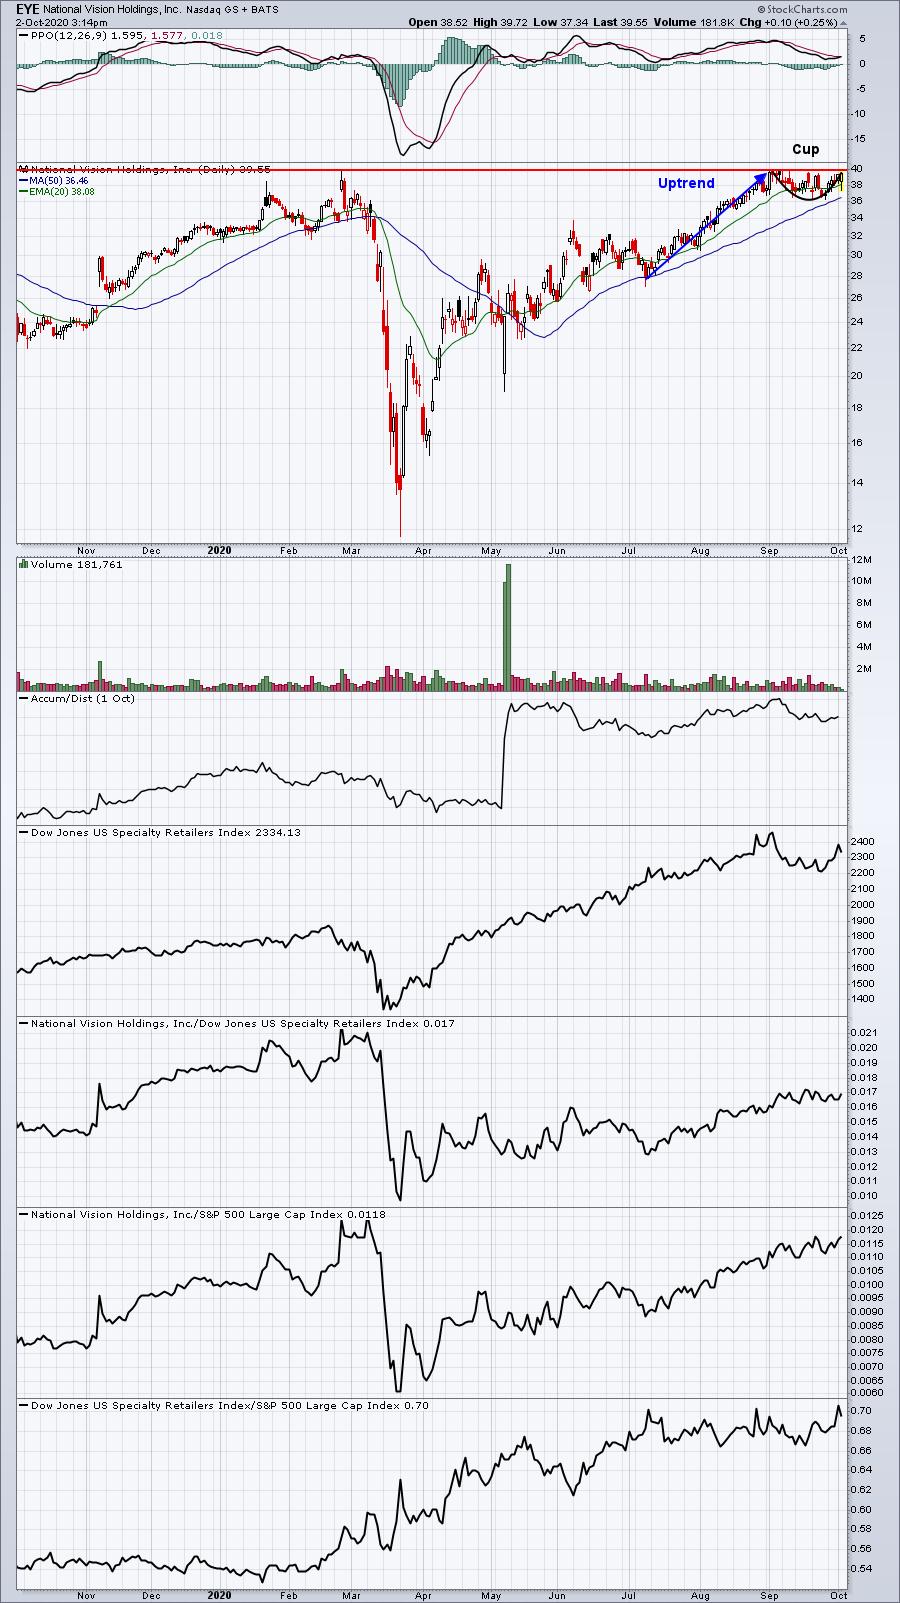
I always talk about stocks forming bullish continuation patterns after a lengthy uptrend and I think these two are perfect examples. These patterns don't confirm until we see a breakout, so buying now presents a bit more risk, but the odds are usually great that an uptrend followed by a continuation pattern typically resolves with another breakout. That base on VUZI is a thing of beauty.
Earnings Reports
Here are the key earnings reports for the next two days, featuring stocks with market caps of more than $10 billion. I also include a few select companies with market caps below $10 billion. Finally, any portfolio stocks that will be reporting results are highlighted in BOLD. If you decide to hold a stock into earnings, please understand the significant short-term risk that you are taking. Please be sure to check for earnings dates for any companies you own or are considering owning.
Friday, October 2:
None
Monday, October 5:
None
Economic Reports
September nonfarm payrolls: 661,000 (actual) vs. 894,000 (estimate)
September private payrolls: 877,000 (actual) vs. 900,000 (estimate)
September unemployment rate: 7.9% (actual) vs. 8.2% (estimate)
September average hourly earnings: +0.1% (actual) vs. +0.2% (estimate)
September consumer sentiment: 80.4 (actual) vs. 79.0 (estimate)
August factory orders: +0.7% (actual) vs. +1.0% (estimate)
Happy trading!
Tom