
EB Daily Market Report - Wednesday, October 7, 2020
Upcoming Events
Make sure you check out our "Event Calendar" in the "Our Service" area on our website. We've recently made some additions and changes, so if you haven't checked it out lately, you should do so. We have an EXCELLENT event this Saturday, "The Power of StockCharts Tools with EarningsBeats Research Engine." Grayson Roze, VP of Operations at StockCharts will be joining me and he'll update everyone regarding StockChart's ACP (Advanced Charting Platform). But we have much more planned, so be sure to check it out, along with all of the other events that we've scheduled.
Executive Market Summary
- Futures were a bit skittish after the selloff yesterday afternoon
- Our major indices opened higher, though, led by small caps ($SML) and mid caps ($MID) again
- There's been a subtle shift back to NASDAQ shares during the session today as the IWF:IWD (growth vs. value) ratio attempts to reverse its recent relative downtrend
- The 10 year treasury yield ($TNX) has risen to 0.76%, but is off its earlier 0.79% high
- Crude oil ($WTIC), gold ($GOLD), and silver ($SILVER) are all lower; however, materials (XLB, +2.04%) is today's leading sector
- All 11 sectors are higher, with consumer discretionary (XLY, +1.91%) having another excellent session - 15 out of 20 of its industry groups have gained at least 1%
- Renewable energy ($DWCREE, +10.51%) is literally melting up, leading all industry groups for a 3rd consecutive day
- FSLY (+15.28%) and QDEL (+11.52%) are our top two portfolio stocks, carrying their respective portfolios
- FOMC minutes are due out at 2:00pm ET this afternoon
Market Outlook
I've been asked before to discuss when relative strength in defensive sectors becomes problematic. Let me start by saying that strength in defensive areas of the market is normal during downtrends and periods of consolidation. In fact, I generally expect that. But when you see a bull market break to new highs and the leadership involves real estate (XLRE), utilities (XLU), or consumer staples (XLP), that's when you have a red warning flag. So let's take a look at these 3 areas:
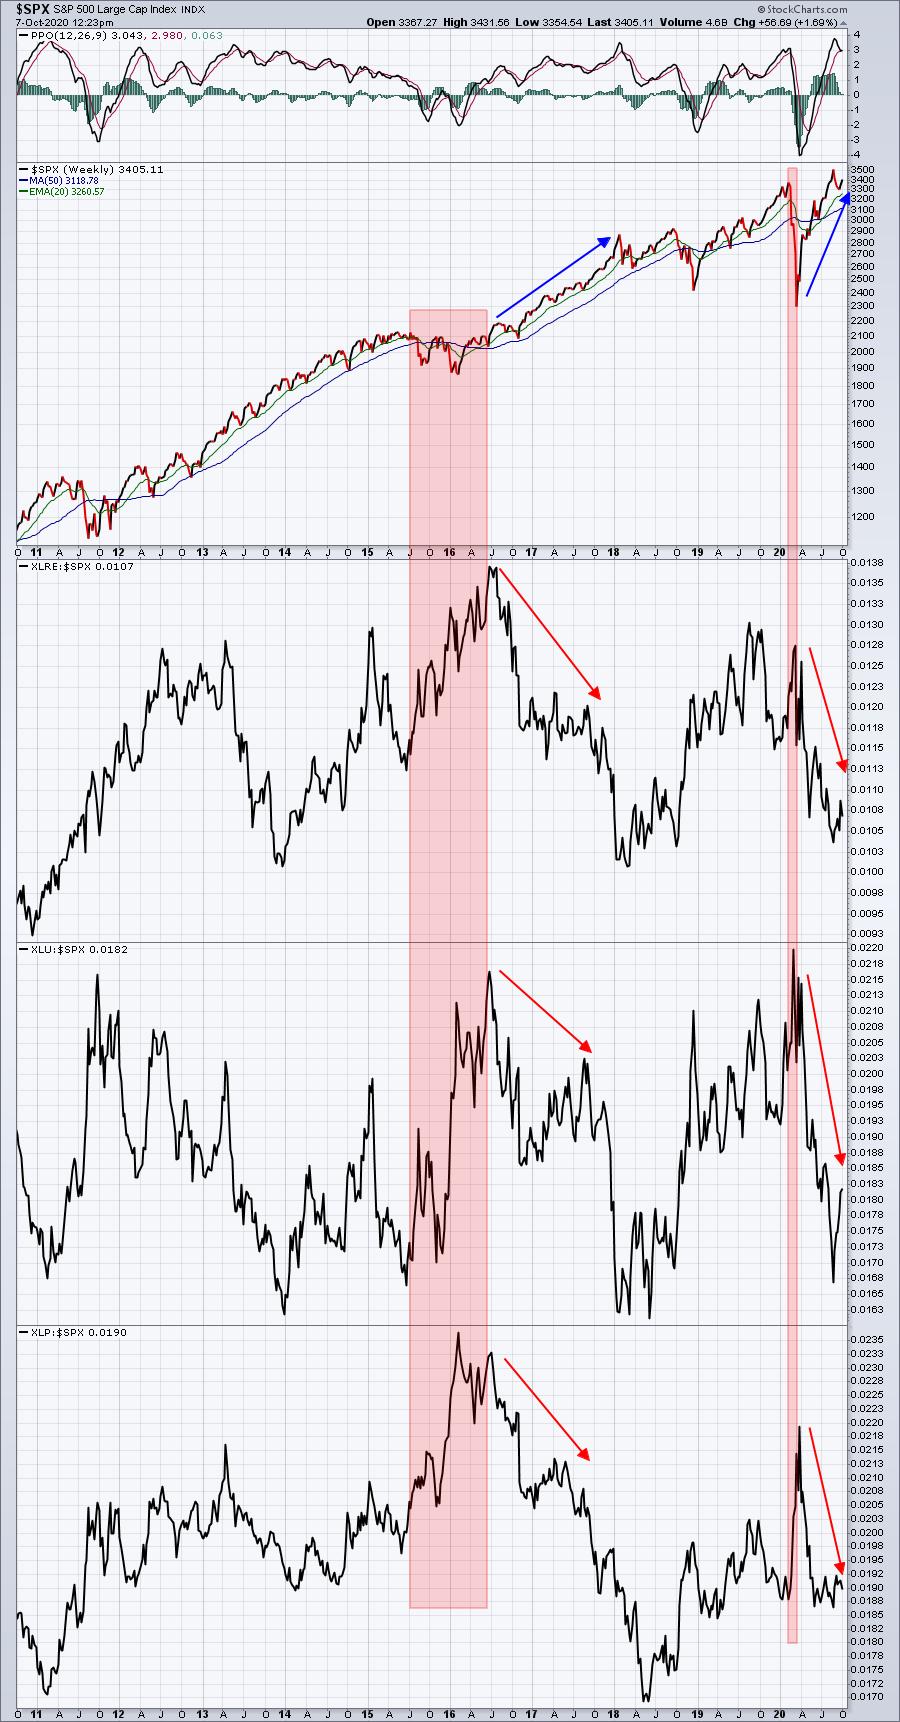
The red-shaded areas show how these groups tend to perform best during periods of market turbulence, which makes good common sense as traders grow more defensive during such periods. But when we've seen big secular bull market advances, defensive groups should lag on a relative basis. They're likely to still go higher on an absolute basis, but they shouldn't be market leaders.
Sector/Industry Focus
My good friend and fellow StockCharts.com contributor Julius de Kempenaer is the creator of RRG charts, which provide a visualization of rotation around whatever benchmark you choose. As you know, I tend to view rotation on price relative charts, but RRG can be much more visual for some. For instance, let me show you how consumer discretionary (XLY) looks vs. the S&P 500 on a price relative chart first. I'll use a weekly time frame and go back 3 years:
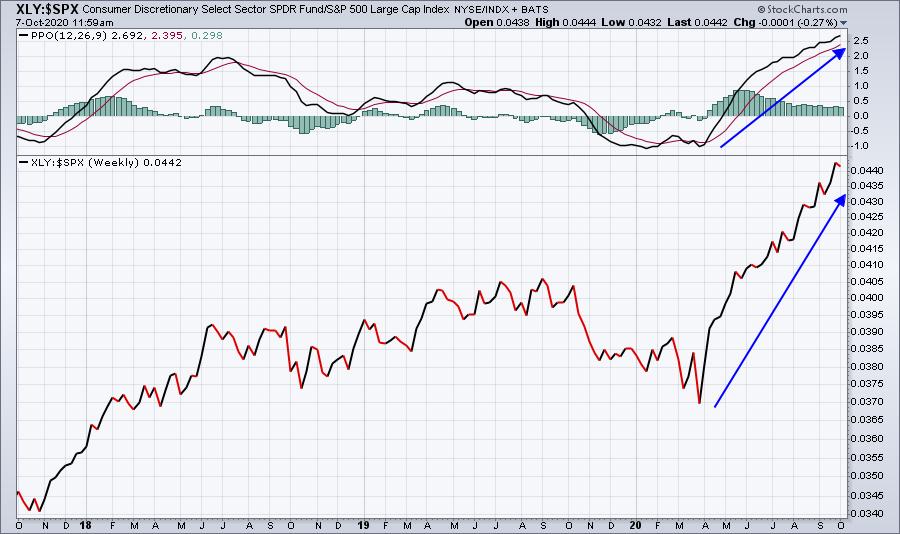
This provides us excellent information as the XLY is solidly outperforming the S&P 500. So if our goal is to beat the S&P 500, then riding this relative strength makes perfect sense. But there are limitations to the above chart. The biggest one is that it doesn't show how it's doing vs. the other sectors. Is it the strongest? What other sectors are equally as strong.
Well, enter the RRG charts where we can plot all the sectors against the S&P 500 on one chart:
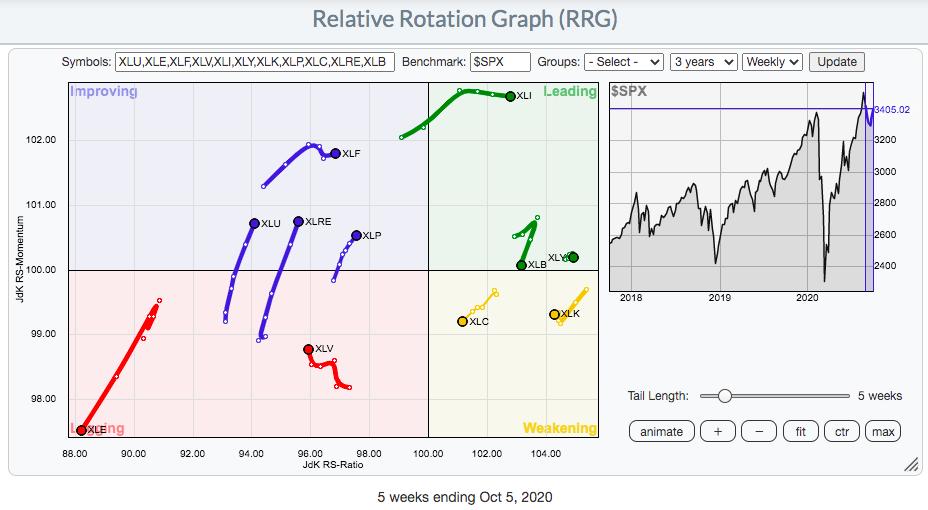
For relative strength purposes, the ETFs that are the furthest to the right are the strongest. In other words, concentrate on the horizontal axis and those to the right of center are your relative strength winners. The vertical axis highlights momentum. While defensive groups have recently shown improving momentum, they are still left of the center vertical line. That tells us that they are not showing consistent relative strength.
ChartLists/Strategies
I've always felt that our true flagship product is our Strong Earnings ChartList, where we combine technicals and fundamentals. It's also the basis for our portfolios, which have literally posted numbers off the charts. But from a trading perspective, the Short Squeeze ChartList might rank a close second. I've received numerous emails from members, indicating that their membership has been paid for many years based on Short Squeeze trades. Those trading these candidates should really have the psyche of a gambler. These are very risky trades, but they can be tremendously profitable. When I mention them in the same breath as gambling, it's because of their volatility. One day you can be humming along and the next is sheer pain.....followed by another surge. These stocks get your blood pumping without a doubt.
For those unfamiliar with our Short Squeeze ChartList, it's an organized ChartList that highlights the most heavily shorted stocks in the market. A stock that is shorted means that a trader has borrowed shares from his/her broker and sold it. But they must buy it back at a later date and return the borrowed shares to the broker. In essence, you have guaranteed future buyers of a stock. When a stock has a HUGE level of short interest (for our purposes, we rank our Short Squeeze ChartList stocks based on their short % of float - float represents the number of available shares to be traded), a breakout can trigger a "short squeeze", where those shorting begin to lose money rapidly. As the stock runs higher, those on the short side are forced to buy, sending shares even higher. It can result in MASSIVE short-term gains. Check out Jinko Solar's (JKS) chart:
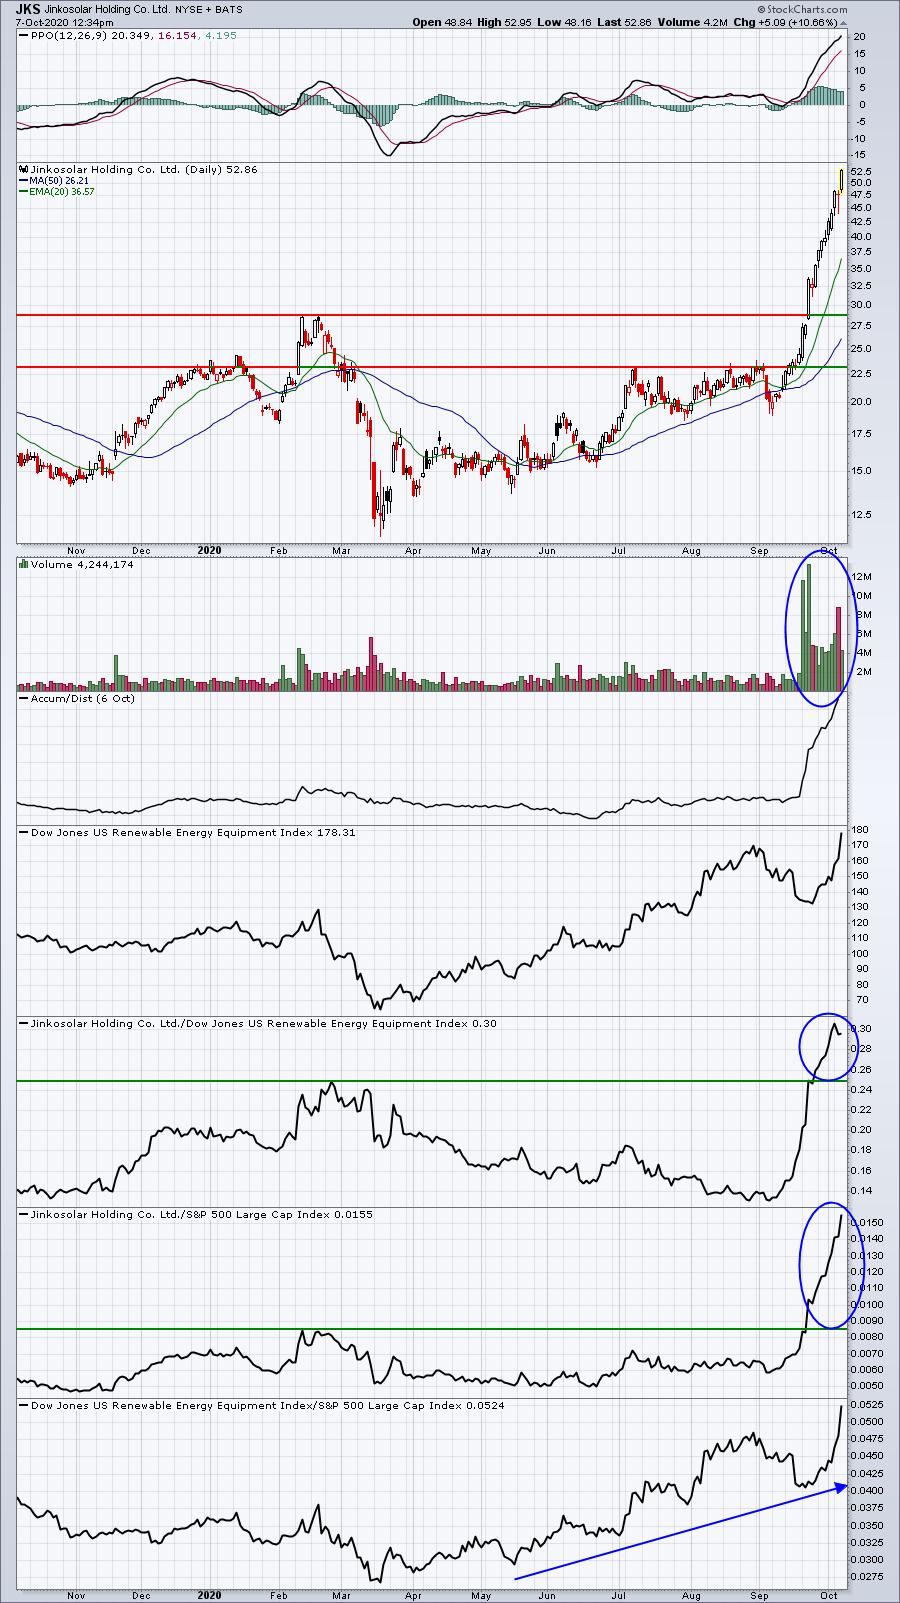
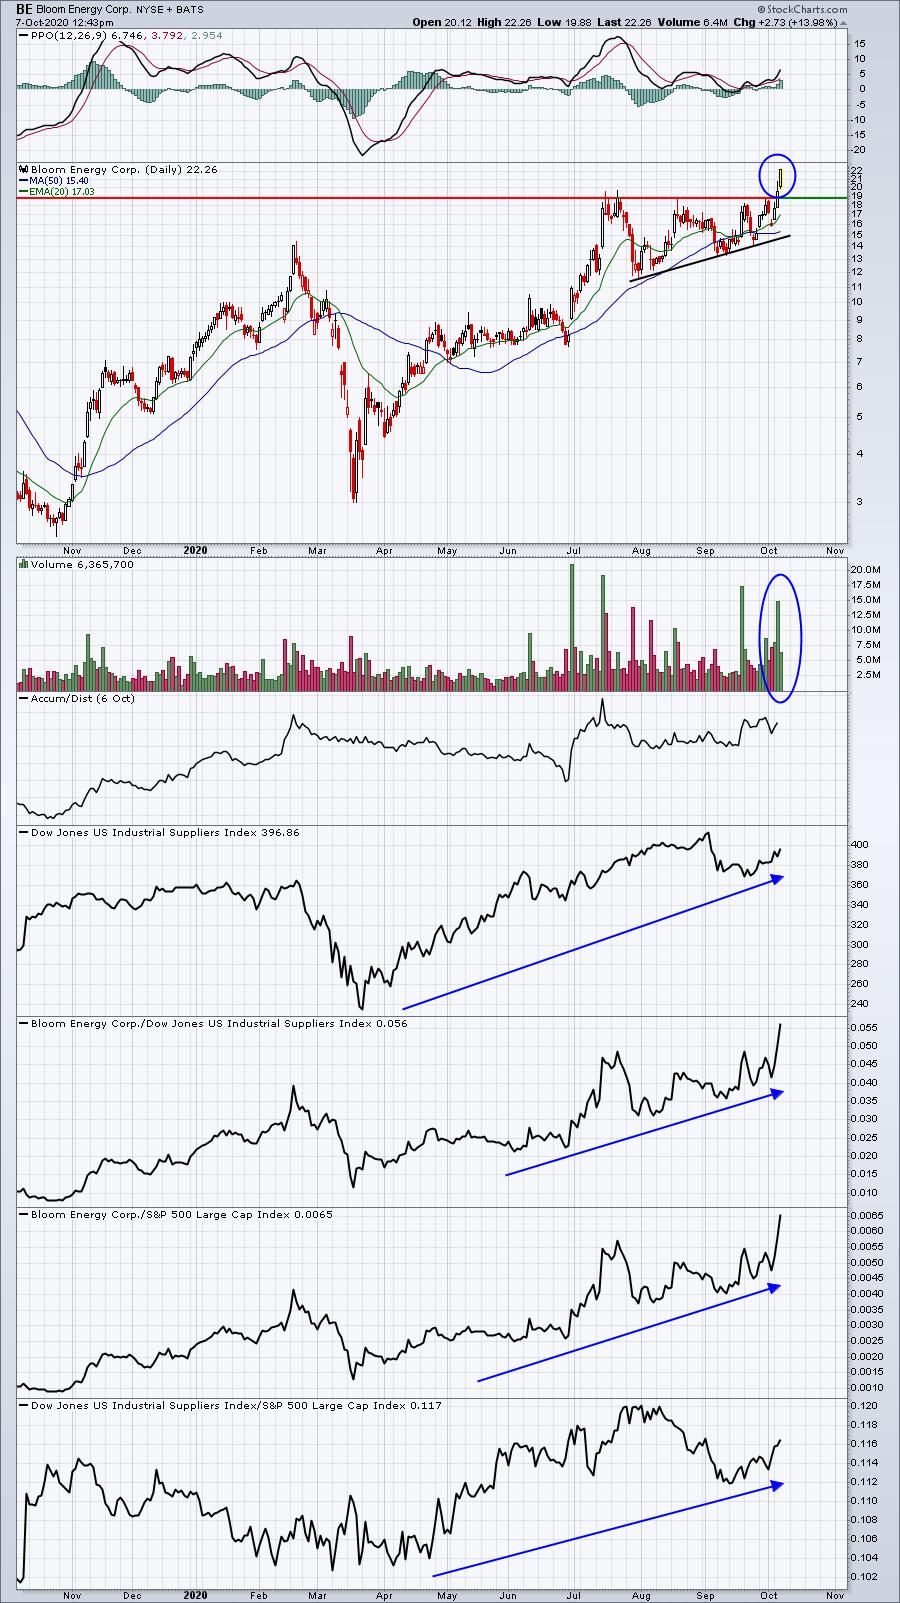
I've been focusing a lot on this Short Squeeze ChartList lately, because it's been producing excellent trading candidates. Recently, I discussed both BE and SDC, two stocks I've been awaiting breakout on. Check out these two charts:
BE:
SDC:
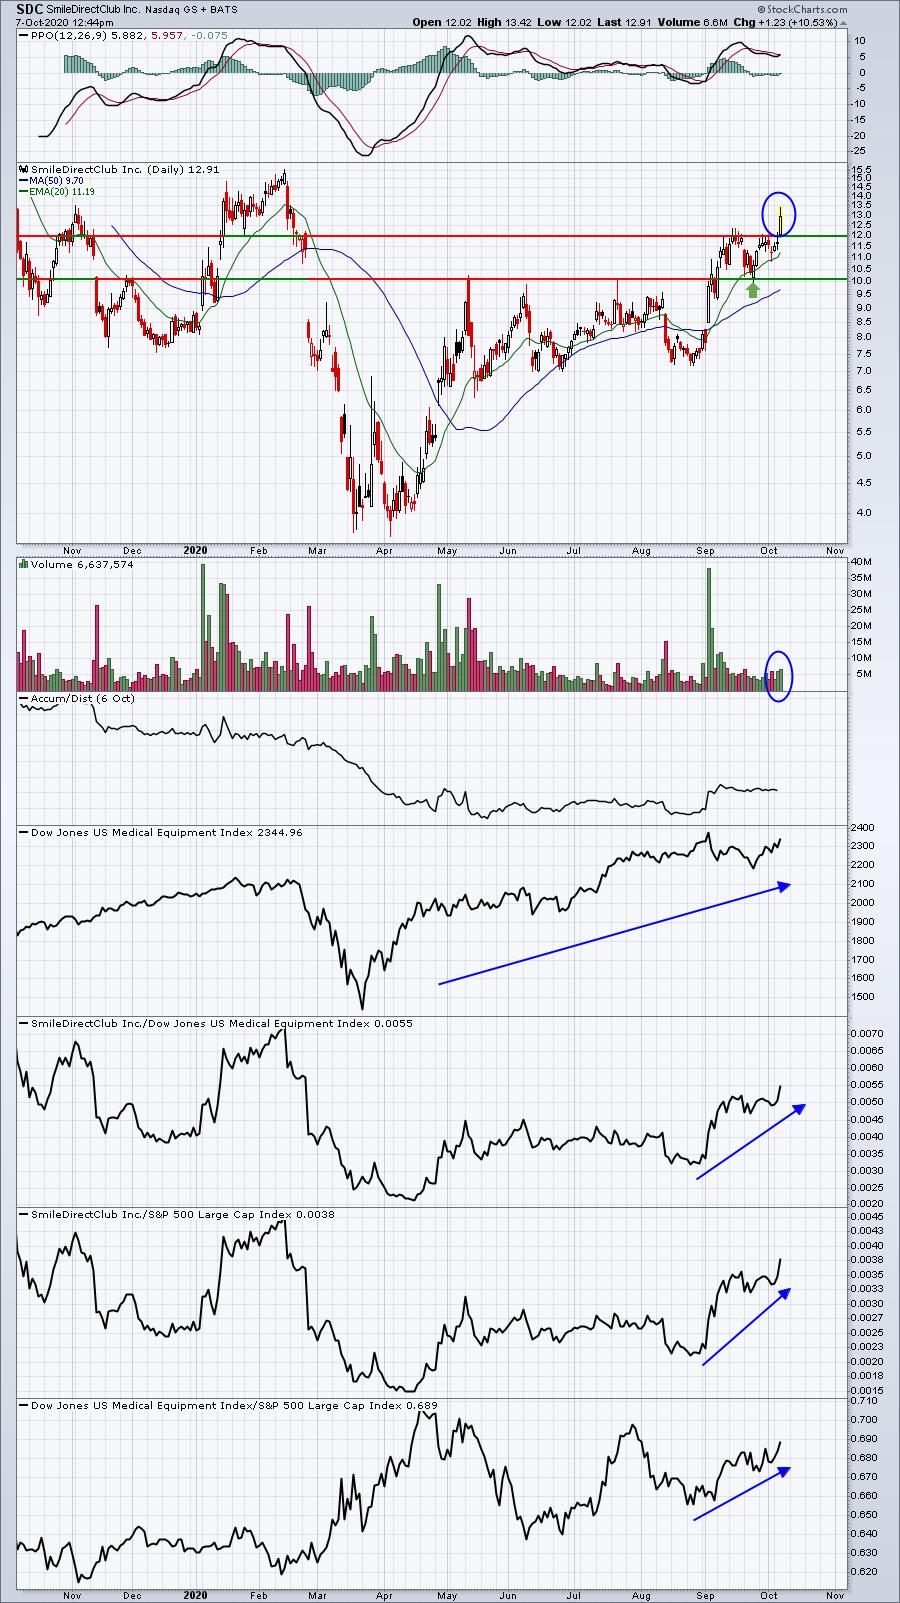
Both of these charts feature companies that are strengthening. Their relative strength has been improving, as have volume trends. Jumping on short squeeze candidates too early, before the true momentum begins, can be problematic. But once a stock has been trading higher for a bit and consolidating, the next breakout can be powerful because most, if not all, short sellers are underwater at that point. That means they're losing money and as the stock rises, so too do their losses. That triggers panicked buying. BE and SDC may not turn out to be as strong as JKS, but both are promising short squeeze candidates at this point.
Earnings Reports
Here are the key earnings reports for the next two days, featuring stocks with market caps of more than $10 billion. I also include a few select companies with market caps below $10 billion. Finally, any portfolio stocks that will be reporting results are highlighted in BOLD. If you decide to hold a stock into earnings, please understand the significant short-term risk that you are taking. Please be sure to check for earnings dates for any companies you own or are considering owning.
Wednesday, October 7:
RPM, LW
Thursday, October 8:
DPZ, HELE, AYI
Economic Reports
FOMC minutes will be released at 2:00pm ET
Happy trading!
Tom