
EB Daily Market Report - Tuesday, October 13, 2020
Announcements
First, the Strong Earnings ChartList (SECL) was updated yesterday and is now available for your review/download on our website. The Strong Future Earnings ChartList (SFECL) has not yet been updated, but will hopefully be updated over the next day or two.
Second, we have our monthly October Max Pain webinar at 4:30pm ET today. You can access this event by using the room link below. The room should open at approximately 4:00pm ET:
https://us02web.zoom.us/j/88059541294
Finally, I want to make sure everyone is aware that through this Friday, October 16th, anyone who extends their membership for 13 months (one month bonus) for $697 will automatically receive our new ETF service at no additional cost until their next renewal date. Let me give you an example. Let's say you're a current annual member and your membership expires at the end of February 2021. You will receive everything we offer, including our ETF service, through that date and at no additional charge. If you decide to pay us $697 to extend your annual membership another year, you'll receive 13 months (one bonus month) so that you'll then be paid up through the end of March 2022. You will receive everything we offer, including our new ETF service, through that extended date with no additional charge for the ETF service. It will be covered. This $697 annual special represents a HUGE savings as our current expectation is to charge $497 for our ETF service annually, in addition to our $697 regular service, beginning January 1, 2021.
If you have any questions or if you'd like to extend using this special, please contact us at [email protected]. It's our way of saying thank you for your support and commitment!
Executive Market Summary
- Futures were mixed this morning as the NASDAQ got off to a good start, but not the Dow Jones and S&P
- Currently, the NASDAQ is flat, while the other major indices are all in the red; small caps ($SML) and the S&P 500 ($SPX) are down 1.30% and 0.65%, respectively
- Earnings season has begun; EPS came in ahead of expectations for most companies, though Delta (DAL) was an exception
- Despite better-than-expected earnings and early morning strength, JNJ, JPM, and C are all lower today, with the latter stumbling more than 4%
- BLK, which showed significant relative strength heading into earnings, easily exceeded earnings expectations and is higher by nearly 5%
- Financials (XLF, -1.86%) are struggling after seeing earnings reports from JPM and C
- Banks ($DJUSBK, -2.75%) are particularly weak, beaten down by both earnings reports and a falling 10-year treasury yield ($TNX), which is down 5 basis points to 0.72%
- Consumer stocks and aggressive sectors are outperforming today; growth is also trouncing value as the IWF:IWD ratio approaches its recent high
Market Outlook
The S&P 500 has been underperforming the NASDAQ, but it continues to trade in bullish fashion on its 60 minute chart:
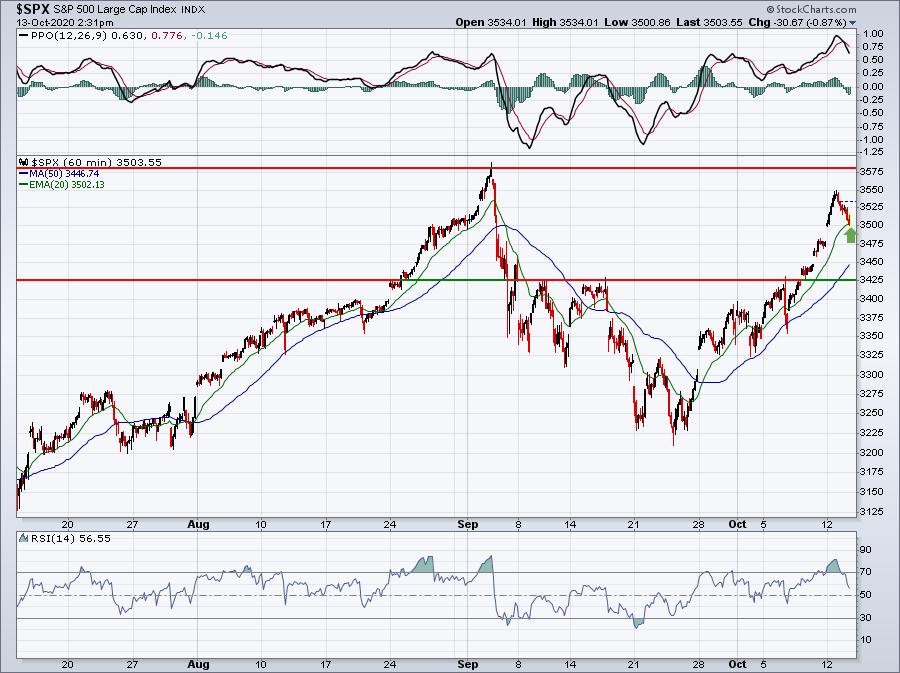
I see a current trading range from 3425 to 3580. In addition to price support at 3425, there's also the rising 20 day EMA (not pictured above) that is currently at 3405. I'd be very surprised to see the S&P 500 fall back and close beneath 3400 as a result.
Sector/Industry Focus
There's one industry group within the consumer discretionary space that is trying to negotiate a triple top. It's the business training & employment agencies group ($DJUSBE):
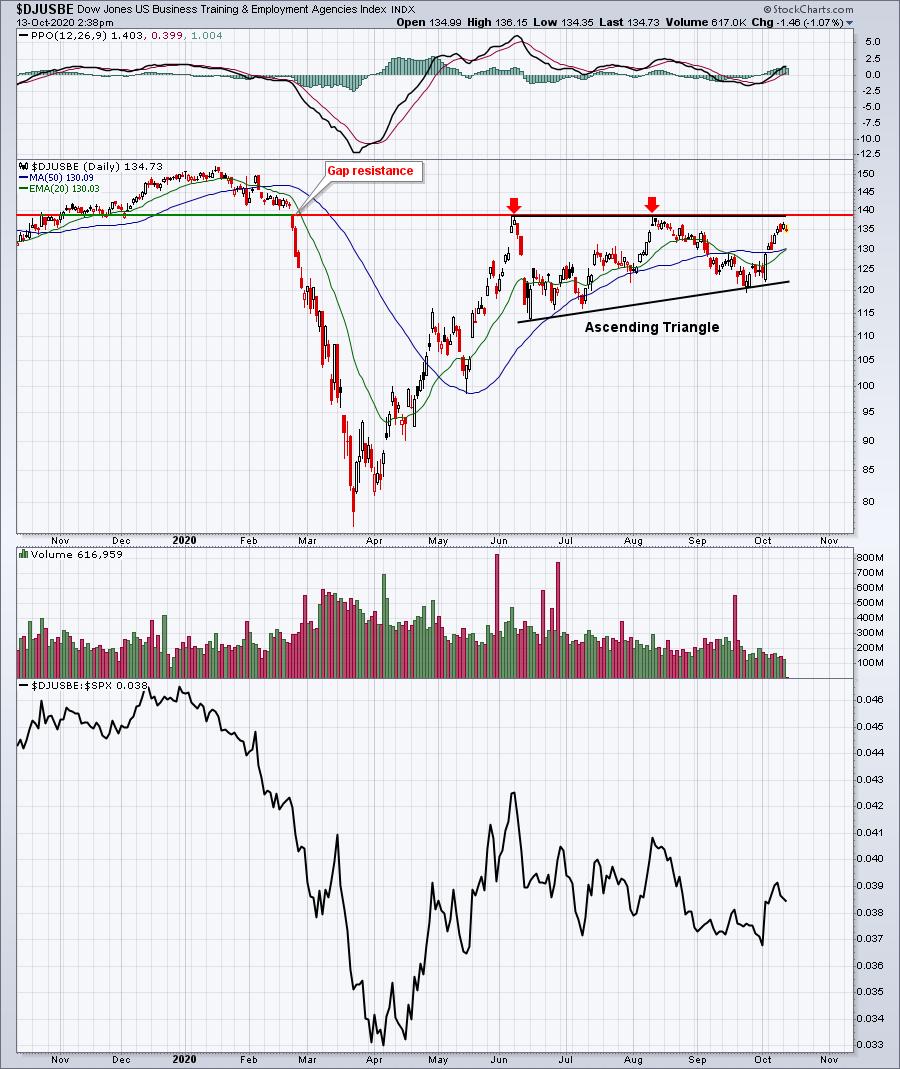
While the absolute price chart shows a bullish ascending triangle, the DJUSBE is not showing any relative strength. In fact, while this bullish continuation pattern has been forming, the S&P 500 has been rising. The DJUSBE actually shows relative weakness.
ChartLists/Strategies
I ran our Downtrend Reversal scan against our four fundamentally- and technically-sound ChartLists - the Strong Earnings ChartList (SECL), Strong Future Earnings ChartList (SFECL), Raised Guidance ChartList (RGCL), and Strong AD ChartList (SADCL). Only one stock was returned:
OTRK:
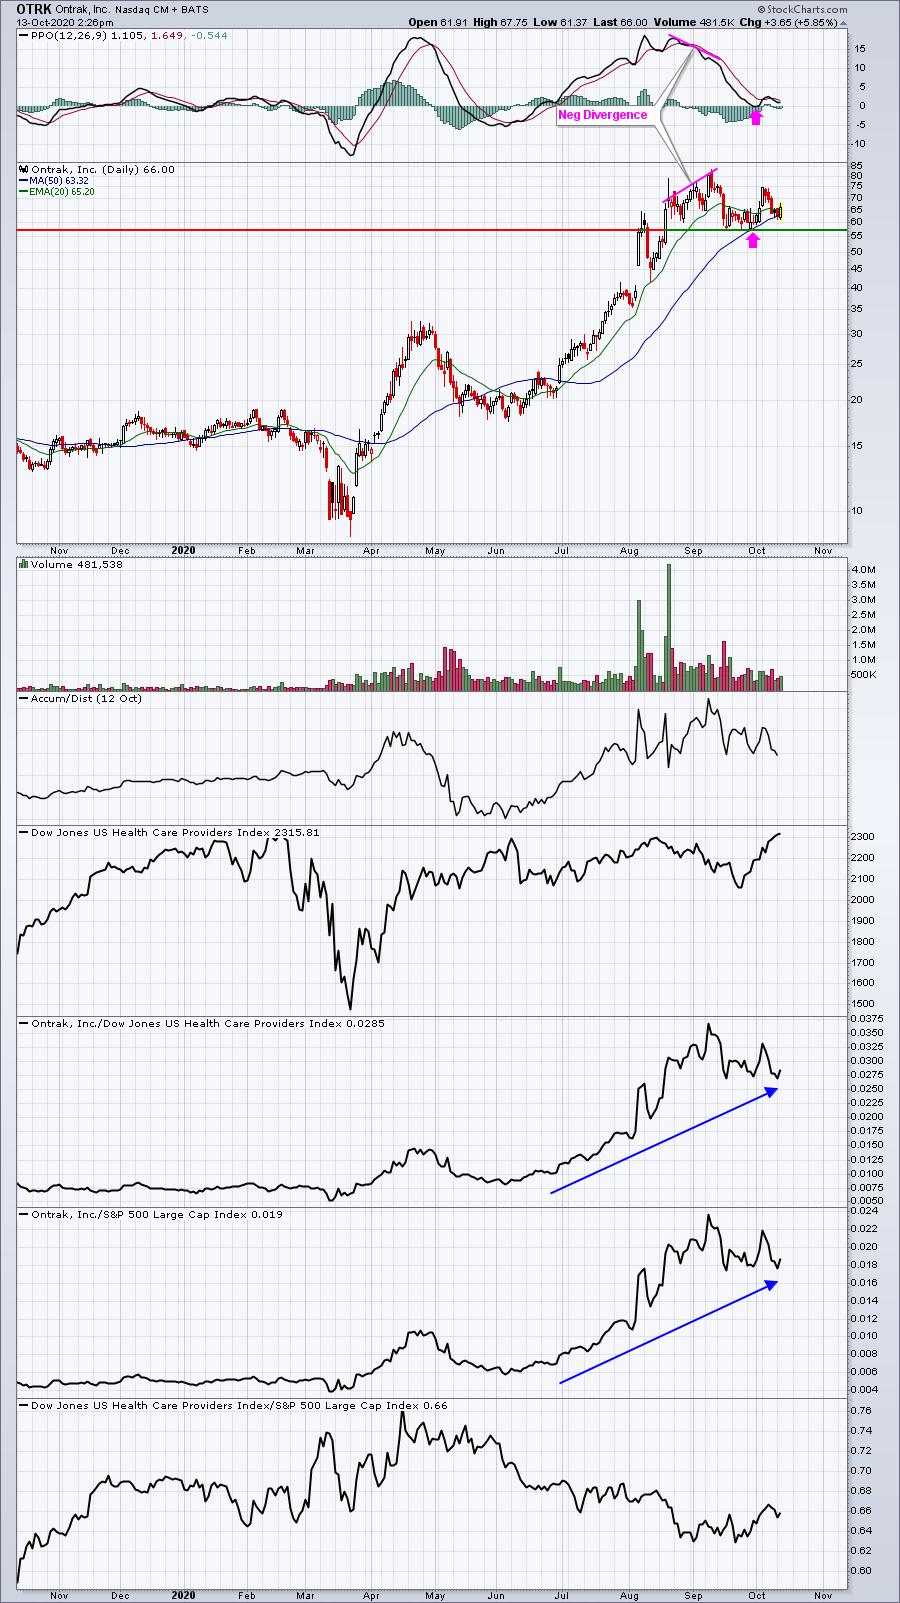
Recent weakness can be attributed to the negative divergence that printed on the early-September high. When I see negative divergences, I immediately begin to think 50 day test and/or PPO centerline test. The pink arrows highlight that OTRK saw both to close out September. More recent weakness appears to be reversing off another 50 day test. I would be careful if OTRK closes beneath 57. Otherwise, I look for higher prices here.
Earnings Reports
Here are the key earnings reports for the next two days, featuring stocks with market caps of more than $10 billion. I also include a few select companies with market caps below $10 billion. Finally, any portfolio stocks that will be reporting results are highlighted in BOLD. If you decide to hold a stock into earnings, please understand the significant short-term risk that you are taking. Please be sure to check for earnings dates for any companies you own or are considering owning.
Tuesday, October 13:
JNJ, JPM, C, BLK, FAST, FRC, DAL
Wednesday, October 14:
UNH, BAC, WFC, GS, INFY, USB, PGR, PNC, UAL, AA, SNBR
Economic Reports
September CPI: +0.2% (actual) vs. +0.2% (estimate)
September Core CPI: +0.2% (actual) vs. +0.2% (estimate)
Happy trading!
Tom