
EB Daily Market Report - Thursday, October 15, 2020
Annual Membership Special
Our best annual membership special EVER ends tomorrow. I'm sorry to keep repeating this, but I really want to make sure all of our members have the opportunity to extend their membership with a great deal. Everyone that has an annual membership will continue to receive our new ETF service until their next renewal date. So if your membership expires in April 2021, you'll pay nothing additional for the ETF service until then. If you use this $697 annual special to extend your membership, you'll be paid through May 2022 (we're offering a one month bonus, so 13 months for the price of 12) and will continue to receive everything we offer, including the new ETF service, at no additional cost through that May 2022 date. That will represent a HUGE savings.
Our plan is to begin charging separately for our ETF service on January 1, 2021. Therefore, anyone who is a member through year end will be able to "test drive" this service to see if it adds value to your membership.
Also, those of you that are monthly or currently enjoying our 30-day trial, may extend using the annual deal above. You will not lose any of your current time. In the case of the 30-day trial, your 13 months would begin AFTER your trial expires. You don't lose any part of your trial. Just wanted to be clear about that.
If you have any questions or if you'd like to extend using this special, please contact us at [email protected]. It's our way of saying thank you for your support and commitment!
Executive Market Summary
- Futures pointed to a very weak open and that's exactly what we saw
- The 10-year treasury yield ($TNX) is down 1 basis point, but was down 3 basis points earlier
- Initial jobless claims were reported at their highest level in a couple months and well above forecasts
- Nearly all companies reporting earnings this morning beat consensus estimates, but reactions were mixed
- Taiwan Semiconductor (TSM, -0.03%) missed its EPS estimate, but is flat for the session, perhaps an indication that semiconductor stocks will be given royal treatment this quarter
- Real estate (XLRE, +0.39%) is the only sector in positive territory
- Technology (XLK, -1.70%) and communication services (XLC, -1.37%) are the two hardest hit sectors; Fastly (FSLY, -24.22%) lowered its Q3 revenue guidance
- Vertex Pharmaceuticals (VRTX, -19.49%) is slumping after they reported last night that a drug trial was ended
Market Outlook
The S&P 500 has fallen beneath the key short-term gap support level I discussed yesterday, but it is sitting almost squarely on that lower uptrend line within its channel. A reversal from here would be bullish for the S&P 500. Meanwhile, the NASDAQ is nearing its own channel and gap support:
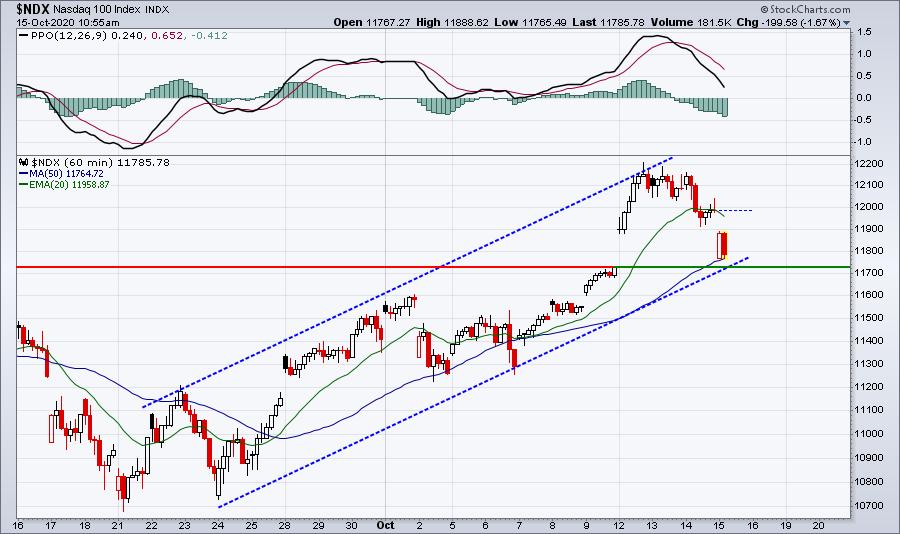
A definitive break on the S&P 500 and NASDAQ below 3440 and 11700, respectively, would likely increase selling pressure in the near-term. We certainly cannot forget our max pain session from Tuesday night, which suggested the increased likelihood of short-term weakness ahead given the net in-the-money call premium that was on the table for market makers.
Sector/Industry Focus
Twice this week, we've seen big names in the investment services space ($DJUSSB) deliver EPS well ahead of Wall Street estimates. Goldman Sachs (GS) posted EPS of 9.68 vs. 5.58 on Wednesday morning and the stock is trading lower right now than it was before the earnings report was released. This morning, Morgan Stanley (MS) posted a blowout report as well, with EPS easily outpacing estimates, 1.59 vs. 1.26. Yet, the DJUSSB remains a major relative laggard with an ability thus far to negotiate overhead price resistance:
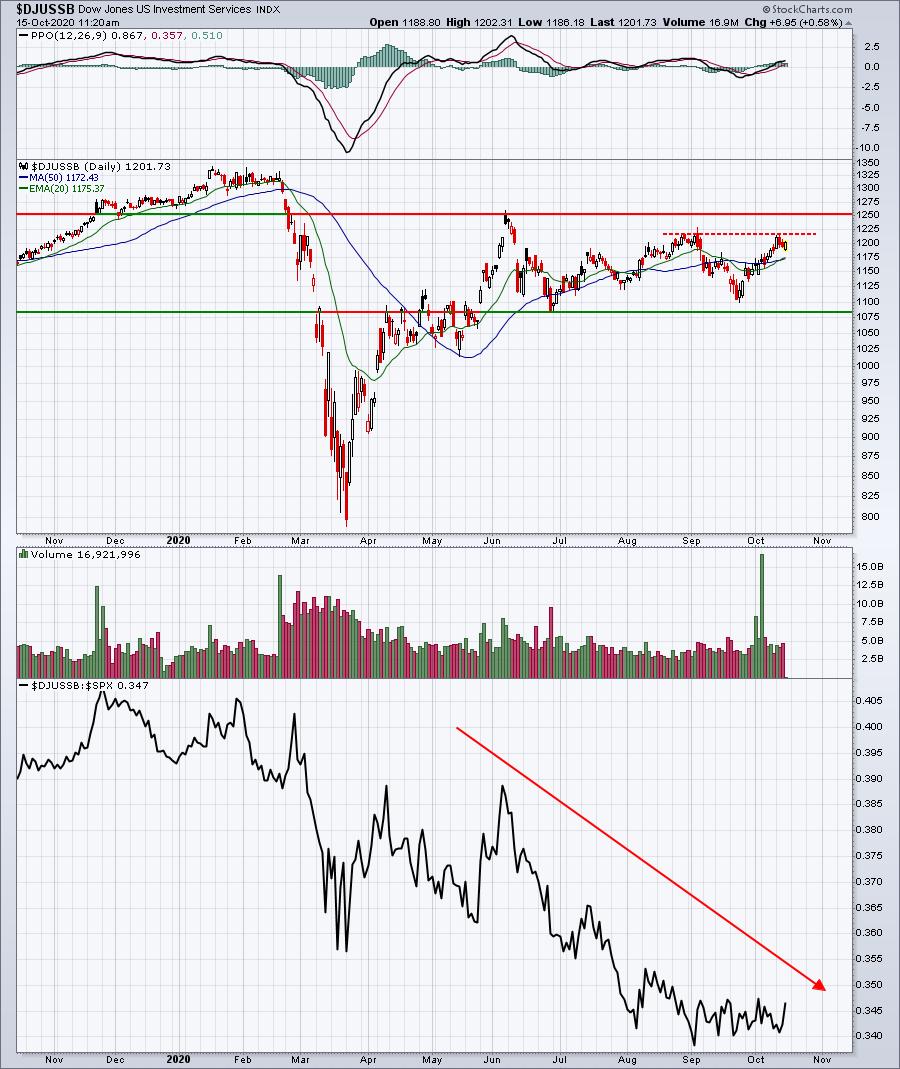
The point that I'm making here is that it's not about the earnings being reported. It's about relative strength. If a group is in favor and we see blowout earnings, we tend to see big moves higher. When a group is not favored by Wall Street, however, it doesn't seem to matter what happens with earnings.
It's the primary reason why we want to invest in strength.
ChartLists/Strategies
I ran a scan of our Strong Earnings ChartList (SECL) and our Short Squeeze ChartList (SSCL) to review any stocks that were trading more than 60% of their average daily volume by 11:30am ET, or just two hours into the trading day. Here's what was returned:
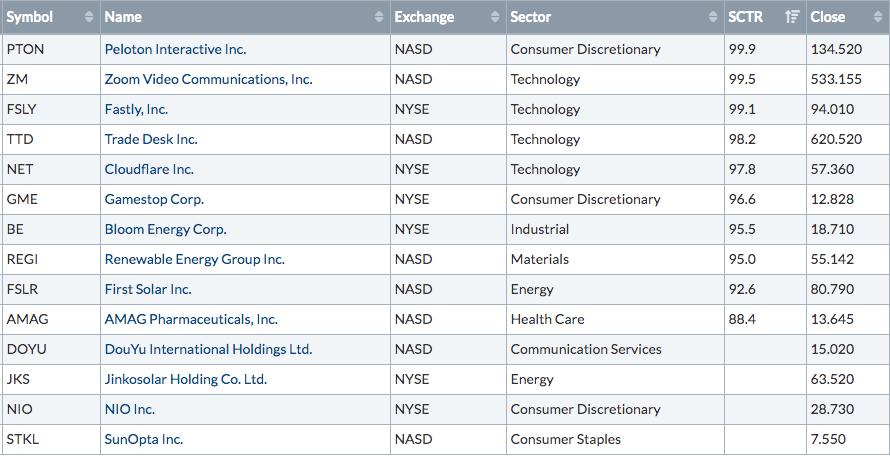
ZM is breaking out today in bullish fashion, with solid volume accompanying the breakout. A big reversing candlestick would be noteworthy, however, because of the negative divergence in play. The two charts worth looking at are GME, BE, and REGI. BE and REGI have both pulled back to test their 20 day EMAs, while GME remains quite volatile, but in the midst of a major short squeeze:
GME:
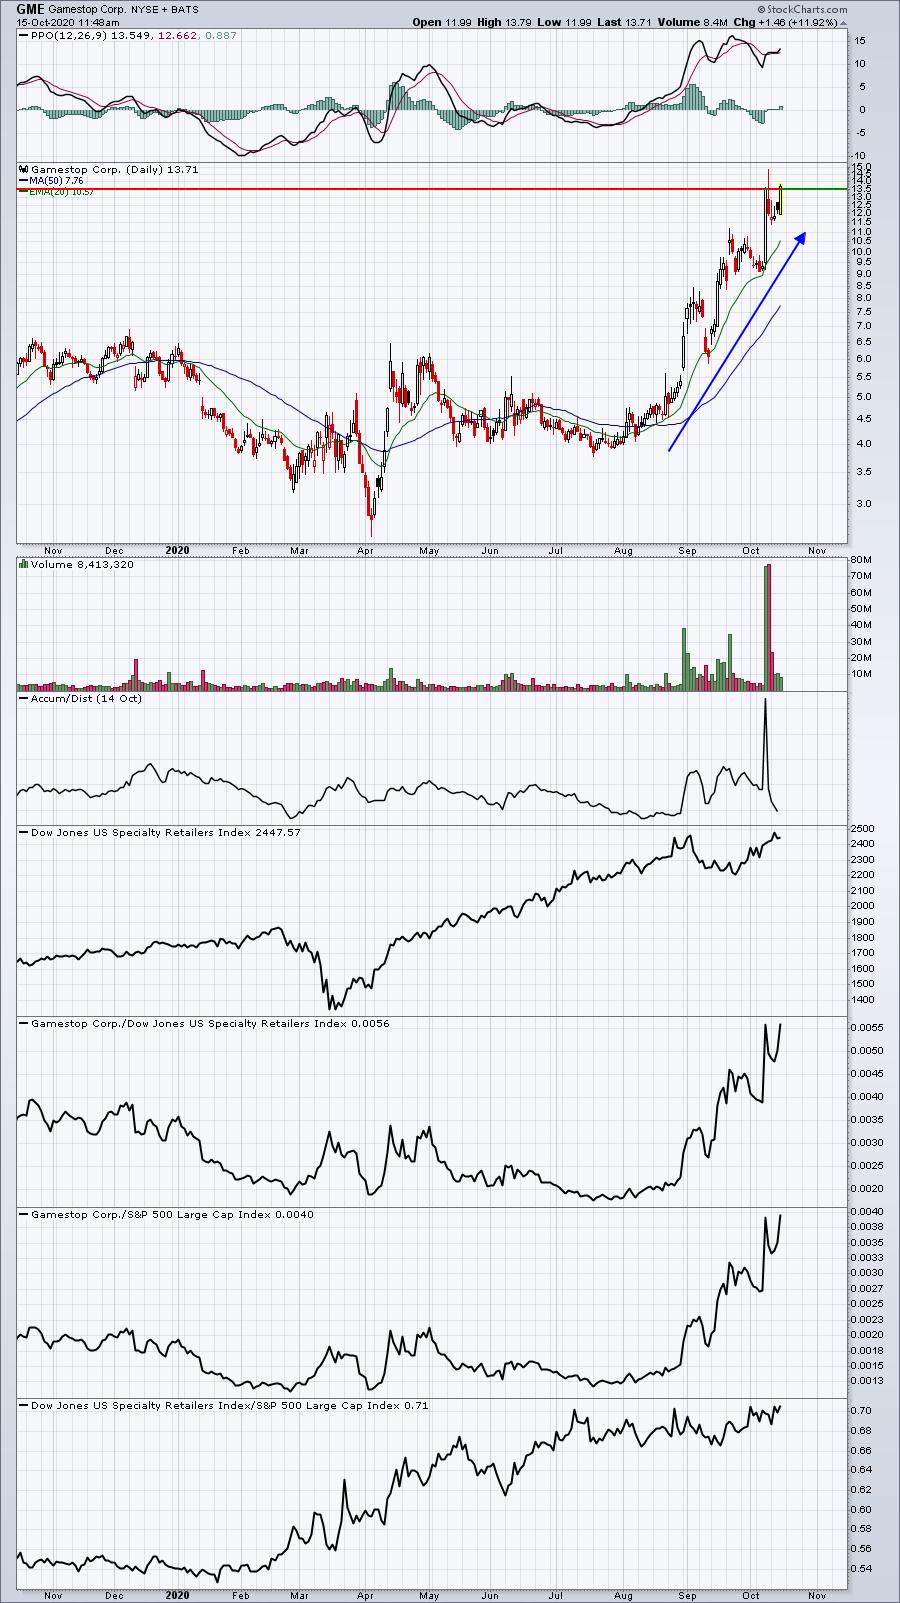
There is a massive short squeeze underway on GME, leading to incredible volatility, which is not for everyone. Another breakout today above 13.50 will force shorts to make a decision this afternoon, one that likely will drive GME higher and higher. The shorts' best hope revolves around a closing failure at 13.50.
BE:
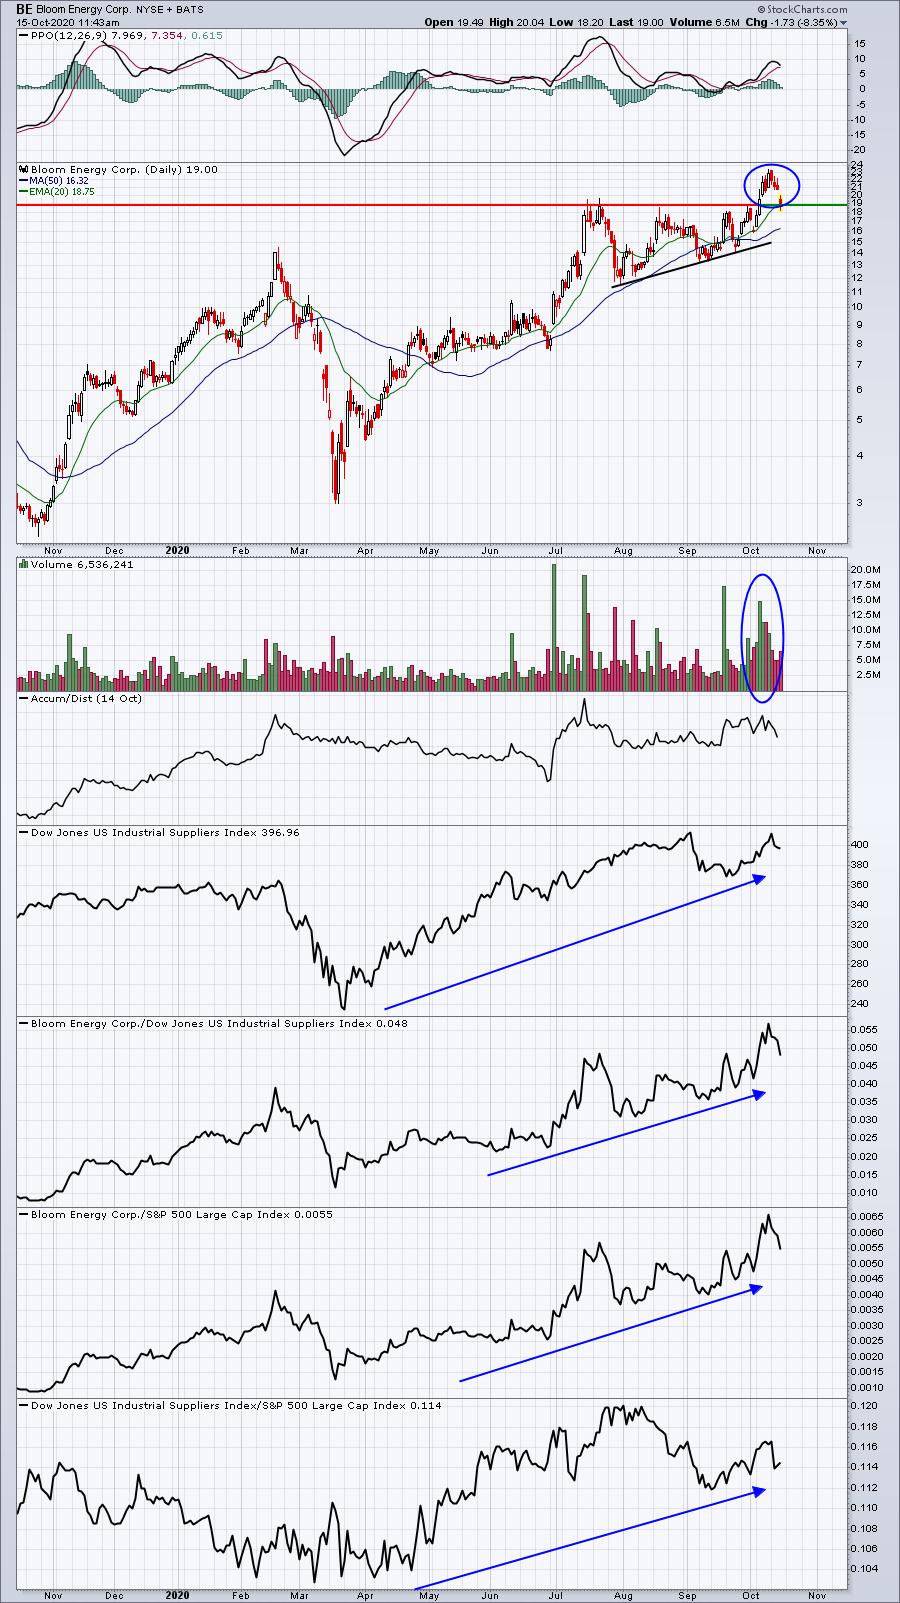
BE is now testing the breakout level. This is an area where I'd expect to see buyers return.
REGI:
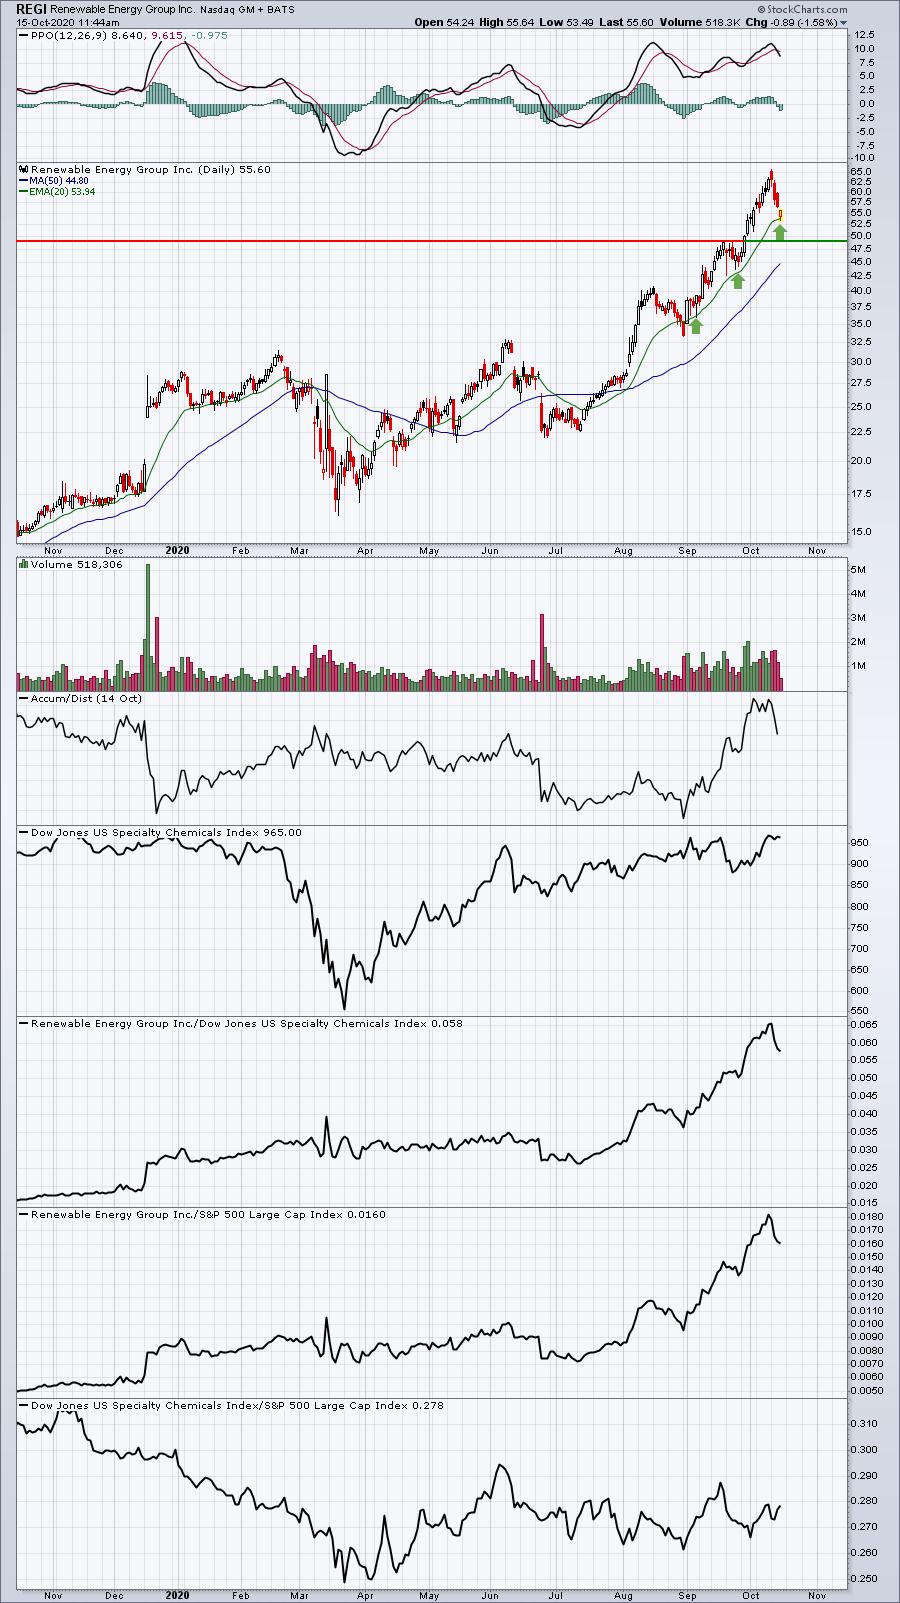
We're seeing a bounce off the 20 day EMA, which is what I'd look for. If that fails to hold, then there's price support closer to 49.
Earnings Reports
Here are the key earnings reports for the next two days, featuring stocks with market caps of more than $10 billion. I also include a few select companies with market caps below $10 billion. Finally, any portfolio stocks that will be reporting results are highlighted in BOLD. If you decide to hold a stock into earnings, please understand the significant short-term risk that you are taking. Please be sure to check for earnings dates for any companies you own or are considering owning.
Thursday, October 15:
TSM, ISRG, MS, TFC, WBA
Friday, October 16:
BK, VFC, STT, SLB, KSU, JBHT, CFG, ALLY
Economic Reports
Initial jobless claims: 898,000 (actual) vs. 825,000 (estimate)
October Philadelphia Fed Manufacturing Index: 32.3 (actual) vs. 14.5 (estimate)
October Empire State Manufacturing Index: 10.5 (actual) vs. 14.5 (estimate)
Happy trading!
Tom