
EB Daily Market Report - Friday, October 16, 2020
Last Call - Annual Membership Special + ChartList Updates
Annual Special Expires TODAY!
Our best annual membership special EVER ends TODAY. This is the last chance to extend your membership with a GREAT deal. Everyone that has an annual membership will continue to receive our new ETF service until their next renewal date. So if your membership expires in April 2021, you'll pay nothing additional for the ETF service until then. If you use this $697 annual special to extend your membership, you'll be paid through May 2022 (we're offering a one month bonus, so 13 months for the price of 12) and will continue to receive everything we offer, including the new ETF service, at no additional cost through that May 2022 date. That will represent a HUGE savings. In addition to a great annual deal, this special essentially guarantees you our ETF service at NO COST until your ultimate renewal date.
Our plan is to begin charging separately for our ETF service on January 1, 2021. Therefore, anyone who is a member through year end will be able to "test drive" this service to see if it adds value to your membership.
Also, those of you that are monthly or currently enjoying our 30-day trial, may extend using the annual deal above. You will not lose any of your current time. In the case of the 30-day trial, your 13 months would begin AFTER your trial expires. You don't lose any part of your trial. Just wanted to be clear about that.
If you have any questions or if you'd like to extend using this special, please contact us at [email protected]. It's our way of saying thank you for your support and commitment!
ChartLists Updated
3 ChartLists have been updated and are now available for download on our website. The Strong Earnings ChartList (SECL), Strong Future Earnings ChartList (SFECL), and Short Squeeze ChartList (SSCL) are all updated through today. :-)
Executive Market Summary
- Futures pointed to a fairly strong start to the U.S. equity market and we've remained in positive territory, though a bit of the shine is wearing off on the NASDAQ as the day wears on
- September retail sales blew away expectations; after a strong opening gap, the XRT has moved into negative territory
- The 10-year treasury yield ($TNX) is up a basis point to 0.74% and trying to continue its rally from Thursday
- Defensive areas are leading today as utilities (XLU, +1.33%) is the top performing sector
- Energy (XLE, -1.20%) and real estate (XLRE, -0.14%) are the only two sectors in the red at last check
- JB Hunt Transports (JBHT, -8.31%) is sending truckers ($DJUSTK, -3.58%) lower after missing its EPS estimate
- Schlumberger (SLB, -8.15%) is dragging energy lower
Market Outlook
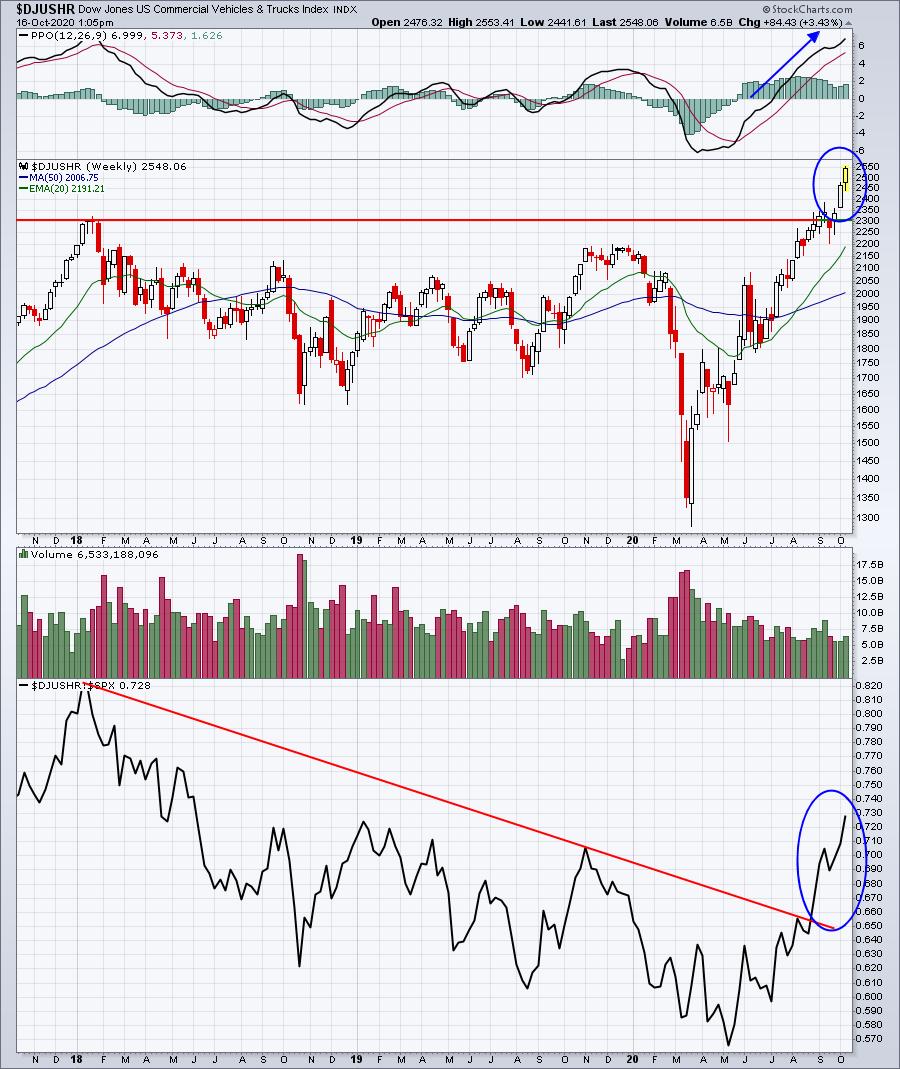
I watch rotation very, very closely and one group that's currently catching my eye is commercial vehicles & trucks ($DJUSHR), home of Caterpillar (CAT). The group and CAT are exploding to the upside. Should CAT report solid quarterly numbers, it could absolutely find itself in one of our 4 portfolios next quarter. First, check out the relative strength weekly chart in the DJUSHR over the past few years:
And here's the relative strength chart on CAT:
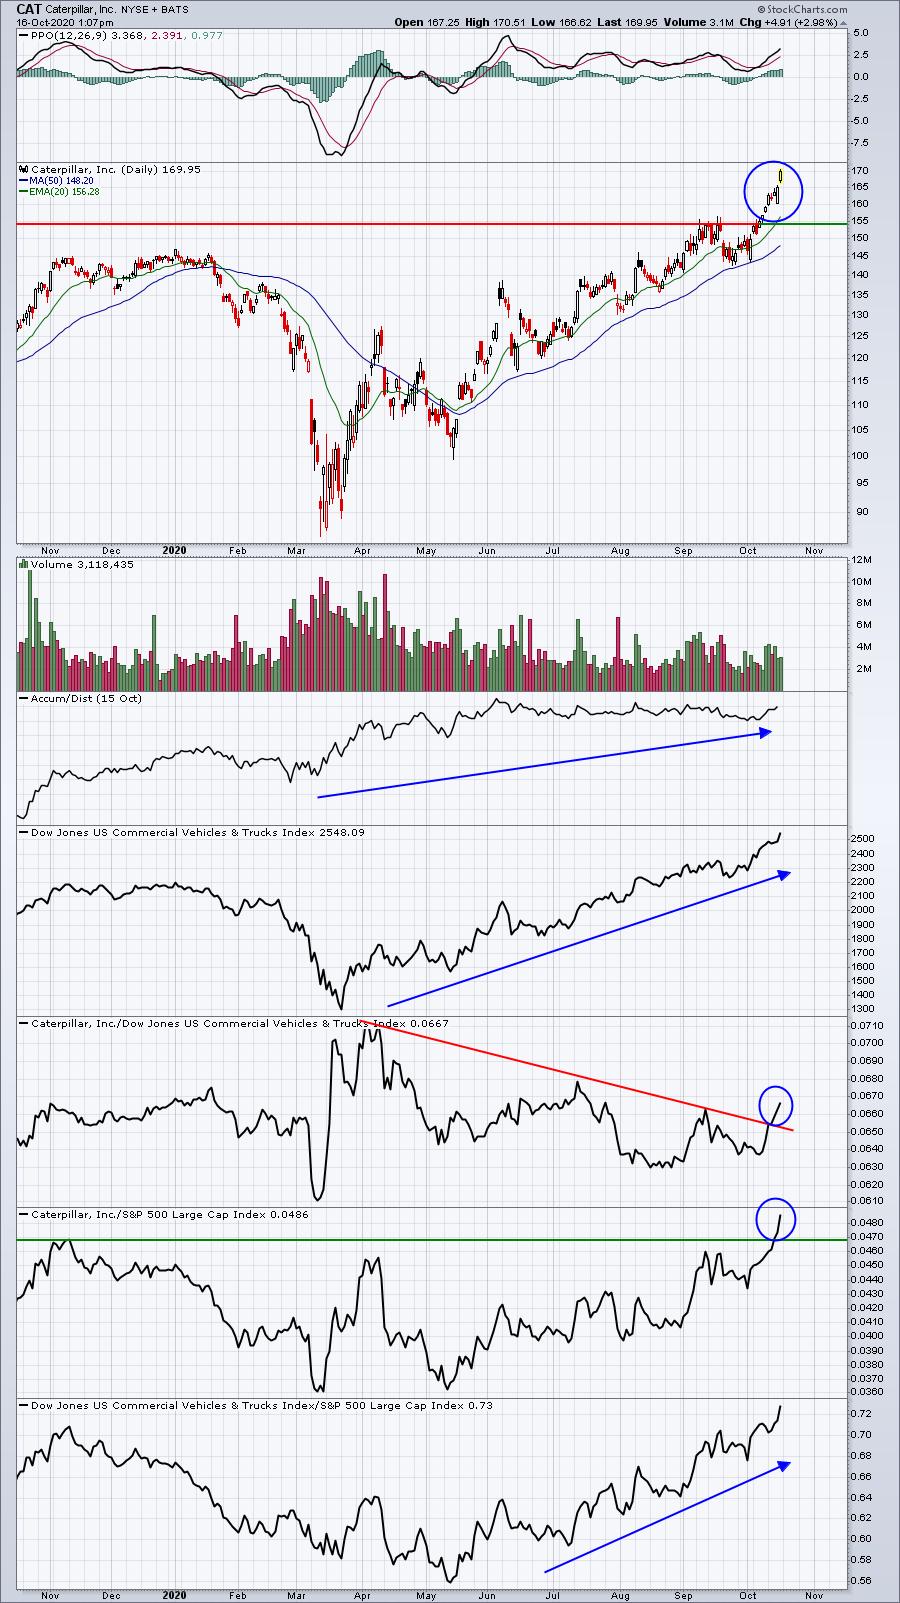
DE (not pictured) has absolutely been a much better stock in this space, but I like the improvements on this CAT chart. In picking between these two (DE and CAT), it'll come down to quarterly earnings. CAT reports 10/27, while DE doesn't report to 11/25.
Sector/Industry Focus
Retail areas of the market have been improving throughout the pandemic and we saw a much-better-than-expected September retail sales report this morning. Clothing & accessories ($DJUSCF) is one such area. Check out the absolute and relative breakouts:
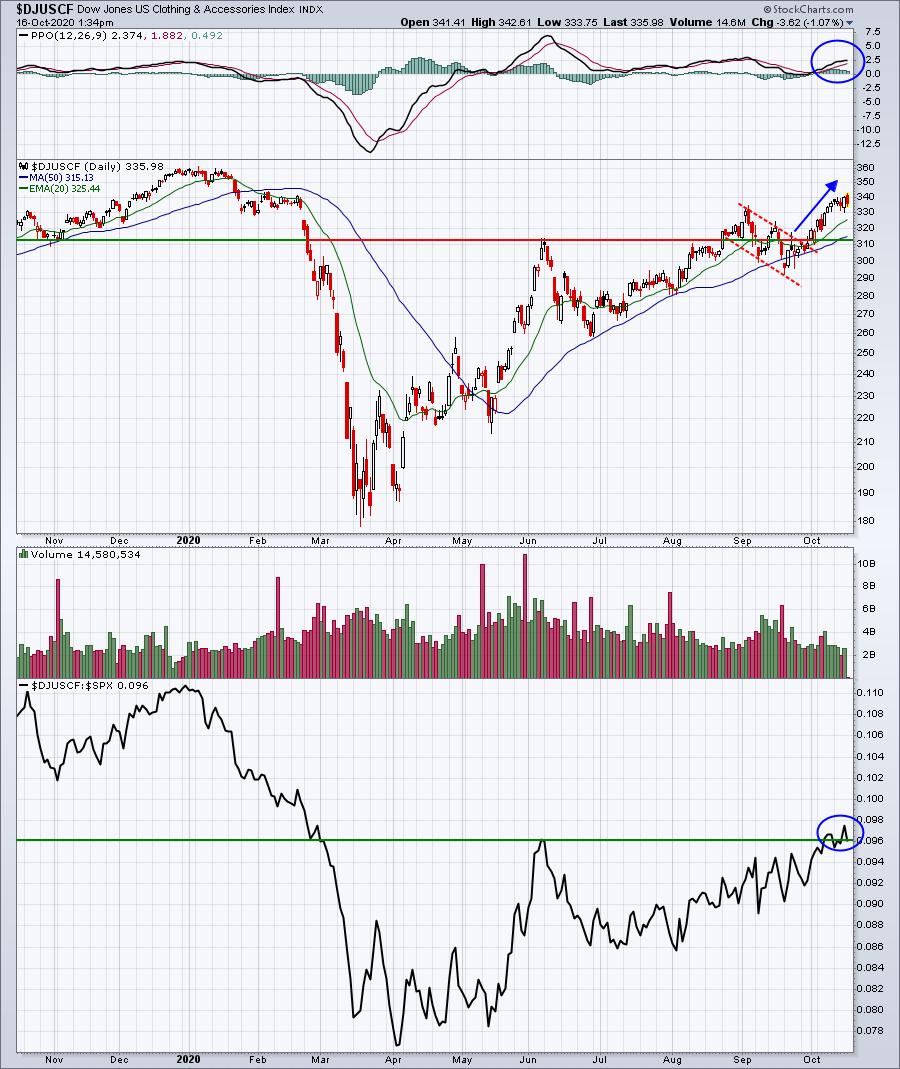
I believe the DJUSCF is an area we can begin looking at much more closely given the relative breakout above the June relative high.
ChartLists/Strategies
I want to point out that Monday is the 19th of October. The 19th to the 25th of ALL calendar months tends to be challenging. We also have options expiring today. The week of, and the week after, options expiration tends to be weak as well. Throw in the fact that the October 21st through October 27th period represents THE WORST calendar week of the year historically, dating back to 1950 on the S&P 500, and it probably makes sense to be a little cautious heading into next week. Let me be clear about one thing. I have ZERO plans to short anything. I don't care what history tells me. The stock market is telling me we're in a secular bull market and I don't short stocks in a secular bull market. It's that simple. However, I am building up more cash than I normally would, just in case we struggle over the next 7-10 days. I believe that's the prudent thing to do.
I am not talking about the portfolios. We buy them and hold them for 3 months, no exceptions. I'm strictly talking about my trading strategy. I always take it easy heading into this historically weak period.
As a result of being a bit more cautious right now, I'm not going to offer up any individual stock trading ideas. However, I will point out - as I have previously - to be careful with PTON because of the very large number of in-the-money calls. I love the stock, but short-term we could see an options-related selloff. Here's the 5 day, 10 minute intraday chart:
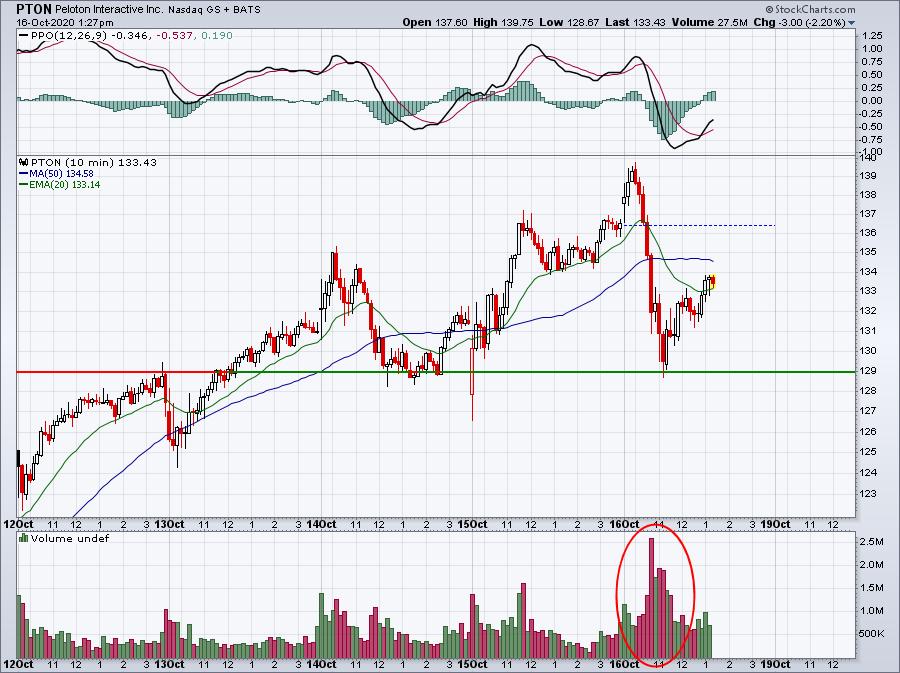
Volume is exceptionally heavy today and much of that volume seemed to be driving PTON lower. I wouldn't be surprised if it were market makers trying desperately to save some option money. If PTON closes on its low today, next week could be VERY interesting.
Earnings Reports
Here are the key earnings reports for the next two days, featuring stocks with market caps of more than $10 billion. I also include a few select companies with market caps below $10 billion. Finally, any portfolio stocks that will be reporting results are highlighted in BOLD. If you decide to hold a stock into earnings, please understand the significant short-term risk that you are taking. Please be sure to check for earnings dates for any companies you own or are considering owning.
Friday, October 16:
BK, VFC, STT, SLB, KSU, JBHT, CFG, ALLY
Monday, October 19:
IBM, CDNS, PPG, LOGI, ELS, HAL, CCK, LII, STLD, ZION, ADC, HXL, FNB
Economic Reports
September retail sales: +1.9% (actual) vs. +0.7% (estimate)
September retail sales less autos: +1.5% (actual) vs. +0.3% (estimate)
September industrial production: -0.6% (actual) vs. +0.6% (estimate)
September capacity utilization: 71.5% (actual) vs. 71.9% (estimate)
August business inventories: +0.3% (actual) vs. +0.4% (estimate)
October consumer sentiment: 81.2 (actual) vs. 80.5 (estimate)
Happy trading!
Tom