
EB Daily Market Report - Tuesday, October 20, 2020
Special Event Today at 4:30pm ET
It's time to take a look ahead at earnings reports due out over the next week to ten days. There will be hundreds of companies reporting their latest results, but which ones are likely to report great numbers? I'll dive into the charts to try to answer that question. This is a member-only webinar. The webinar room will open at 4:00pm ET and we'll get started promptly at 4:30pm ET. Here's a link to today's room:
https://us02web.zoom.us/j/87699887546
Hope to see you there! If not, we'll record the webinar as we always do and make it available to all of our members.
Executive Market Summary
- Futures were higher this morning and we've been mostly in higher territory throughout the session
- The U.S. dollar (UUP) has fallen for a third consecutive day, leading commodities higher
- Copper ($COPPER) is breaking out to its highest level in more than 2 years, adding fuel to the bull theory fire, as copper prices tend to flow in the direction of global economic conditions
- Logitech (LOGI, +15.63%) is surging following a blowout quarterly report and significantly raising its FY21 guidance
- Computer hardware ($DJUSCR, +1.80%) is getting a lift from the LOGI earnings report
- The 10-year treasury yield ($TNX) has jumped 3 basis points today, threatening to close at a 4 1/2 month high
- Transports ($TRAN) are seeing buyers as the group looks to close at yet another all-time high today
- IBM is the biggest loser in the S&P 500, falling more than 6%, after reporting less-than-inspiring results
Market Outlook
I view the NASDAQ 100 ($NDX) as our leader until proven otherwise. After its recent short-term uptrend on the hourly chart was broken, a down channel formed and remains in play, especially given the weak historical period we're about to enter:
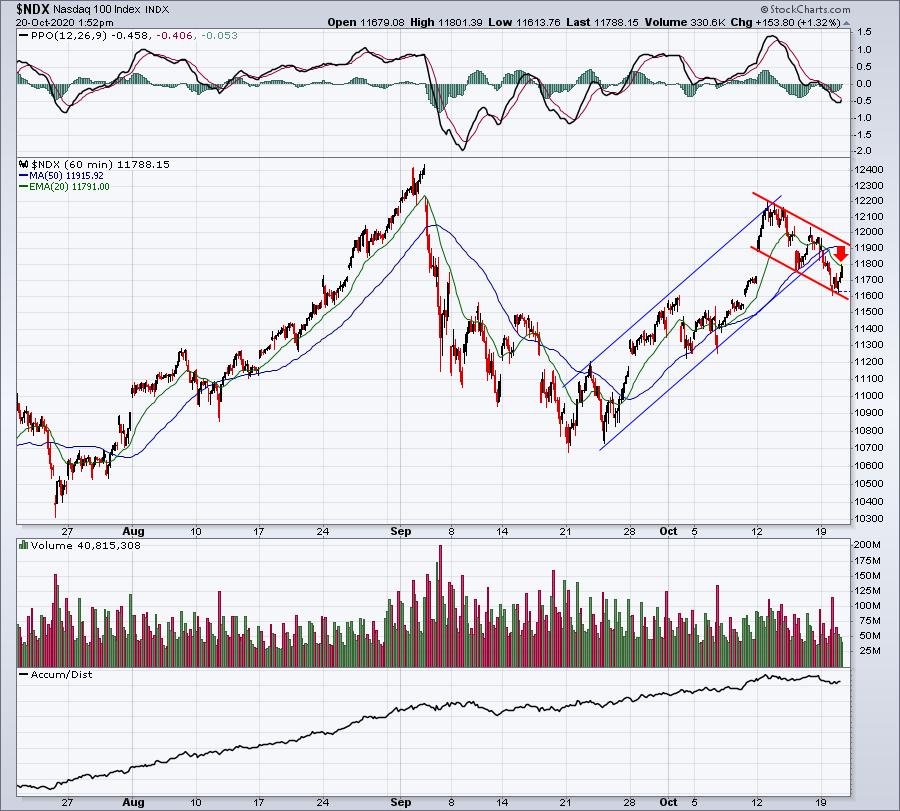
On the NDX daily chart, we've seen a bounce off the 20 day EMA, which is definitely a bullish development. Here on the hourly chart, however, we're not out of the woods just yet. As I'm writing this, we're testing the declining 20 hour EMA. In addition, I'd look at the 11900-11925 area as a possible down channel resistance line. That's IF we can negotiate the 20 hour EMA. Let's keep in mind that tomorrow begins the worst week of the year historically, which I discuss in the next section.
Sector/Industry Focus
Ordinarily, I'll look at a chart of a sector or industry group here. But I think it's worthwhile to talk about S&P 500 history today, especially since it's the "eve" of the worst week of the year historically. October 21st (close) through October 27th (close) is the worst 6 day consecutive period for the S&P 500 over the past 70 years. Here are the annualized returns on the S&P 500 by day:
October 22nd: -96.42%
October 23rd: -7.03%
October 24th: -39.18%
October 25th: -48.74%
October 26th: -47.15%
October 27th: -18.32%
Now before everyone goes running for the hills, keep in mind that this period does not result in panicked selling every year. There is ONLY a tendency to see weakness, that's all. In fact, over the past 20 years, this October 21st to October 27th period has advanced 11 times and fallen 9 times. The largest advance was in 2011, when the S&P 500 advanced 3.74%. But there was a nasty decline in 2008 as the S&P 500 fell more than 11%. In 2018, we saw a 3.94% decline over that 6-day period.
I am not expecting any type of huge decline, but there are enough uncertainties - election, stimulus, COVID-19, earnings, etc. - for a couple warning shots to be fired over the next week. Personally, I'd rather be safe than sorry, so I'm being a bit cautious in the very near-term.
ChartLists/Strategies
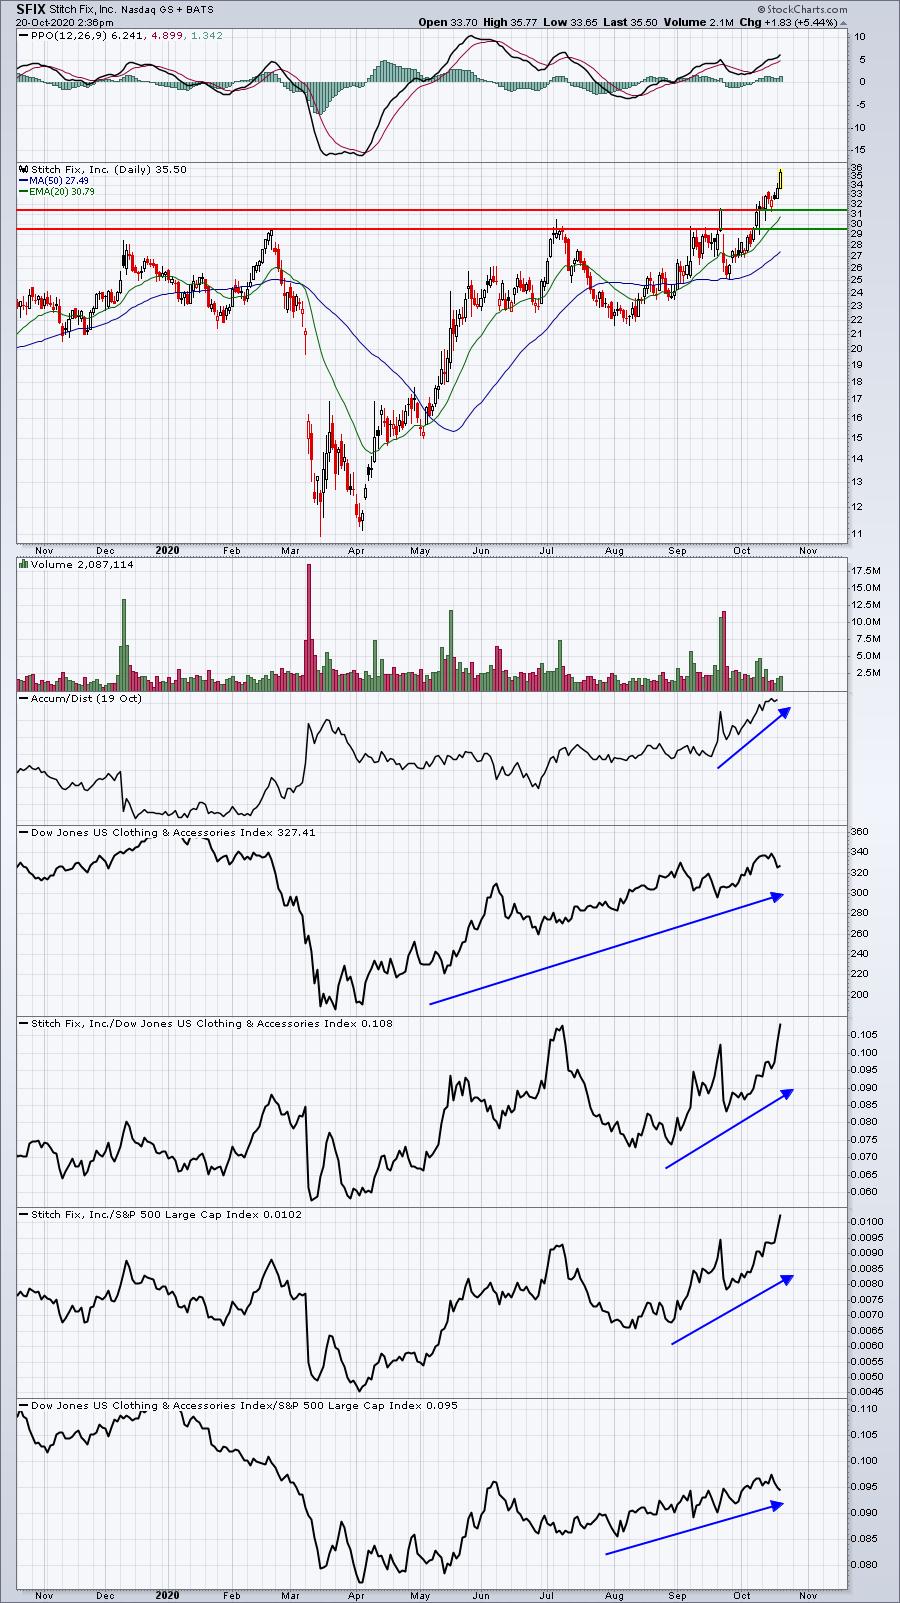
A few of our Short Squeeze ChartList stocks continue to rally, putting enormous pressure on short sellers to cover their positions. Here are two that I believe continue to look quite strong:
SFIX:
FIZZ:
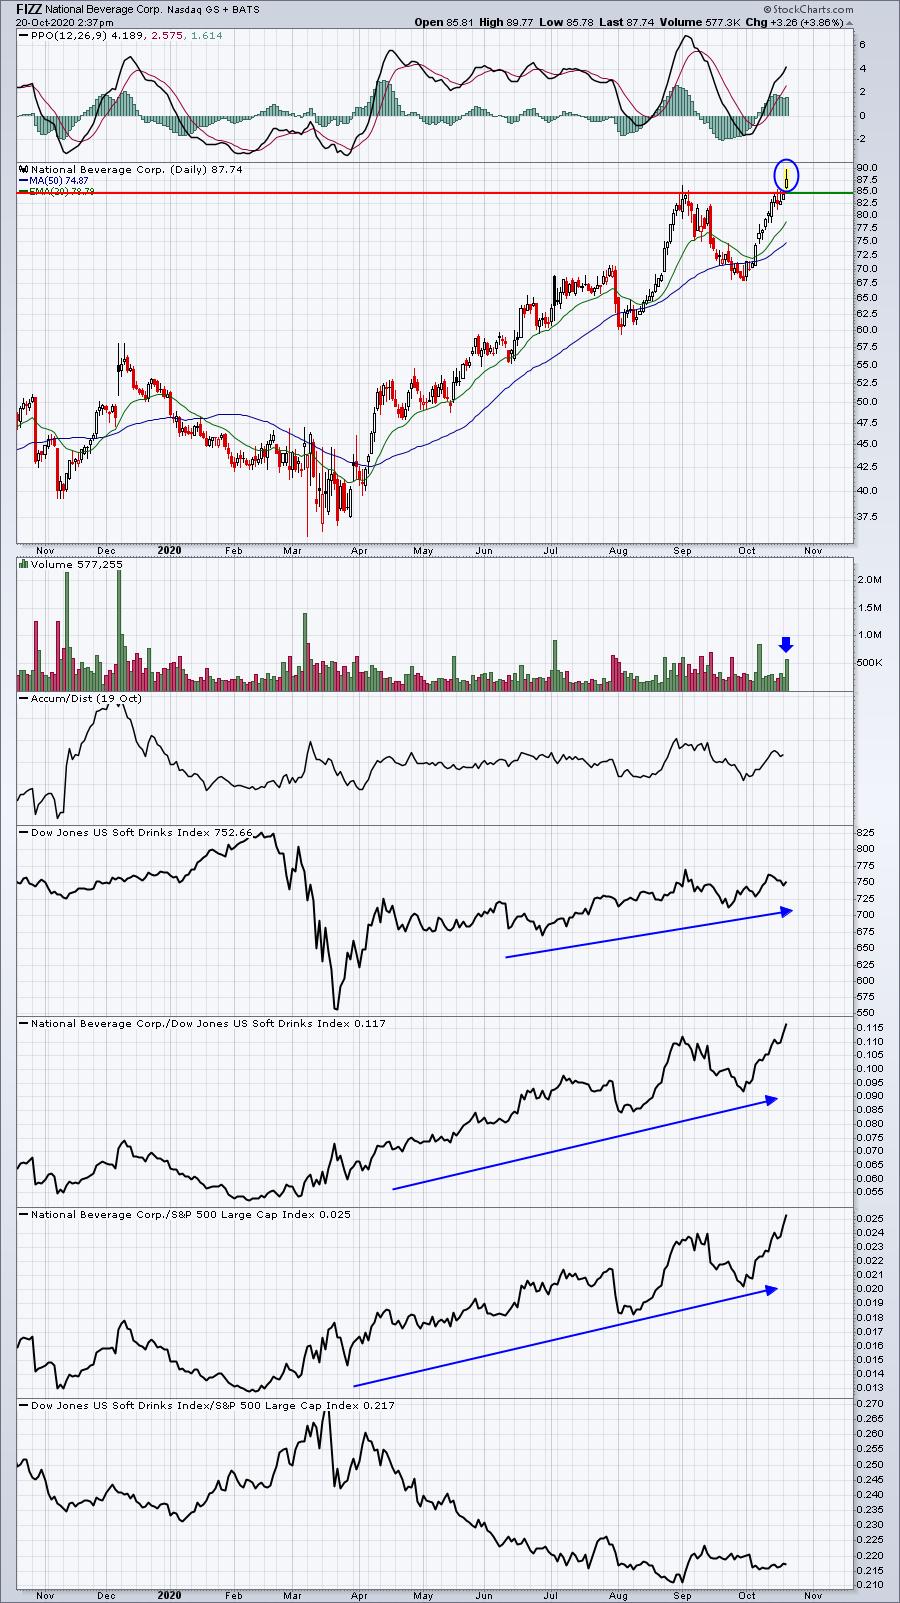
Soft drinks ($DJUSSD) have been weak on a relative basis, so that's one negative on FIZZ. But otherwise, I'd have to believe that short sellers are feeling some serious pain on these two stocks and may begin to buy in droves. If so, look for higher prices on both charts.
Please keep in mind that short squeeze stocks present higher risks, but also higher potential rewards. Make sure you're comfortable with the increased risk before considering a position.
Earnings Reports
Here are the key earnings reports for the next two days, featuring stocks with market caps of more than $10 billion. I also include a few select companies with market caps below $10 billion. Finally, any portfolio stocks that will be reporting results are highlighted in BOLD. If you decide to hold a stock into earnings, please understand the significant short-term risk that you are taking. Please be sure to check for earnings dates for any companies you own or are considering owning.
Tuesday, October 20:
PG, NFLX, TXN, PM, LMT, CNI, PLD, CP, UBS, SNAP, IQV, PCAR, TRV, IBKR, AGR, SYF, DOV, TER, RF, WRB, CMA, MAN, GPK, THC, IRBT
Wednesday, October 21:
TSLA, VZ, ABT, TMO, NEE, CCI, CSX, EW, LRCX, BIIB, CMG, ERIC, LVS, APH, KMI, XLNX, ALGN, NDAQ, DFS, EFX, NTRS, SUI, BKR, KEY, WHR, TDY, AVY, ICLR, GGG, IPG, LAD, KNX, AN, MTH, SLG, WGO, NTGR
Economic Reports
September housing starts: 1,415,000 (actual) vs. 1,463,000 (estimate)
September building permits: 1,553,000 (actual) vs. 1,520,000 (estimate)
Happy trading!
Tom