
EB Daily Market Report - Wednesday, October 21, 2020
Special Annual Membership Offer Extended
Due to popular demand, we decided to extend last week's annual membership special through this Thursday. It's a $697 annual offer (vs. paying $97 per month). We are including a bonus month, so 13 for the price of 12. Also, our new ETF service will be included in this ANNUAL offer at no additional cost until your next renewal date. This represents a substantial savings as we're likely to price this new service at $497 annually, beginning January 1st, 2021. Even a potential bundling of our $697 service and the new ETF service at $497 would likely be around $997 annually. So extending now at $697 provides you that ETF service under the existing annual cost. It's a great deal and our BEST deal!
If you enjoy our service, please consider taking us up on this offer. To extend, or for more information, simply contact us at "[email protected]". To all of our members, thank you so much for your support!
Executive Market Summary
- Futures were higher mixed this morning after being mostly higher overnight
- After a push higher this morning, we're back to mixed numbers with the NASDAQ showing a bit of leadership
- Stimulus talks continue and reports suggest the two sides are growing closer
- The U.S. Dollar (UUP) is taking a hit for a fourth consecutive day, lifting commodities again; the breakout in copper ($COPPER) is shown below in Market Outlook
- Communication services (XLC, +1.96%) is the strongest sector by far as both media agencies ($DJUSAV, +5.70%) and internets ($DJUSNS, +2.89%) are enjoying strong sessions
- Netflix (NFLX, -6.60%) is certainly an exception in the internet space after posting disappointing results
- Energy (XLE, -0.84%) has quickly found its way back to the bottom of the sector leaderboard
- Tesla (TSLA) is on deck to report its latest quarterly results after the bell today
- Today's close marks the beginning of the worst consecutive 6-day period of the year historically, dating back to 1950 on the S&P 500
Market Outlook
Copper prices ($COPPER) are important to watch as its the one commodity whose demand rises as global economies strengthen or are expected to strengthen. We only see closing prices on StockCharts.com, but today's copper prices have reached $3.21, which is easily its highest level of 2020 and is nearing an extremely important technical price high from 2018:
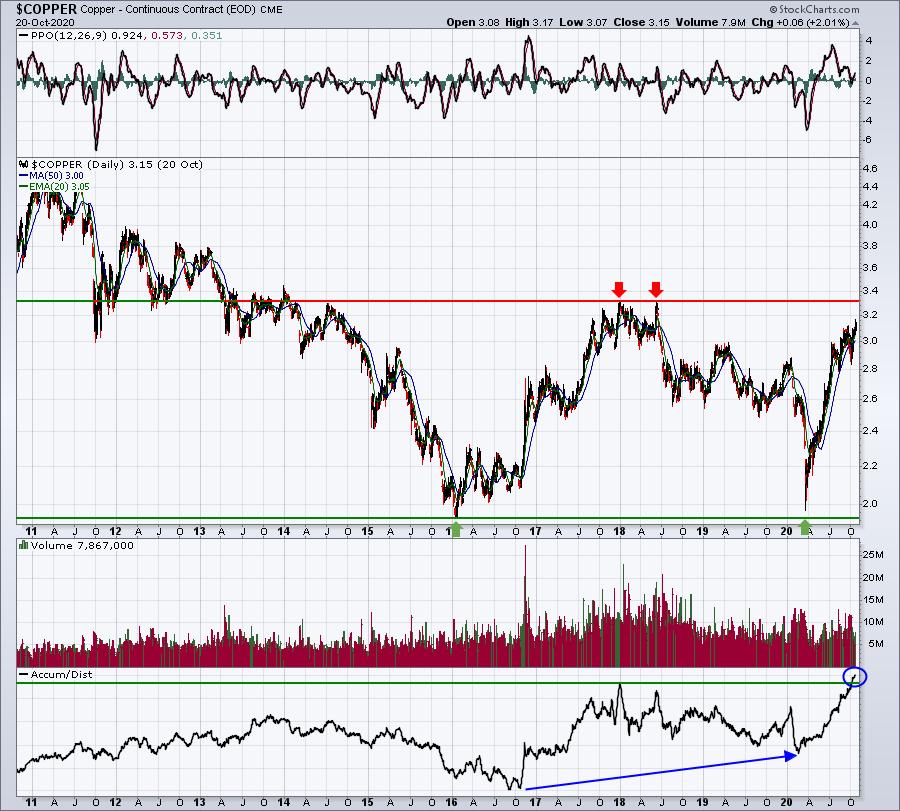
Now that a double bottom has been established, the reaction high between these two lows becomes very significant from a technical perspective. A breakout would argue that the downtrend has ended and a new uptrend has begun. Uptrending copper prices would have very bullish implications for global equity markets. On the following chart, check out the positive correlation between $COPPER and the S&P 500 on a long-term weekly chart:
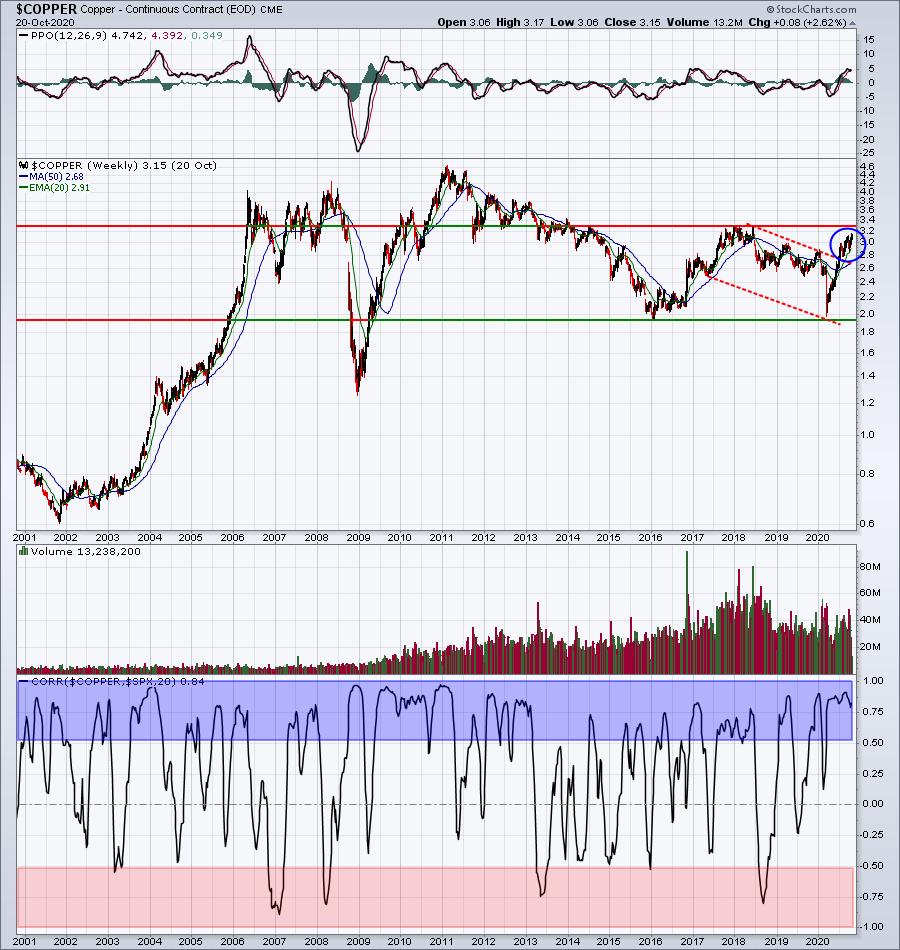
The blue-shaded area shows how often (frequently) these two are strongly correlated in positive fashion. The red-shaded area shows how often (rarely) these two move opposite one another. It stands to reason that renewed strength in COPPER bodes well for U.S. equities, as well as other equity markets around the world.
The ultimate breakout, however, comes on a copper move through 3.35-3.40. That's the breakout that confirms the double bottom is in place and that a longer-term uptrend is underway.
Sector/Industry Focus
The 10-year treasury yield ($TNX) is rallying for a 5th consecutive session and banks ($DJUSBK), which normally benefit disproportionately, are barely above the breakeven line. In fact, as the TNX moves to its highest level since the second week of June, banks are simply not keeping up. In my view, this is a reflection of the risks associated with rising loan loss reserves. Wall Street apparently believes more emphasis belongs on small- to mid-size companies that may not have the ability to repay loans. I'm not sure how else to explain this chart:
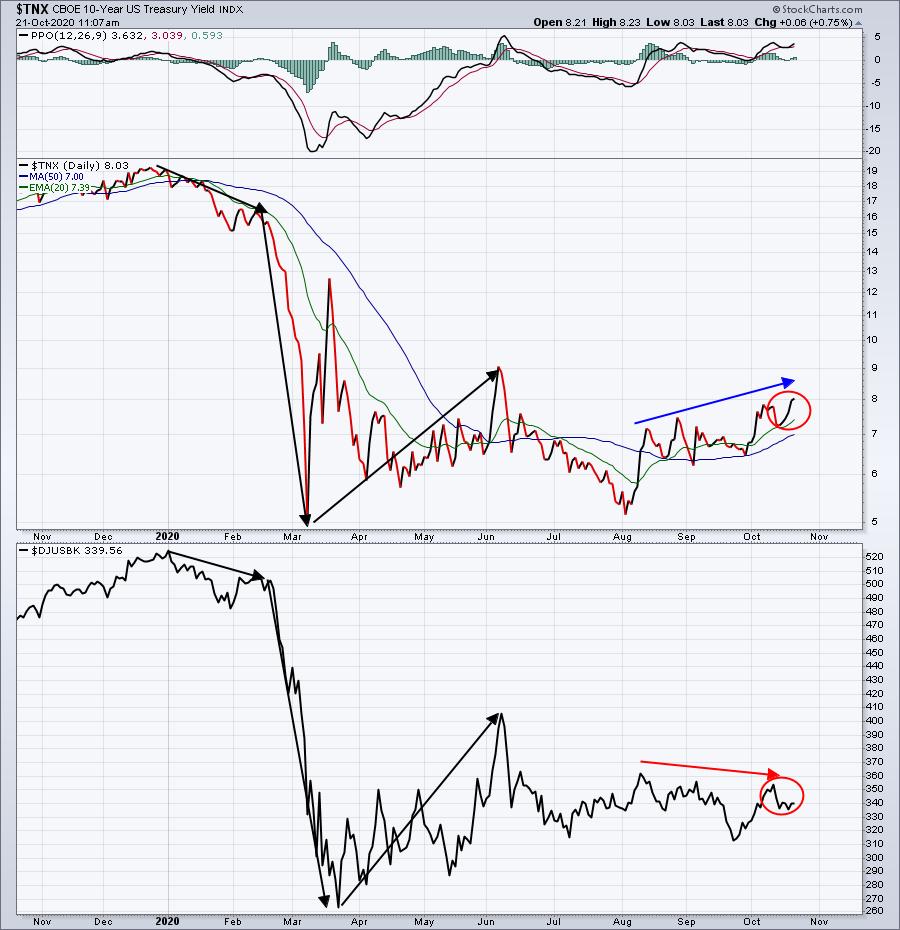
The recent weakness in banks could relate to the delay in a stimulus package. I do believe that this industry group is one that should benefit from another stimulus package as its customers should directly benefit from such stimulus. So if you believe that stimulus is a "slam dunk", you might consider overweighting this group in the short-term. Personally, I'm not a fan of this strategy as I still prefer to read and rely on the charts and they're saying to avoid financials at the present time.
ChartLists/Strategies
Before we consider trades, let's take a brief look at the S&P 500 hourly chart and understand that we're still in that short-term downtrend and a key test at 3425 is approaching:
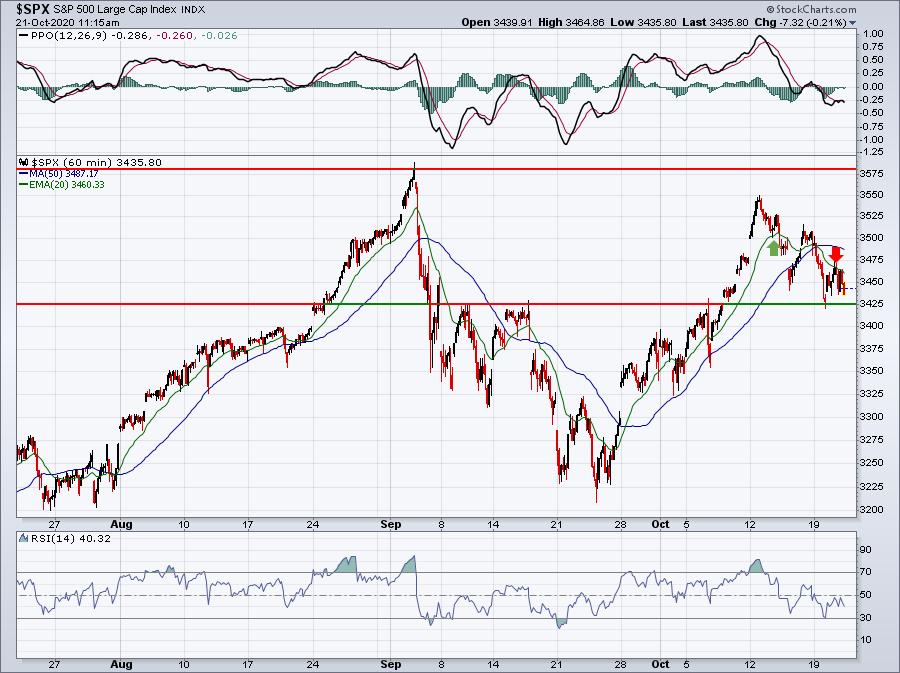
3425 served as resistance during the attempted September rebounds, but after breaking through, it becomes a key source of support. If that fails, just beware that we could be in for a period of deeper selling and we already know that the period we're about to enter (October 21st close to October 27th close) is the worst week of the year historically.
Having looked at this chart and keeping this historical information in mind, I'd consider trading fewer shares and maintaining a higher cash level - as a short-term trader - especially if this 3425 support is lost.
We added a new ChartList on our website. It's our Q3 Earnings ChartList, which comprises 115 companies that will be reporting earnings from Wednesday, October 21st (today, before market opened) through Wednesday, October 28th (after market closes). You might consider downloading this ChartList into your StockCharts.com account and then sorting it each morning using the "Summary" feature. This will help you to quickly identify stocks that are "on the move" because of an earnings report. Here's an example of how it would look:
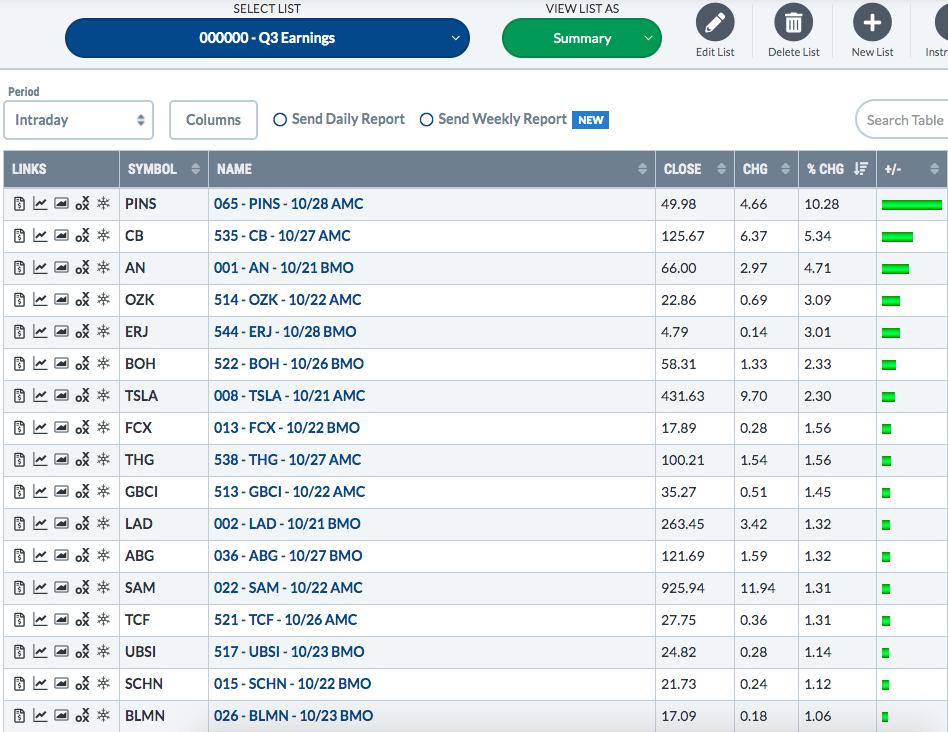
AN actually reported this morning and has reacted positively. I added the date of the earnings report and the time (either BMO or AMC, before market opens, after market closes) to quickly enable our members to identify whether a company has just reported.
TSLA will report its latest quarterly results after the close today and all eyes will be on that report. I expect another solid report, but if Elon Musk has proven one thing over the years, it's that he and his company are quite unpredictable.
Earnings Reports
Here are the key earnings reports for the next two days, featuring stocks with market caps of more than $10 billion. I also include a few select companies with market caps below $10 billion. Finally, any portfolio stocks that will be reporting results are highlighted in BOLD. If you decide to hold a stock into earnings, please understand the significant short-term risk that you are taking. Please be sure to check for earnings dates for any companies you own or are considering owning.
Wednesday, October 21:
TSLA, VZ, ABT, TMO, NEE, CCI, CSX, EW, LRCX, BIIB, CMG, ERIC, LVS, APH, KMI, XLNX, ALGN, NDAQ, DFS, EFX, NTRS, SUI, BKR, KEY, WHR, TDY, AVY, ICLR, GGG, IPG, LAD, KNX, AN, MTH, SLG, WGO, NTGR
Thursday, October 22:
INTC, KO, T, DHR, UNP, NOC, KMB, AEP, TAL, DOW, COF, STM, FCX, SIRI, LUV, VRSN, WST, RCI, GWW, CHKP, TSCO, CTXS, FITB, DGX, VLO, NUE, GPC, POOL, SIVB, STX, MTB, PHM, ARGX, SAM, ENTG, SNA, AAL, MANH, MAT, TPH, EHTH, LLNW, BJRI, SCHN
Economic Reports
Beige book will be released at 2:00pm ET
Happy trading!
Tom