
EB Daily Market Report - Friday, October 23, 2020
Executive Market Summary
- Futures were positive this morning as the stock market opened
- Then weakness set in, sending our major indices into negative territory
- The S&P 500 has moved positive again, however, as the bulls attempt to end the week on a solid note
- Intel Corp (INTC, -11.02%) is being punished after disappointing Wall Street with its latest results
- Semiconductors ($DJUSSC, -1.31%) are lower due to INTC and weighing on technology shares (XLK, -0.51%)
- Energy (XLE, - 1.11%) fell the hardest on the session, one day after posting huge relative gains; the failure is coming at the declining 20-day EMA, which is noteworthy technically
- Commodities are relatively flat, though crude oil ($WTIC) has fallen more than 2% and is back beneath $40 per barrel
Market Outlook
I want to reprint the S&P 500 and NASDAQ 100 chart that I posted in yesterday's DMR. I provided what I believed to be a fairly important short-term support level on each. Intraday, we saw a breach of the support levels provided, but by day's end, reversals were in place and that key support held. Check it out:
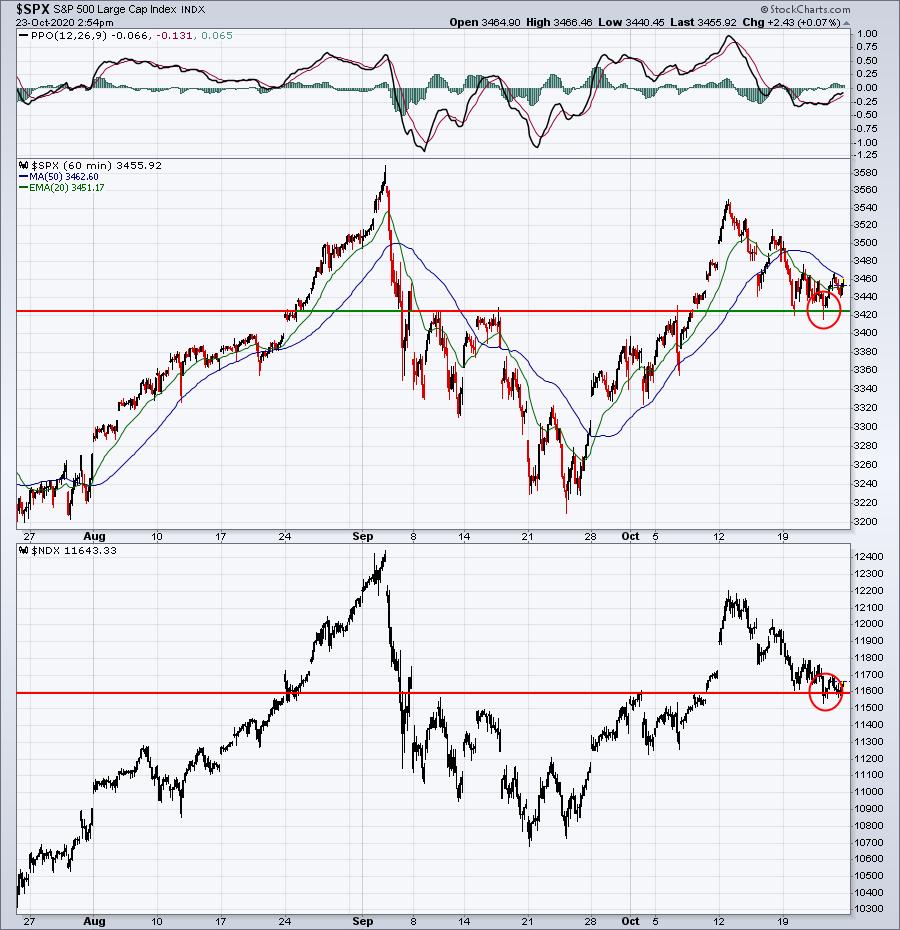
I am most definitely not saying that we're out of the woods, but holding key support is better than the alternative when you're in the bullish camp like I am. We have two more historically-bearish trading days - Monday and Tuesday - to endure before history turns more bullish.
We are still hovering just above key 20 day EMAs on our daily charts, which is also bullish for now. The flood gates will open next week in terms of the number of companies reporting their latest quarterly results.
Sector/Industry Focus
Growth (IWF) vs. value (IWD) is always stock market narrative and growth stocks have been winning in 2020. The IWF has been struggling on a relative basis, however, over the past 10 days and this can be visualized on the following 6 month, hourly chart:
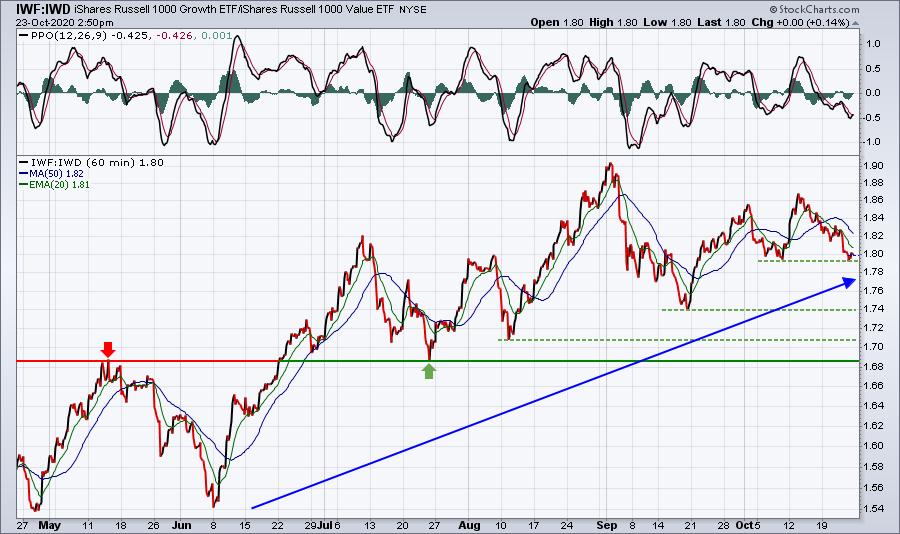
The green-dotted horizontal lines mark relative support. I believe the 1.69 solid green horizontal line is the one that's most important from a long-term rotational perspective. Right now, I believe growth remains the choice, despite its relative weakness the past couple weeks. Short-term, I'd like to see the green-dotted line near 1.79 hold. If it can hold into early next week, I believe growth investors will be ready to drive this ratio higher again. If not, then short-term pain could result in 1.74 relative support being tested.
ChartLists/Strategies
I ran a scan this afternoon of stocks in our portfolios with RSI below 50 (pullback candidate), SCTR above 95 (excellent relative strength, and an AD line that is higher than it was one month ago (22 trading days). 4 stocks were returned as follows:
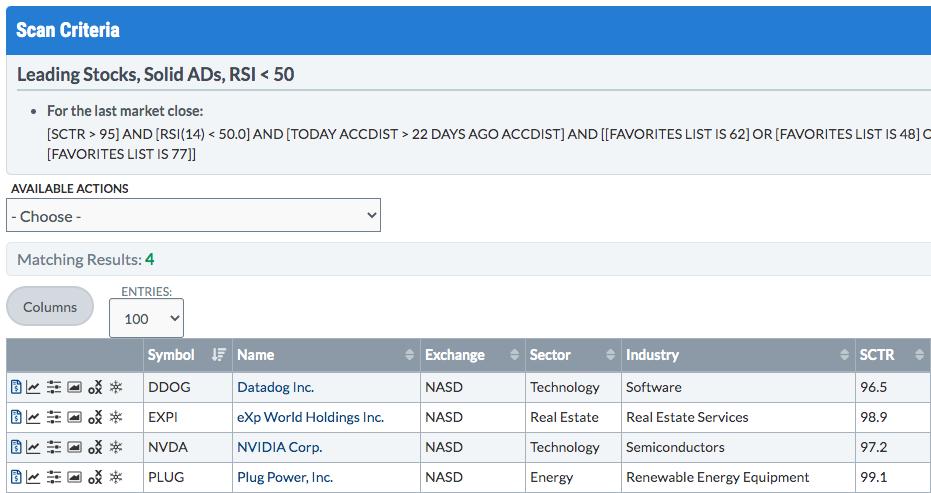
I liked all four charts, but DDOG was probably my favorite since it was testing price support in addition to maintaining relative strength during the recent selling:
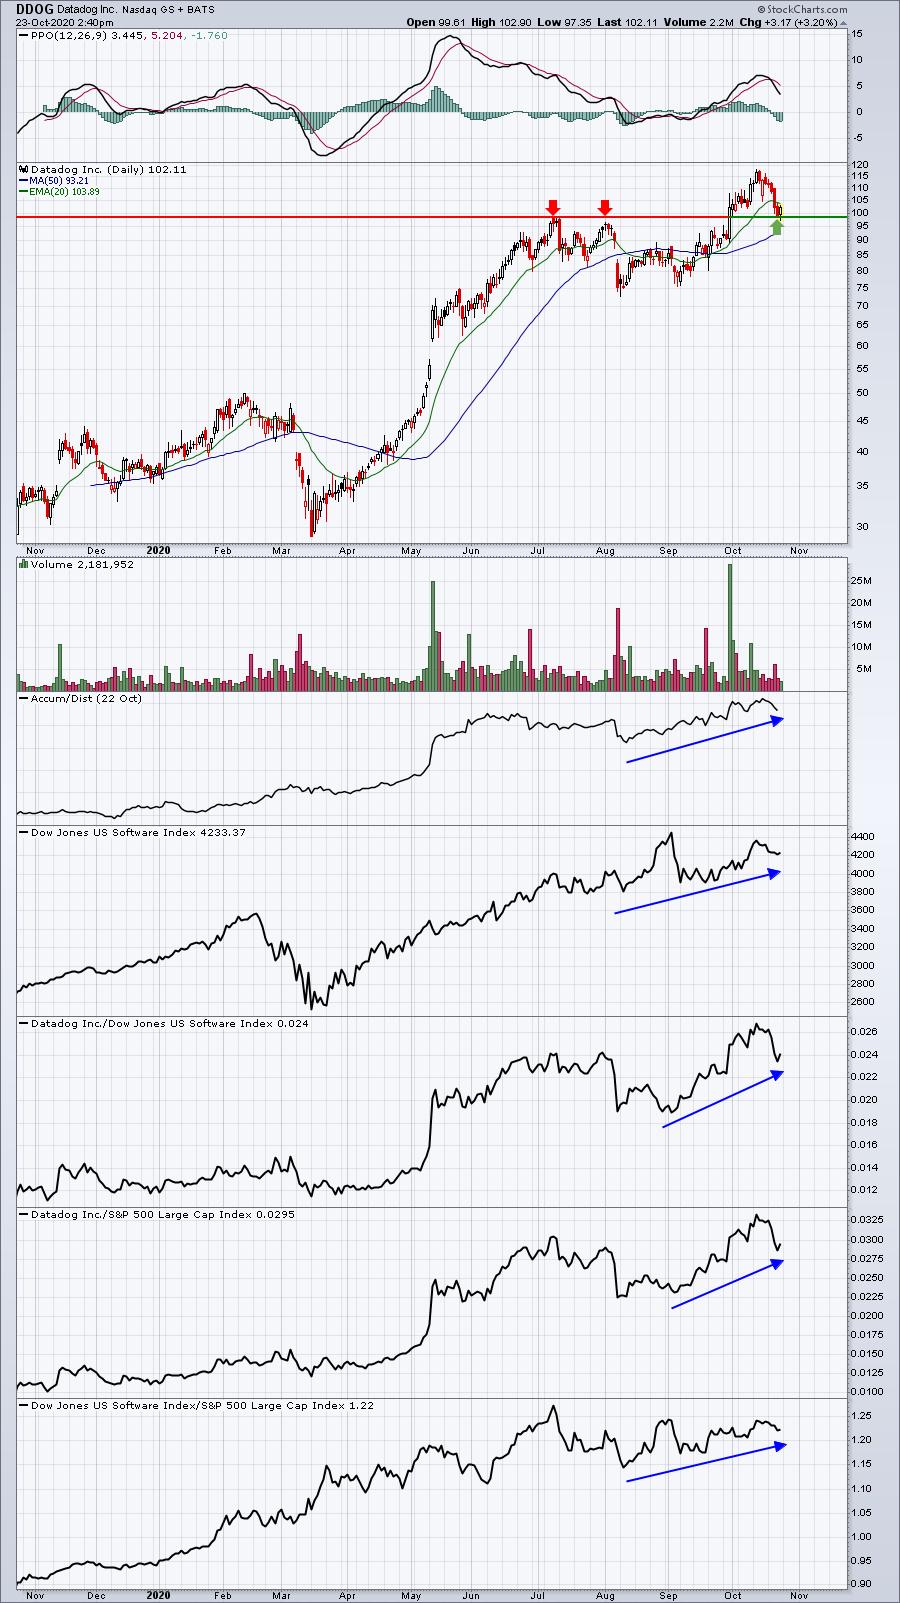
A close below 98-99 could result in further selling down to DDOG's 50 day SMA, but we may have already reached the extent of its short-term selling - especially if the overall market holds us during this historically-weak period.
Earnings Reports
Here are the key earnings reports for the next two days, featuring stocks with market caps of more than $10 billion. I also include a few select companies with market caps below $10 billion. Finally, any portfolio stocks that will be reporting results are highlighted in BOLD. If you decide to hold a stock into earnings, please understand the significant short-term risk that you are taking. Please be sure to check for earnings dates for any companies you own or are considering owning.
Friday, October 23:
AXP, ITW, ABB, ALV, GNTX, CRI, FHN, UBSI, CLF, TRTN, AIMC, BLMN, VRTS, GBX
Monday, October 26:
SAP, HCA, TWLO, NXPI, OTIS, ARE, CINF, BRO, HAS, PFG, PKG, CHGG, FFIV, OMF,
Economic Reports
October PMI Composite: 55.5 (actual) vs. 54.2 (estimate)
Happy trading!
Tom