
EB Daily Market Report - Monday, October 26, 2020
Executive Market Summary
- Futures were slightly lower to start the new week
- After a quick reversal to the upside after the open, big selling kicked in
- The Dow Jones is down more than 800 points as I write this, but there is weakness everywhere
- Defensive sectors like utilities (XLU, -1.07%) and real estate (XLRE, -1.77%) are holding up best, but all 11 sectors are lower
- Every industry group is lower today, which we have not seen since back in March
- Areas that were hit hardest by the pandemic in March are the groups being hit the hardest today as recreational services ($DJUSRQ, -8.56%), airlines ($DJUSAR, -5.94%), and hotels ($DJUSLG, -5.61%) are the 3 biggest laggards
- Solid earnings do not matter today either, as Hasbro (HAS, -9.59%) beat top and bottom line estimates
- Only one stock on the S&P 500 has gained more than 1% today - American Electric Power (AEP, +1.22%)
Market Outlook
Being cautious this time of year is generally a good idea and now we're seeing why. The Volatility Index ($VIX, +14.30%) is surging at last check as our major indices fail - at least for now - to hold onto short-term price support. There's no doubt this could lead to further short-term selling. Here's the price support on both the S&P 500 and NASDAQ being lost this morning:
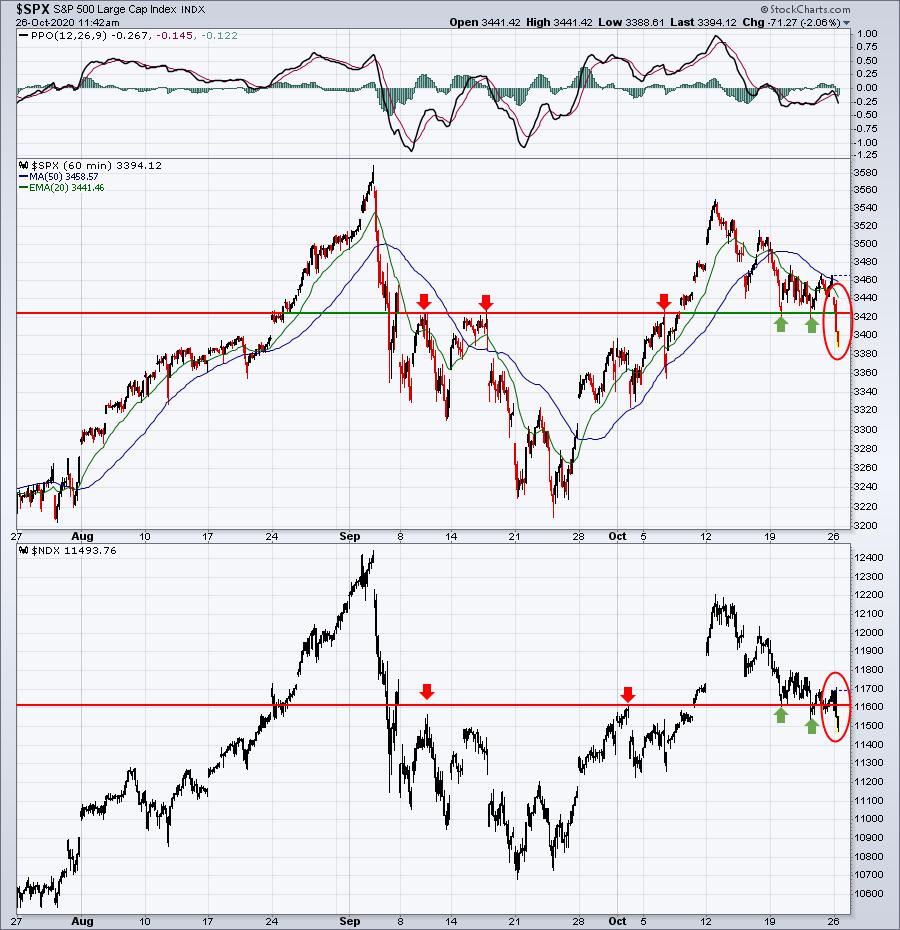
Two keys to the depth of this selling will be (1) whether we see a reversal this afternoon or even tomorrow, and (2) market rotation. More on the latter in the next section.
Sector/Industry Focus
Selling nearly always triggers defense mechanisms. As you recall, however, the pandemic-induced panic selling in March actually saw defensive groups underperform as money rotated to aggressive areas of the market. That rotation continued throughout much of 2020 and suggested to me that we witnessed a cyclical bear market, as opposed to a secular bear market. The difference is that secular means long-term, while cyclical is much shorter-term in nature.
When I gauge short-term bottoms, I tend to view rotation as well. For instance, if the selloff is occurring, but growth stocks hold up well, then I begin to question whether the selling will truly be severe. Typically, the first thing I do during a more significant selloff is check out the sector leaderboard, which looks like this:
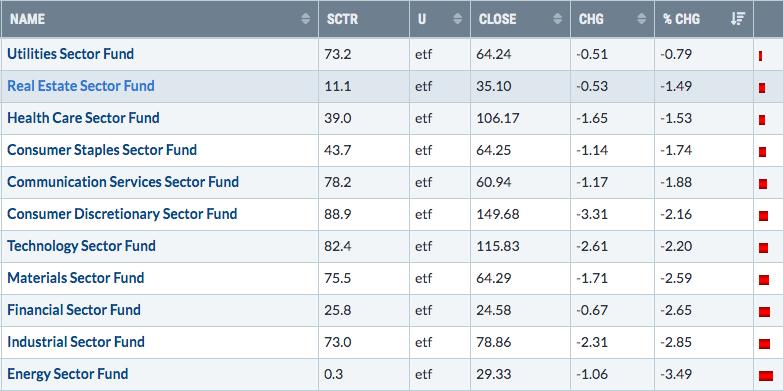
This is about what I would've expected. The defensive groups are outperforming on a relative basis, while the more aggressive groups underperform. It seems that energy (XLE) underperforms, no matter what kind of market we have. I like to take snapshots of this sector leaderboard throughout the weakness (so again this afternoon and tomorrow morning). I look to see if rotation begins to change. Sometimes, on the surface, we'll see our major indices deteriorate while more bullish rotation takes place under the surface.
In any event, I am using this weakness to build positions in several portfolio stocks in anticipation for what I believe will be a much stronger November ahead. Given the uncertainty of the virus and the election, I understand if many of you decide to wait to see how this selling plays out first.
ChartLists/Strategies
From a trading perspective, I'd remain somewhat cautious. Personally, I don't mind missing the absolute bottom, mostly because I cannot watch the market minute-by-minute like I used to when I traded full-time. I am a HUGE fan, however, of the Downtrend Reversal scan on our website. I know many of you use it as well. When the stock market is in a downtrend like it's been the past week or so, it can quickly help us to identify reversing stocks. I ran this a few minutes ago against our SECL, SFECL, SADCL, and RGCL, and here were the results (in SCTR order):
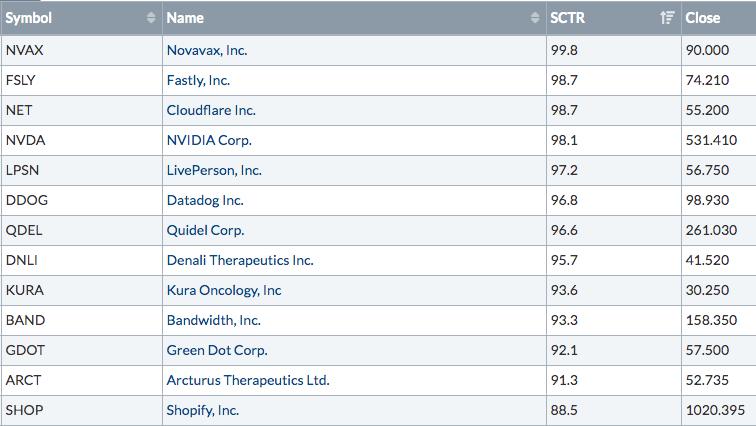
This is a good place to start to look for potential reversal candidates, ESPECIALLY if the overall market turns stronger this afternoon. Two weeks ago, BAND was nearly 200. After this period of selling, it's below 160 and trading just beneath its 50 day SMA. Should money begin rotating back towards growth stocks, a stock like BAND could be a major beneficiary. But again, waiting to see the market recover may be more appealing to many - rather than trying to catch a bottom before it happens.
Earnings Reports
Here are the key earnings reports for the next two days, featuring stocks with market caps of more than $10 billion. I also include a few select companies with market caps below $10 billion. Finally, any portfolio stocks that will be reporting results are highlighted in BOLD. If you decide to hold a stock into earnings, please understand the significant short-term risk that you are taking. Please be sure to check for earnings dates for any companies you own or are considering owning.
Monday, October 26:
SAP, HCA, TWLO, NXPI, OTIS, ARE, CINF, BRO, HAS, PFG, PKG, CHGG, FFIV, OMF
Tuesday, October 27:
MSFT, PFE, MRK, NVS, LLY, MMM, RTX, AMD, CAT, SPGI, FISV, SHW, ECL, CB, BP, ROP, CNC, DXCM, CMI, CSGP, MSCI, SWK, GLW, AFL, DTE, ODFL, EIX, FTV, MKTX, LH, MXIM, EQR, AKAM, QSR, TRU, VAR, IEX, WAT, OKE, CHRW, MASI, ENPH, PPD, BXP, BEN, OMC, FSLR, HUBB, JNPR, SWI, MKSI, PII, LSCC, NEO, HOG, XRX, UNM, TENB, JBLU, CROX, APAM, FEYE, TWOU, SHOO, AUDC, SYX
Economic Reports
September new home sales: 959,000 (actual) vs. 1,016,000 (estimate)
Happy trading!
Tom