
EB Daily Market Report - Tuesday, October 27, 2020
Executive Market Summary
- Futures were set to rebound this morning, which they did at the opening bell
- The Volatility Index ($VIX, +2.46%) is above 33, so we should be prepared for potential whipsaw action short-term
- Economic reports out this morning were mostly positive, especially durable goods and Case-Shiller
- Xilinx (XLNX, +9.73%) is the top S&P 500 performer, after agreeing to its $35 billion all-stock acquisition by Advanced Micro Devices (AMD, -3.25%)
- F5 Networks (FFIV, +7.93%) is seeing a strong quarterly earnings report reaction after beating revenue & EPS estimates and raising guidance
- The NASDAQ is showing relative strength today as the growth vs. value (IWF:IWD) ratio rises for a 3rd straight day
- Communication services (XLC, +0.56%) and technology (XLK, +0.32%) are showing strength today, while energy (XLE, -1.37%) lags
- The 10-year treasury yield ($TNX) falls for a 3rd straight day, this time by 2 basis points to 0.78%
Market Outlook
Well, today is the end of our historical bearish period. The next 9 calendar days are THE MOST BULLISH during the calendar year. Here are the annualized returns for each day during this upcoming bullish period on the NASDAQ (since 1971):
Wednesday, October 28th: +172.44%
Thursday, October 29th: +59.16%
Friday, October 30th: +44.04%
Saturday, October 31st (market closed): +111.41%
Sunday, November 1st (market closed): +29.44%
Monday, November 2nd: +119.67%
Tuesday, November 3rd: +90.47%
Wednesday, November 4th: +71.26%
Thursday, November 5th: +90.21%
Friday, November 6th: +26.23%
During this October 28th through November 6th period, there have been 335 trading days since 1971. 204 of them have ended higher, or 60.90%. The annualized return of the entire period is 81.13%, way, way above the average annual return on the NASDAQ over the same period.
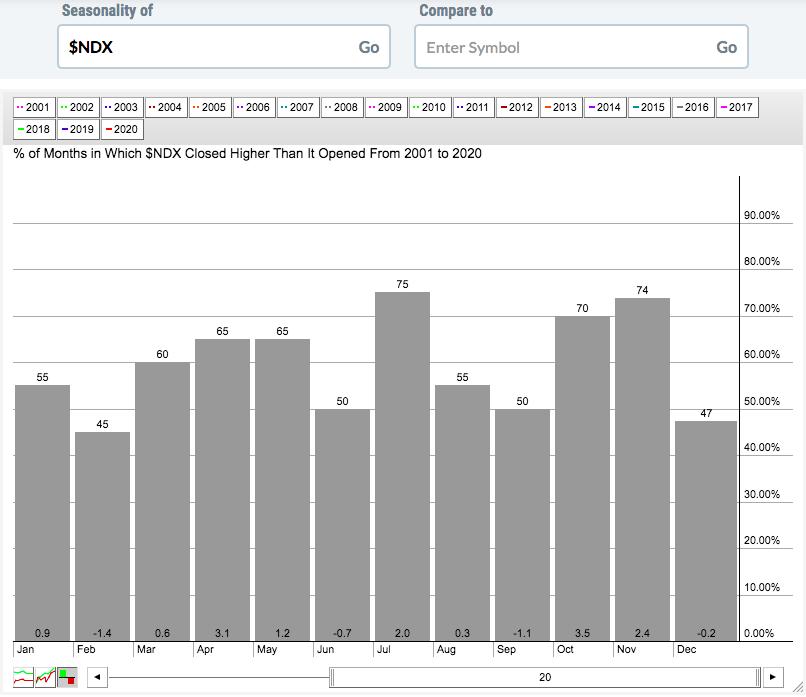
It's also worth noting that November has been kind to the NASDAQ 100 ($NDX) this century. Here's the seasonality chart that shows that the NDX has risen roughly 75% of all Novembers in the past two decades:
Sector/Industry Focus
I've been sticking to my guns on internet stocks ($DJUSNS) and it's beginning to pay off. They're currently moving higher to approach absolute price resistance (lower panel), but they've broken out on a relative basis and their weekly relative momentum is accelerating:
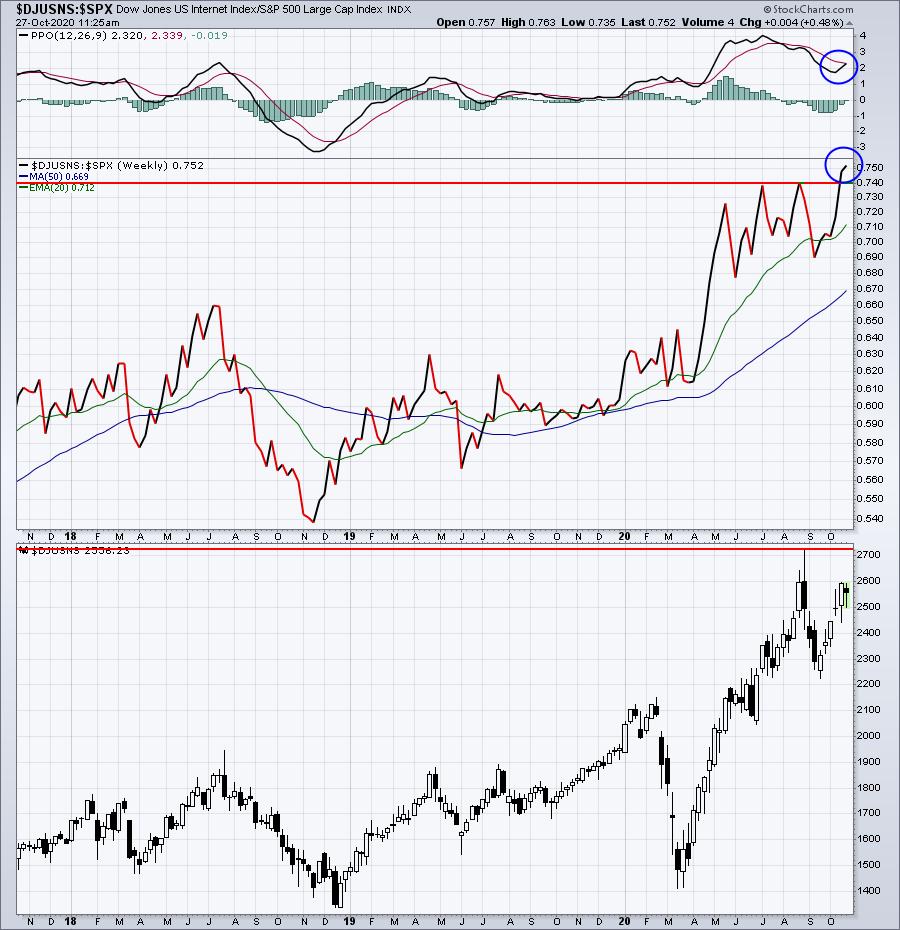
The key closing price level is 2709.71. Closing above that level is likely just a formality, given my bullishness, but actually doing it will send others into this group, chasing prices higher. Internet is one of my favorite industry groups heading into November.
ChartLists/Strategies
The market is rotating. Knowing history the way we do, it's likely to continue. The best visualization that I can give you is to look at the IWF:IWD 10-minute chart over the past 15 days:
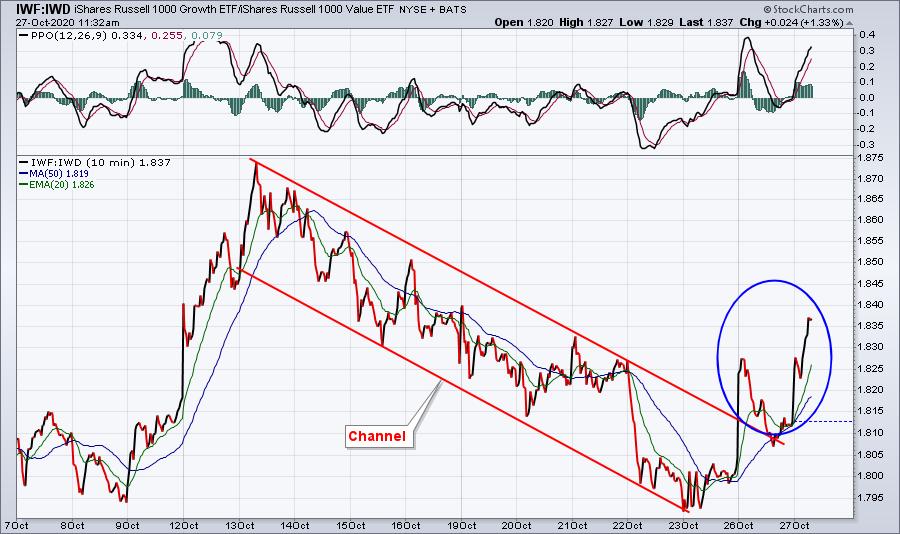
While nothing provides us guarantees, and this certainly doesn't, I do like the shift in sentiment as we enter the most bullish historical period of the year.
As you peruse our ChartLists, I'd try to stick with stocks that are part of very strong sectors and industry groups, and with SCTR scores above 90, preferably 95. You'll find many of those stocks in our 4 portfolios. One such stock is Peloton (PTON). It remains a very strong stock that likely suffered the past 7-10 days due to October options. I typically like to buy strong stocks on their 20 day EMA tests and that's what we've seen here:
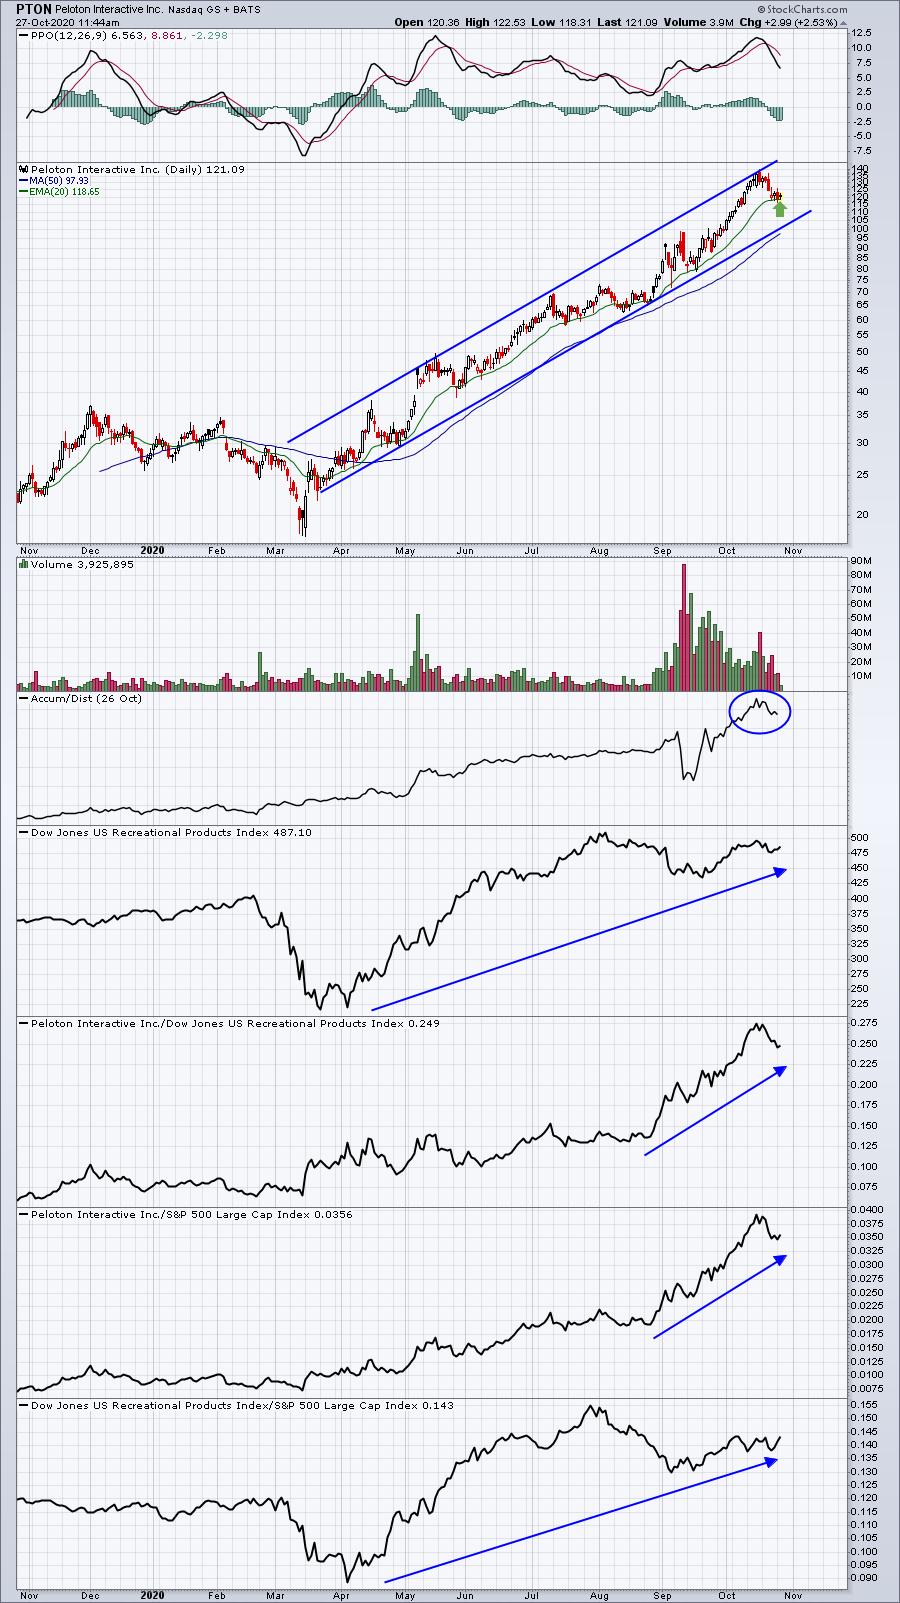
Failure at the 20 day EMA could lead to a channel test closer to 100. Eventually, this channel WILL break. No stock can go long-term with an upwardly-sloping channel like this one. It will become overpriced and there will be a more extended period of consolidation. But it may not happen this quarter.
(Disclosure: I own shares of PTON)
Earnings Reports
Here are the key earnings reports for the next two days, featuring stocks with market caps of more than $10 billion. I also include a few select companies with market caps below $10 billion. Finally, any portfolio stocks that will be reporting results are highlighted in BOLD. If you decide to hold a stock into earnings, please understand the significant short-term risk that you are taking. Please be sure to check for earnings dates for any companies you own or are considering owning.
Tuesday, October 27:
MSFT, PFE, MRK, NVS, LLY, MMM, RTX, AMD, CAT, SPGI, FISV, SHW, ECL, CB, BP, ROP, CNC, DXCM, CMI, CSGP, MSCI, SWK, GLW, AFL, DTE, ODFL, EIX, FTV, MKTX, LH, MXIM, EQR, AKAM, QSR, TRU, VAR, IEX, WAT, OKE, CHRW, MASI, ENPH, PPD, BXP, BEN, OMC, FSLR, HUBB, JNPR, SWI, MKSI, PII, LSCC, NEO, HOG, XRX, UNM, TENB, JBLU, CROX, APAM, FEYE, TWOU, SHOO, AUDC, SYX
Wednesday, October 28:
V, MA, UPS, AMGN, NOW, BA, SNE, GSK, ANTM, GILD, EQIX, GE, ADP, NSC, CME, BSX, GD, CTSH, EPD, EBAY, TEL, ORLY, F, PINS, KLAC, TT, WCN, FCAU, WELL, CERN, ETR, YUMC, FMX, AVB, AMP, ROL, GRMN, AEM, YNDX, SU, TDOC, SSNC, ETSY, INVH, DRE, AVTR, MAS, MKL, LVGO, PKI, TW, MAA, URI, GNRC, ESS, VICI, WDC, MOH, DT, CGNX, HES, FBHS, ARES, RDY, PEGA, PTC, NLY, CONE, CREE, FSLY, OC, GRUB, SEE, TXRH, FVRR, SLAB, ALSN, INOV, ASGN, TMHC, SPWR, WERN, R, SFM, FORM, EAT, EGHT, CCS, MHO, TUP, FRTA, UCTT, ERJ, QNST, GNMK, PI, EXTR
Economic Reports
September durable goods: +1.9% (actual) vs. +0.4% (estimate)
September durable goods ex-transports: +0.8% (actual) vs. +0.4% (estimate)
August Case-Shiller house price index: +0.5% (actual) vs. +0.4% (estimate)
August FHFA house price index: +1.5% (actual) vs. +0.7% (estimate)
October consumer confidence: 100.9 (actual) vs. 102.0 (estimate)
Happy trading!
Tom