
EB Daily Market Report - Wednesday, October 28, 2020
Executive Market Summary
- Futures were weak overnight and never wavered as we opened lower across-the-board
- European markets seemed to kickstart the selling as the German DAX ($DAX) fell more than 4%
- The 10 year treasury yield ($TNX) has dipped 2 basis points to 0.76%
- The Volatility Index ($VIX, +20.27%) is above 40, historically a very high level, so fear is driving market action
- The U.S. Dollar (UUP) has gained ground, putting downward pressure on commodities, even gold ($GOLD, -1.67%), which typically performs well when fear levels rise
- All 11 sectors are down more than 2%, so the selling is rather indiscriminate
- Technology (XLK, -3.80%) and communication services (XLC, -3.61%) are today's biggest losers
- Real estate (XLRE, -2.24%) and utilities (XLU, -2.44%) - two defensive groups - are performing better on a relative basis
- The S&P 500's worst performers are DexCom (DXCM, -11.34%), CH Robinson (CHRW, -9.93%), and Akamai Technologies (AKAM, -9.44%); they're all down after reporting quarterly results
- Barring an afternoon reversal, the spiking VIX suggests caution, especially if S&P 500 price support at 3225 is lost in coming days
Market Outlook
You wouldn't know we were starting a bullish historical period today by looking at the action during the first 90 minutes. It's been a bloodbath. The Volatility Index ($VIX) has spiked 15% and was trading at 38.37 at last check. During the September sentiment-related selloff, we saw the VIX hit 38.28. Today's VIX high was 40.52. Intense fear can cause major short-term selloffs and we're certainly susceptible to that right now. I can talk secular bull market all day, but when fear grips the market, the selling can be violent. After the June selling, the VIX hit a high of 44.44. If the VIX closes below 35 today, leaving a long tail to the upside, then I believe the worst of the selling is over. If the VIX remains in the upper-30s or even finishes in the 40s, then we're likely to see more short-term downside. Tops in the VIX mark significant bottoms in the S&P 500. There's no doubt we're heading for a major bottom in the S&P 500, in my opinion, but the question is how far do we fall first? Today's finish will provide us an initial clue.
Here's the VIX chart that illustrates the importance of VIX tops:
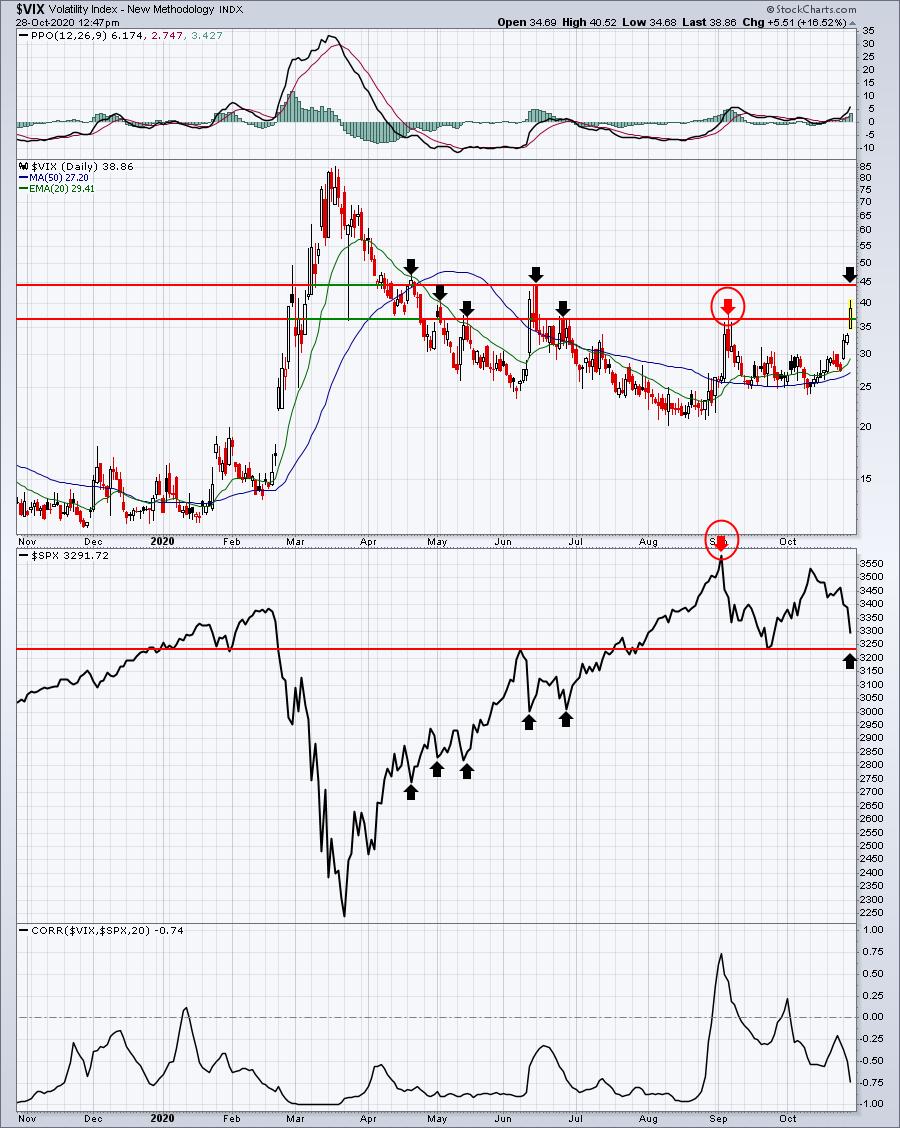
Those black arrows marking VIX tops between 35-45 have been very accurate in also marking S&P 500 bottoms. And we're nearing 40 today, so it's probable that we're about to mark a key bottom. If the VIX breaks above 45 and the S&P 500 closes beneath 3225, I'll exit my positions. I do not take chances when key price support is lost with an inordinate amount of fear. I just recently built my positions up again, but I don't ignore the warning signs of a breakdown with an extremely high VIX reading.
Tread carefully if you're long. If you're still waiting to enter, it makes sense to remain right where you are for now.
Sector/Industry Focus
I am now watching my Pandemic Index daily. I've created it using the User-Defined Index feature here at StockCharts.com. The value each day is derived by looking at the 10 hardest hit industry groups from back in March and following their progress on a daily basis. My thought process is that when these groups break out, it's a Wall Street signal that the virus impact is likely over. It's still too early to make that call based on this chart:
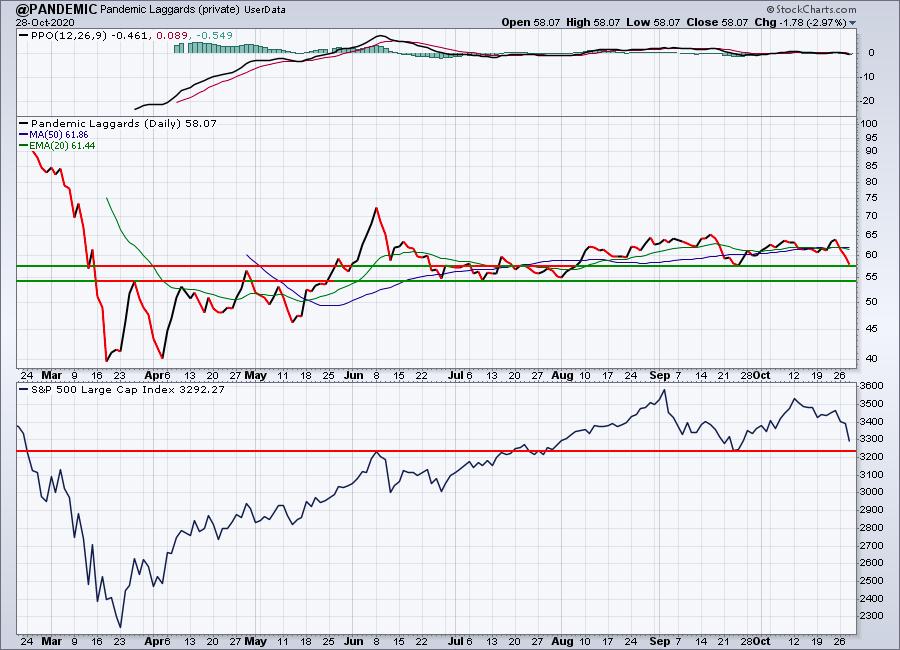
The June high is the most important level on this chart. That represents the initial reaction high when Wall Street rotated towards those fear-stricken areas. Once that rotating money dried up, it's been a big-time struggle. A break beneath the September lows would be bearish for these areas, along with the S&P 500, if our benchmark fails to hold 3225 (3209 intraday).
ChartLists/Strategies
There is no point in trying to trade right now, not with the VIX threatening a major breakout and our major indices under intense pressure. The stock market is not rationale when the VIX is rising and at current levels. While I firmly believe that we remain in a secular bull market, that doesn't mean squat when fear takes over the market in the near-term. We have to let this fear play out. Maybe that means later today. Maybe that means tomorrow. Maybe that means next week. I won't grow more bullish until we see a big reversal in the VIX and our major indices. At last check, at 1:30pm ET, that was not happening.
Earnings Reports
Here are the key earnings reports for the next two days, featuring stocks with market caps of more than $10 billion. I also include a few select companies with market caps below $10 billion. Finally, any portfolio stocks that will be reporting results are highlighted in BOLD. If you decide to hold a stock into earnings, please understand the significant short-term risk that you are taking. Please be sure to check for earnings dates for any companies you own or are considering owning.
Wednesday, October 28:
V, MA, UPS, AMGN, NOW, BA, SNE, GSK, ANTM, GILD, EQIX, GE, ADP, NSC, CME, BSX, GD, CTSH, EPD, EBAY, TEL, ORLY, F, PINS, KLAC, TT, WCN, FCAU, WELL, CERN, ETR, YUMC, FMX, AVB, AMP, ROL, GRMN, AEM, YNDX, SU, TDOC, SSNC, ETSY, INVH, DRE, AVTR, MAS, MKL, LVGO, PKI, TW, MAA, URI, GNRC, ESS, VICI, WDC, MOH, DT, CGNX, HES, FBHS, ARES, RDY, PEGA, PTC, NLY, CONE, CREE, FSLY, OC, GRUB, SEE, TXRH, FVRR, SLAB, ALSN, INOV, ASGN, TMHC, SPWR, WERN, R, SFM, FORM, EAT, EGHT, CCS, MHO, TUP, FRTA, UCTT, ERJ, QNST, GNMK, PI, EXTR
Thursday, October 29:
AAPL, AMZN, GOOGL, FB, CMCSA, SHOP, SNY, BUD, AMT, SBUX, RDS.A, FIS, SYK, SO, ATVI, MMC, VRTX, ICE, SPOT, GPN, MCO, NEM, ILMN, DD, DLR, BAX, KDP, TRP, TWTR, XEL, KHC, IDXX, CVNA, SGEN, TROW, COP, YUM, MSI, CARR, ADM, MRNA, TEAM, APTV, ALXN, WLTW, RMD, AME, NOK, CHD, K, AJG, FTNT, PCG, CMS, IP, BIO, TFX, XYL, MLM, ATUS, STNE, CBRE, MPWR, HIG, RCL, ABMD, ZEN, ACGL, NVCR, EMN, WAB, CRL, CCC, QDEL, DVA, MGM, ERIE, PENN, FIVN, OLED, WU, PWR, DNKN, DECK, IPHI, TPR, RL, SKX, TPX, BAND, AAN, LPSN, DVN, SHAK, OSTK, APPS, BE, FLWS, KN, CAKE, VCRA,
Economic Reports
September wholesale inventories: -0.1% (actual) vs. +0.1% (estimate)
Happy trading!
Tom