
EB Daily Market Report - Thursday, October 29, 2020
Executive Market Summary
- Futures were volatile overnight and this morning, but we did manage to avoid heavy losses at the open
- The NASDAQ has regained its leadership role
- The recent uptrend in the IWF:IWD ratio (growth vs. value) is intact as well, good news for stock market bulls
- The 10-year treasury yield ($TNX) has surged 6 basis points as money rotates from bonds to equities
- The first estimate of Q3 GDP came in above 33%, beating consensus estimates and likely driving bond traders to equities
- Pinterest (PINS) blew out Q3 results and is up 28% currently, helping to boost internets ($DJUSNS) and technology (XLK) stocks
- Communication services (XLC, +3.23%) is the best performing sector, lifted by media agencies ($DJUSAV, +15.65%)
- All 11 sectors are higher, even energy (XLE, +2.63%), despite crude oil prices ($WTIC, -3.10%) dropping to $36 per barrel
Market Outlook
Yesterday, I featured a daily chart of the Volatility Index ($VIX), but this is a very important measure of sentiment that has a long history of calling market bottoms - both long-term and short-term. We've seen the VIX spike to the 80-90 range on only two occasions. The first was during the financial crisis in 2008 and the other was earlier this year as we suffered through the biggest pandemic in 100 years. Those were extremes that I would not be expecting on a regular basis. The VIX only dates back to the early-1990s, but my guess is that we might have seen a similar VIX reading during the 1987 crash. I'd also have expected the VIX to have soared during the 1970s with Watergate and the oil embargo. That was the last secular bear market before the 2000-2012 version.
Secondary and significant market lows, however, are normally felt when the VIX hits 40-45. Many short-term pullbacks will see the VIX reach maybe 30 or so. Those are the three "levels" of fear that I tend to watch. Here's a longer-term 35-year weekly chart to help illustrate all of this:
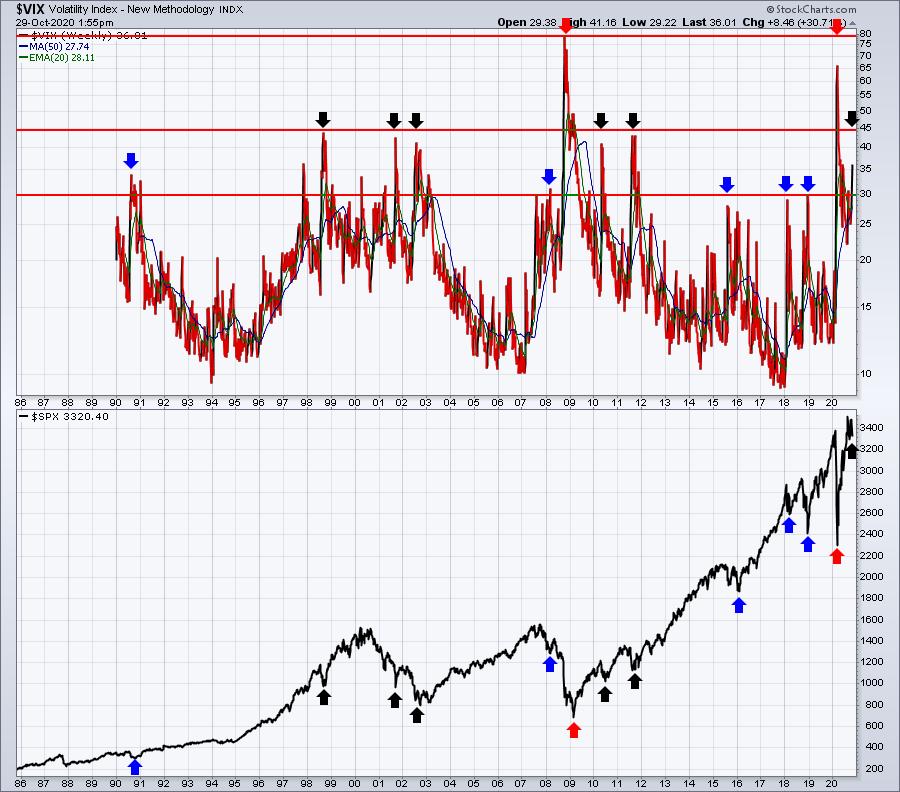
I've color-coded the arrows to provide you the degrees of importance of each. There are only two RED arrows (VIX testing 80-90). They're biggies. When the VIX reaches ridiculous levels, the stock market is throwing the kitchen sink in. Major bottoms never to be tested again are formed. I believe that's what happened in March 2020. I do not believe we will ever again in our lifetimes see that level. In fact, if we do, I say it will be during this pandemic. I suspect we'd have to see the virus mutate in a very dangerous way that saw the IFR (infection fatality rate) spike significantly. I think it's incredibly important that the VIX today spiked above 41. That's an incredibly high level historically. It tells us that there is a ton of fear built in ALREADY to current stock prices. If the S&P 500 loses 3200-3225 support, we need to be very careful for sure. But absent that, I could see the stock market soar from here as fear subsides in coming months.
Back to that chart above. The BLACK arrows (VIX testing 45) occur a bit more frequently, but still tend to mark very important lows. The BLUE arrows (VIX testing 30) occur much more often than the RED or BLACK arrows. Therefore, while important, you'll see prices later dip lower. I would not necessarily rely on those market lows to hold on future tests, though in a secular bull market, most will.
Sector/Industry Focus
The consumer staples sector (XLP) is rebounding nicely with a possible hammer forming at a key price support level:
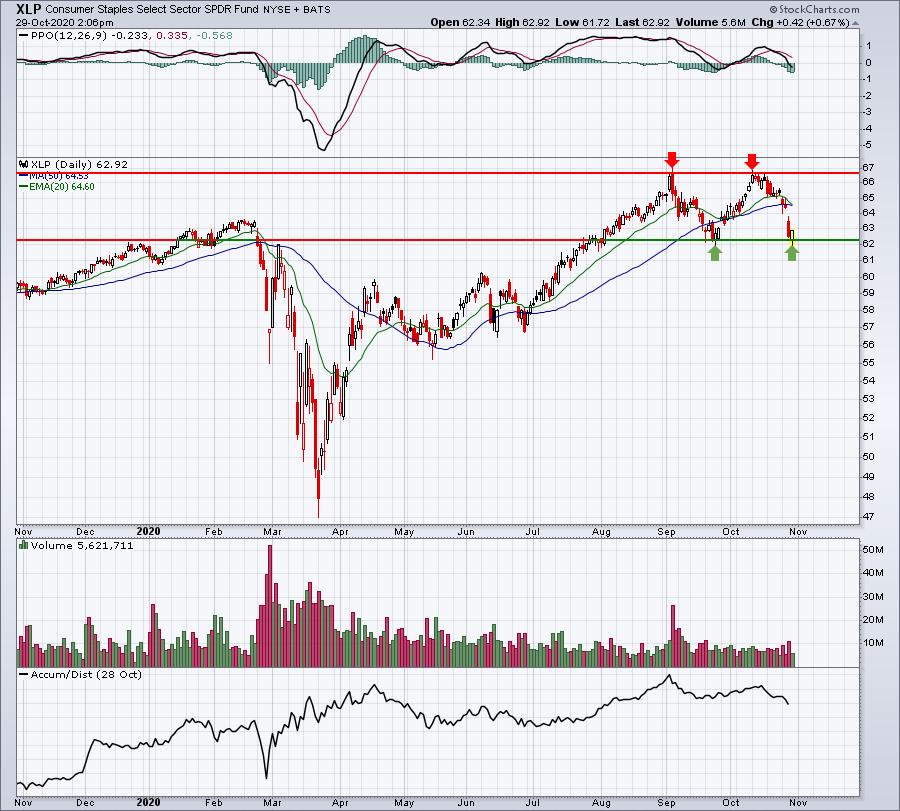
I very much prefer discretionary stocks (XLY) over staples stocks (XLP) in the consumer space, but this is still a great chart to show a major reversal at critical price support. With a double top, and now potentially a double bottom in place, a distinct trading range has clearly formed. It will be important to see which level breaks first. Should the secular bull market resume, as I suspect it will, I'd be looking for support in the 62.00-62.25 area to hold.
ChartLists/Strategies
I'm still watching today's action very closely. It definitely appears as though today's action is the real deal. Yesterday's selling mostly took place in the first 60 minutes. The recovery has been swift and we're now back at yesterday's open on the SPY (ETF that tracks the S&P 500):
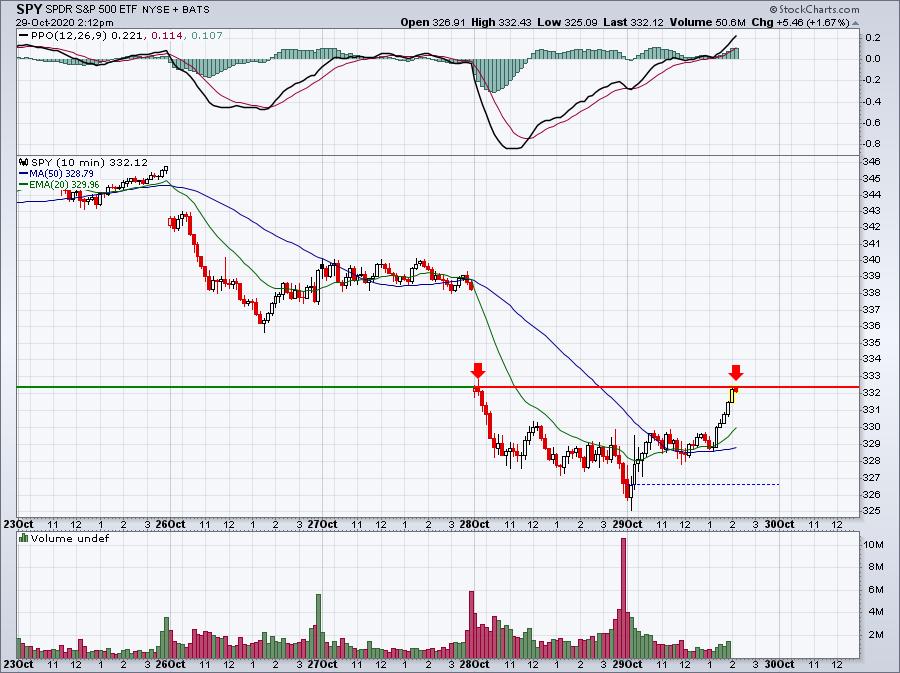
This looks strikingly familiar to March, where we had HUGE gap downs, but there was more intraday buying, which suggested institutional accumulation. It's too early to call that again, but it's definitely something worth watching. Today's move wasn't because of a great big gap higher. It was from steady buying all day long. That's how accumulation takes place. I don't want to see, however, a big selloff into the close with the VIX soaring again.
Trading individual stocks can make sense for those willing to take on risk, but please remember the hourly charts of the $SPX and $NDX that I've included in DMRs of late. They still show us in a downtrend. Right now, the S&P 500 is in a fairly wide range from 3200-3425. It's going to be very important technically to see which way we break. Because I'm bullish, I believe we'll see it break higher, but I ALWAYS respect a VIX in the 30s and 40s, and that's still what we have to deal with.
Aggressive traders could buy stocks now, but it might be necessary to sell quickly and take losses if the VIX becomes an issue again, and especially if we see the S&P 500 break down below 3200.
Earnings Reports
Here are the key earnings reports for the next two days, featuring stocks with market caps of more than $10 billion. I also include a few select companies with market caps below $10 billion. Finally, any portfolio stocks that will be reporting results are highlighted in BOLD. If you decide to hold a stock into earnings, please understand the significant short-term risk that you are taking. Please be sure to check for earnings dates for any companies you own or are considering owning.
Thursday, October 29:
AAPL, AMZN, GOOGL, FB, CMCSA, SHOP, SNY, BUD, AMT, SBUX, RDS.A, FIS, SYK, SO, ATVI, MMC, VRTX, ICE, SPOT, GPN, MCO, NEM, ILMN, DD, DLR, BAX, KDP, TRP, TWTR, XEL, KHC, IDXX, CVNA, SGEN, TROW, COP, YUM, MSI, CARR, ADM, MRNA, TEAM, APTV, ALXN, WLTW, RMD, AME, NOK, CHD, K, AJG, FTNT, PCG, CMS, IP, BIO, TFX, XYL, MLM, ATUS, STNE, CBRE, MPWR, HIG, RCL, ABMD, ZEN, ACGL, NVCR, EMN, WAB, CRL, CCC, QDEL, DVA, MGM, ERIE, PENN, FIVN, OLED, WU, PWR, DNKN, DECK, IPHI, TPR, RL, SKX, TPX, BAND, AAN, LPSN, DVN, SHAK, OSTK, APPS, BE, FLWS, KN, CAKE, VCRA
Friday, October 30:
ABBV, XOM, CVX, CHTR, HON, MO, CL, AON, LHX, PEG, CHT, LYB, WY, PSX, KKR, FTS, BR, WPC, IPGP, BAH, PNW, CBOE, LEA, NWL, UAA, FLIR
Economic Reports
Q3 GDP (initial estimate): +33.1% (actual) vs. +30.9% (estimate)
Initial jobless claims: 751,000 (actual) vs. 758,000 (estimate)
September pending home sales: -2.2% (actual) vs. +3.5% (estimate)
Happy trading!
Tom