
EB Daily Market Report - Monday, November 2, 2020
Strong Earnings ChartList updated
I finalized the latest update to our Strong Earnings ChartList (SECL) earlier this afternoon. You should now be able to download it from our website and into your StockCharts.com account, assuming you are at least an Extra or Pro member. Otherwise, you can view all of these annotated charts.
I will look to have an updated Strong Future Earnings ChartList out tomorrow.
Executive Market Summary
- Futures were solid overnight and U.S. equities got off to a strong start
- Leadership has once again been found OUTSIDE the NASDAQ and NASDAQ 100, however
- Growth vs. value (IWF:IWD) is tumbling for a second straight day; more on that below in the Sector section
- Clorox (CLX, +5.11%) posted excellent results and is being rewarded - at least for a day
- Energy (XLE, +4.28%) and materials (XLB, +3.39%) are scorching hot today, while communication services (XLC, -0.25%) and technology (XLK, -0.07%) are failing to participate
- Broadline retail ($DJUSRB, -1.44%) is approaching multi-month support in the 2900-3000 zone as Amazon.com (AMZN, -2.00%) weighs on the industry
- Twitter (TWTR, -4.97%) is struggling mightily for a second straight day after reporting earnings last week
- Honeywell (HON, +5.43%) is surging to lead the Dow Jones higher as it's up 400 points heading into the final hour
Market Outlook
As we approach Election Day tomorrow, let's look at the relative strength/weakness of our 11 sectors. The first chart will feature the 5 aggressive sectors (XLK, XLY, XLC, XLI, XLF), while the second will feature the defensive sectors plus energy and materials (XLV, XLP, XLRE, XLU, XLE, XLB). Here are the two charts:
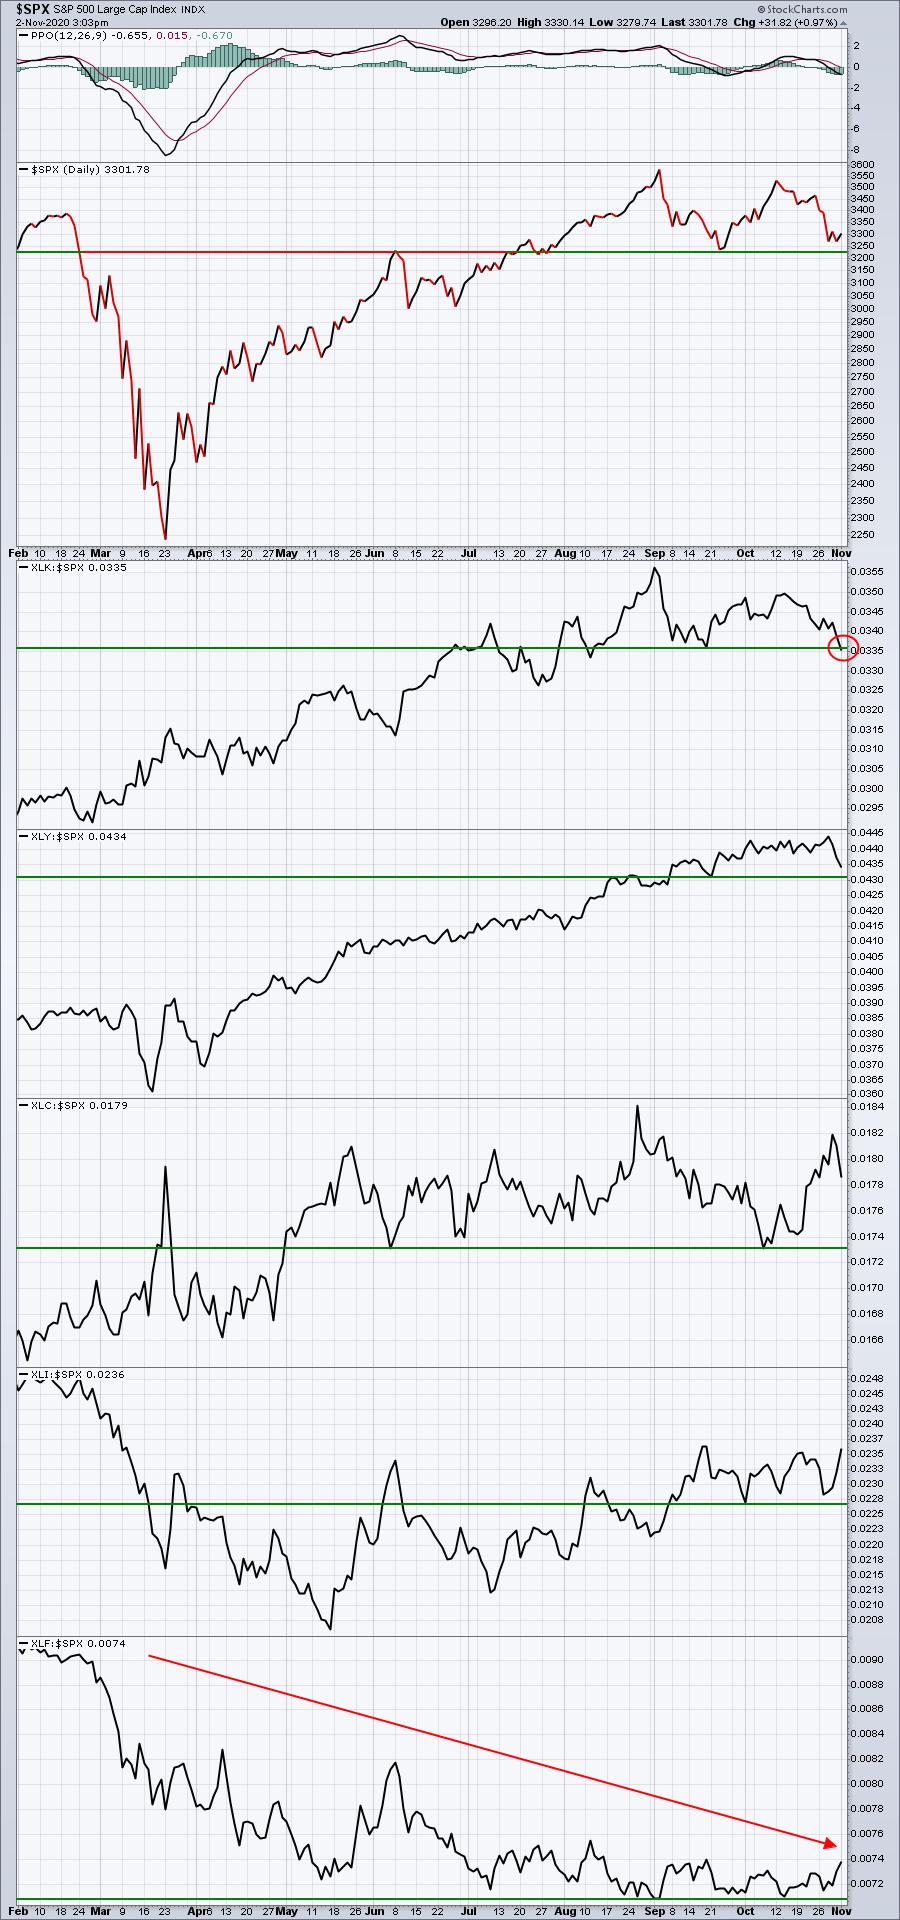
I look at this chart and it's easy for me to remain bullish. Technology (XLK) has broken slightly below its September relative low, which is certainly something to keep an eye on. Financials (XLF) have been downtrending for quite awhile, which is also a negative. But overall, these aggressive groups continue to trend higher on a relative basis, which typically suggests that a bull market rally is sustainable.
Here are the remaining sectors on a relative basis:
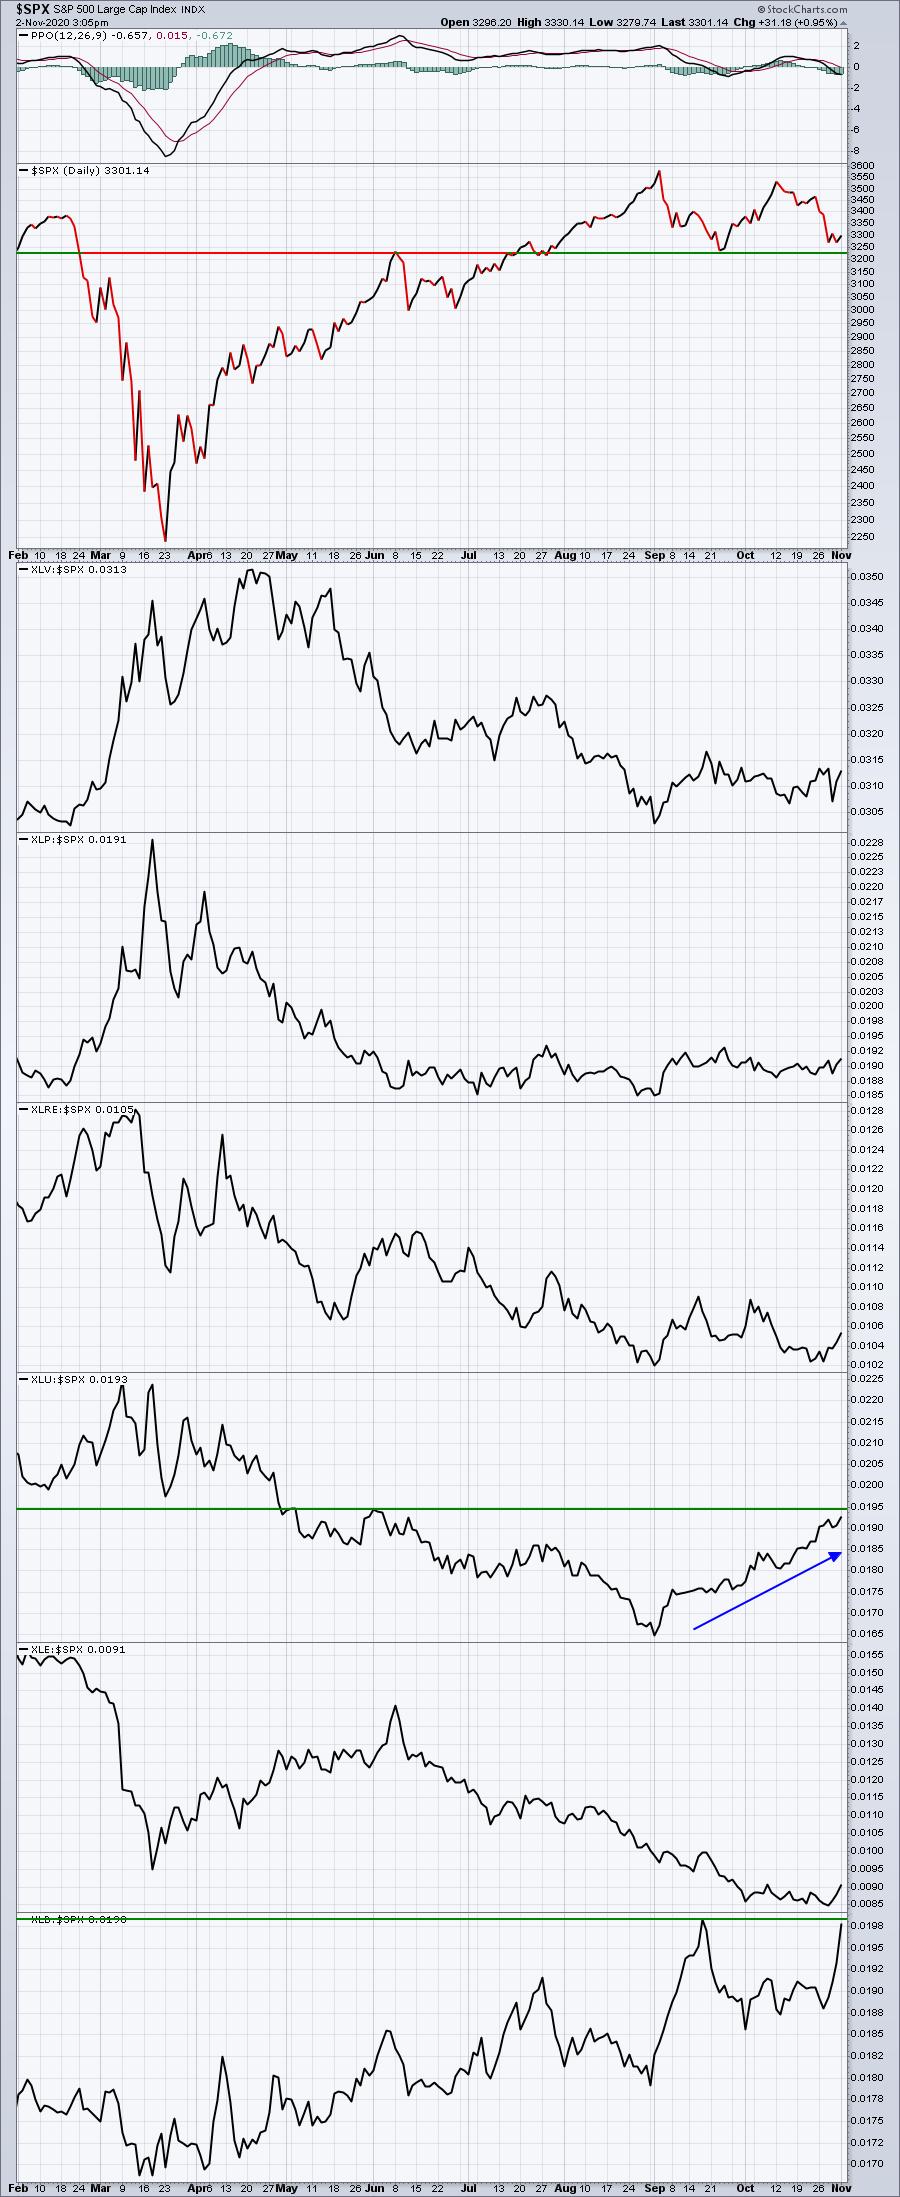
Materials (XLB) are nearing a relative breakout, but energy and materials do not threaten a bull market rally. They tend to outperform or underperform based on the underlying strength or weakness in the U.S. Dollar ($USD), which is why both the XLE and XLB have been downtrending vs. the S&P 500 since 2011. The USD has been strong throughout much of the past decade.
Utilities (XLU) are a tad concerning as they begin to show relative strength. However, we've been consolidating on the S&P 500, and relative strength in defensive groups during periods of consolidation is fairly normal. I'd grow much more concerned about this rally if we break to new highs in coming weeks on the S&P 500 and the XLU maintains its relative strength. It's way too early to worry about the recent relative strength in the XLU.
Sector/Industry Focus
One thing is for certain. Growth stocks (IWF) have completely been shunned the past two trading days, with Wall Street instead opting for value stocks (IWD). Through Thursday's close last week, all was well with growth stocks. Clearly, however, the market changed its mind on Friday and hasn't let up today, as the following IWF:IWD ratio can attest:
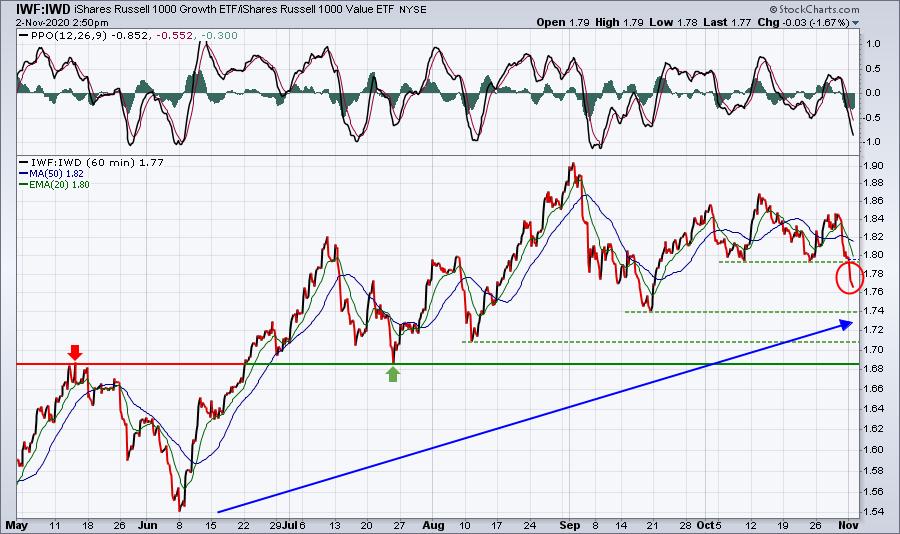
This shows how difficult it can be short-term to trade. Not only do we have to try to figure out whether the market will go up or down, but we also need to figure out whether growth or value stocks are the better choice. The closer this ratio gets to 1.69, the better the reward to risk becomes in entering growth stocks. If we see a definitive breakdown beneath 1.69, I will absolutely put my foot on the brakes on growth stocks and re-evaluate our approach.
ChartLists/Strategies
I am looking for downtrend reversals now that we've seen quite a bit of selling to end October and open November. After updating the Strong Earnings ChartList (SECL), I ran the Downtrend Reversal scan on our website against it to see how many stocks were returned. Initially, there were 46. I further filtered the list, using a minimum SCTR score of 80. Here were the scan results:
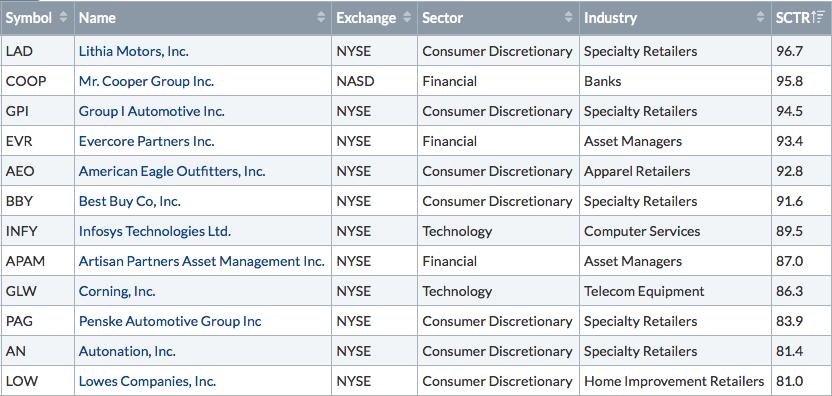
Of these 12, 7 are consumer discretionary names, which I prefer. GPI, PAG, and AN are three that stand out to me, because you can keep fairly tight stops beneath Friday's lows. AN is one that I bought where I'm keeping an intraday stop below 56. The biggest risk is holding overnight and the market gapping lower. AN reported very strong quarterly results (revenues: $5.40 bil vs. $5.22 bil, EPS: $2.38 vs. $1.63). After printing lower highs for 7 straight days, it printed a higher high today. It could just be temporary, but I decided to take a chance without risking but 1% or so. Again, a big overnight selloff could result in a larger loss. Here's the current chart:
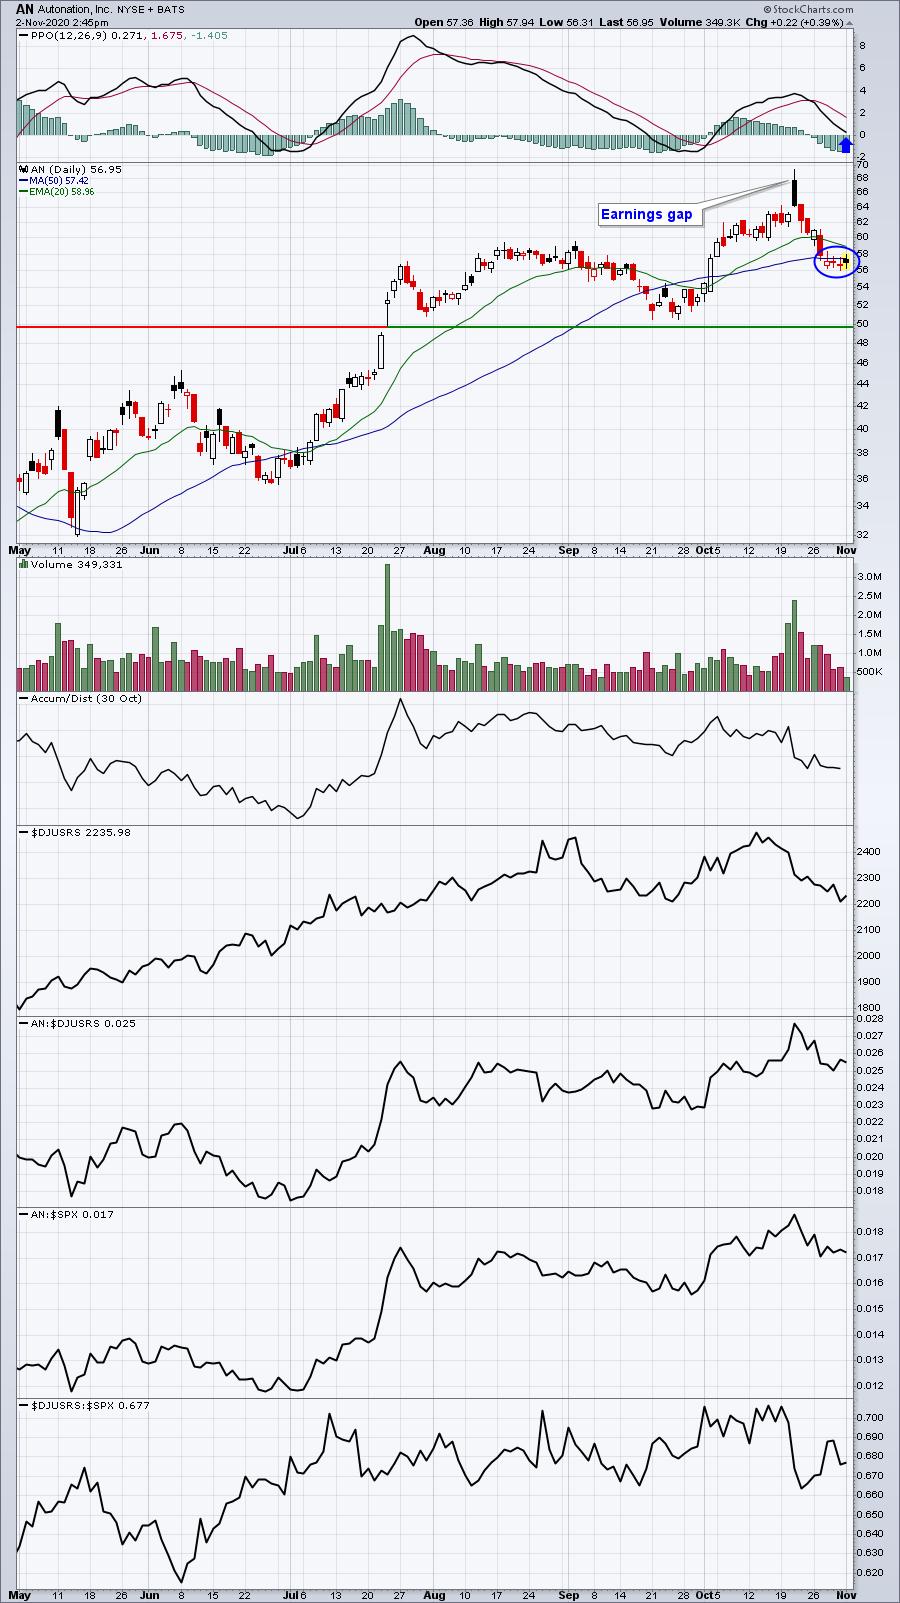
AN is hovering near its 50 day SMA and it's trading down 11 bucks from where it was 8 trading days ago. I like the reward to risk at the current price, but much of this trade's success will depend on overall market conditions. Tomorrow is Election Day - I realize the volatility could be extremely high, so this isn't a big position.
Earnings Reports
Here are the key earnings reports for the next two days, featuring stocks with market caps of more than $10 billion. I also include a few select companies with market caps below $10 billion. Finally, any portfolio stocks that will be reporting results are highlighted in BOLD. If you decide to hold a stock into earnings, please understand the significant short-term risk that you are taking. Please be sure to check for earnings dates for any companies you own or are considering owning.
Monday, November 2:
PYPL, EL, MDLZ, WM, SBAC, CLX, SWKS, WMB, NTR, O, MPC, MPLX, FE, CDW, HZNP, ANET, STE, IR, PEAK, LNT, FMC, SEDG, LDOS, ON, NI, HSIC, TREX, JAZZ, CNA, IAA, AIZ, MOS, G, LITE, VNO, CRUS, WING, JCOM, NSP, MIME, CWH, FN, CDLX, VCYT, MED, AMCX, EVER
Tuesday, November 3:
HUM, ETN, EXC, TRI, EMR, RACE, WEC, JCI, ES, SYY, PRU, W, MCK, ZBRA, FOXA, EXPD, CTLT, IT, WTRG, WLK, BHC, BLD, MRCY, LPX, GWPH, LGIH, BMCH, VSH, SPR, KAR
Economic Reports
October PMI manufacturing: 53.4 (actual) vs. 53.3 (estimate)
October ISM manufacturing: 59.3 (actual) vs. 55.7 (estimate)
September construction spending: +0.3% (actual) vs. +0.9% (estimate)
Happy trading!
Tom