
EB Daily Market Report - Thursday, November 5, 2020
Executive Market Summary
- Futures were strong once again, and the NASDAQ exhibited leadership again
- A few of our major indices are approaching all-time highs after big gains this week
- The FOMC meeting ended with little changes from last month's meeting; there was no change to interest rates and no substantive wording changes
- The Fed remains very accommodative and that should bode well for U.S. equities for the foreseeable future
- Materials (XLB, +4.76%) and technology (XLK, +3.33%) are leading all 11 sectors higher
- Health care (XLV, +0.61%) is lagging and digesting Wednesday's outsized gains
- The U.S. Dollar (UUP) is threatening to close at a 2+ month low, encouraging buyers in materials
- Silver ($SILVER) and gold ($GOLD) are up 5.93% and 2.90%, respectively
- Crude oil ($WTIC), however, is not among the commodities begin bought, falling 1.38% today
- QUALCOMM (QCOM, +12.48%), one of our portfolio stocks, is helping to lead the NASDAQ higher after blowing past revenue and EPS estimates
Market Outlook
Well, historical bullishness certainly appears to have kicked in this week. This week alone, we've seen the S&P 500 break above 3300, 3400, and now 3500. The October 27th (close) to November 6th (close) period is the strongest of the year and we've seen firsthand exactly what that looks like. The question now becomes, "do we make our move to an all-time high on this advance or do we consolidate a bit longer"?
The weekly chart on the S&P 500 remains quite bullish. After temporarily failing to hang onto rising 20 week EMA support last week, we've bounced back dramatically to reclaim that key moving average:
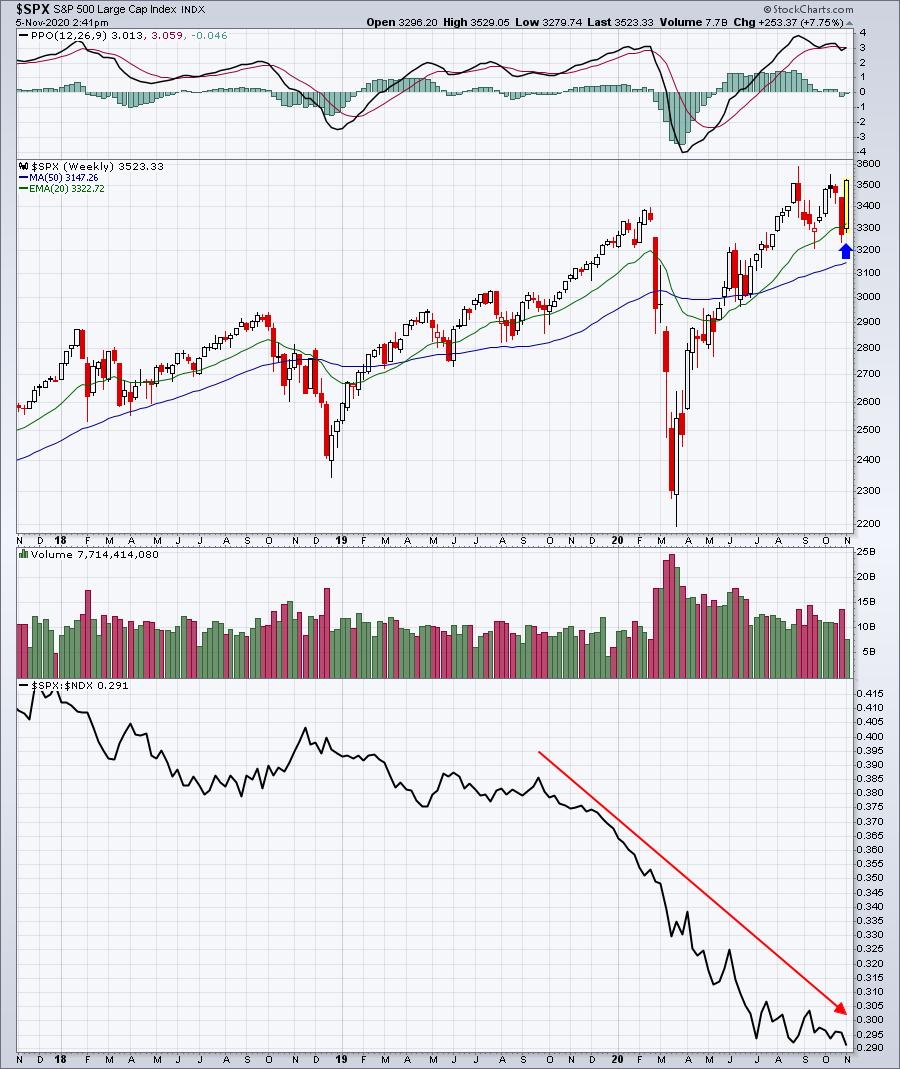
While the S&P 500's rebound has been quite impressive, we can't lose sight of the fact that the more aggressive NASDAQ 100 ($NDX) continues to outperform the SPX. At the bottom of the above chart, you can see the SPX:NDX ratio moving to a new low. That's not bad news for the S&P 500 as much as it is good news for the NASDAQ 100 (and growth stocks in general).
Sector/Industry Focus
Renewable energy ($DWCREE, +10.20%) is rebounding strongly, but I'm an a bit nervous on this surge as a negative divergence is present. If we can break out above 200 on a closing basis, then we may still have more room to run. But if we fail after an intraday breakout, I'd be somewhat careful with the group:
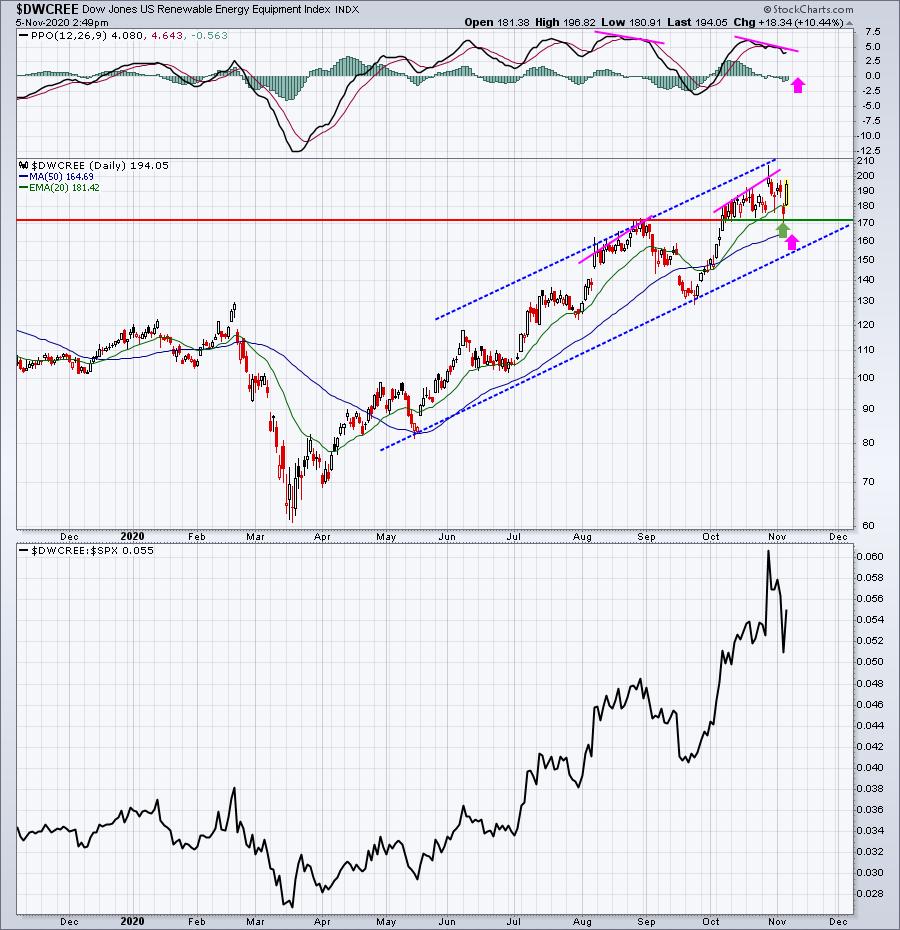
The last time we saw a negative divergence form at the beginning of September, the DWCREE corrected more than 20%. This is a volatile group, so just be aware that the risk is elevated right now. Again, if we can get that closing breakout, we could see new buyers appear. But failure to do so could result in short-term weakness.
ChartLists/Strategies
I'm in the process of updating the Raised Guidance ChartList (RGCL) and just wanted to point out that many stocks, after announcing earnings and raising guidance, eventually return to the point of their guidance-related gaps and "fill the gap". Here are two recent examples:
STM:
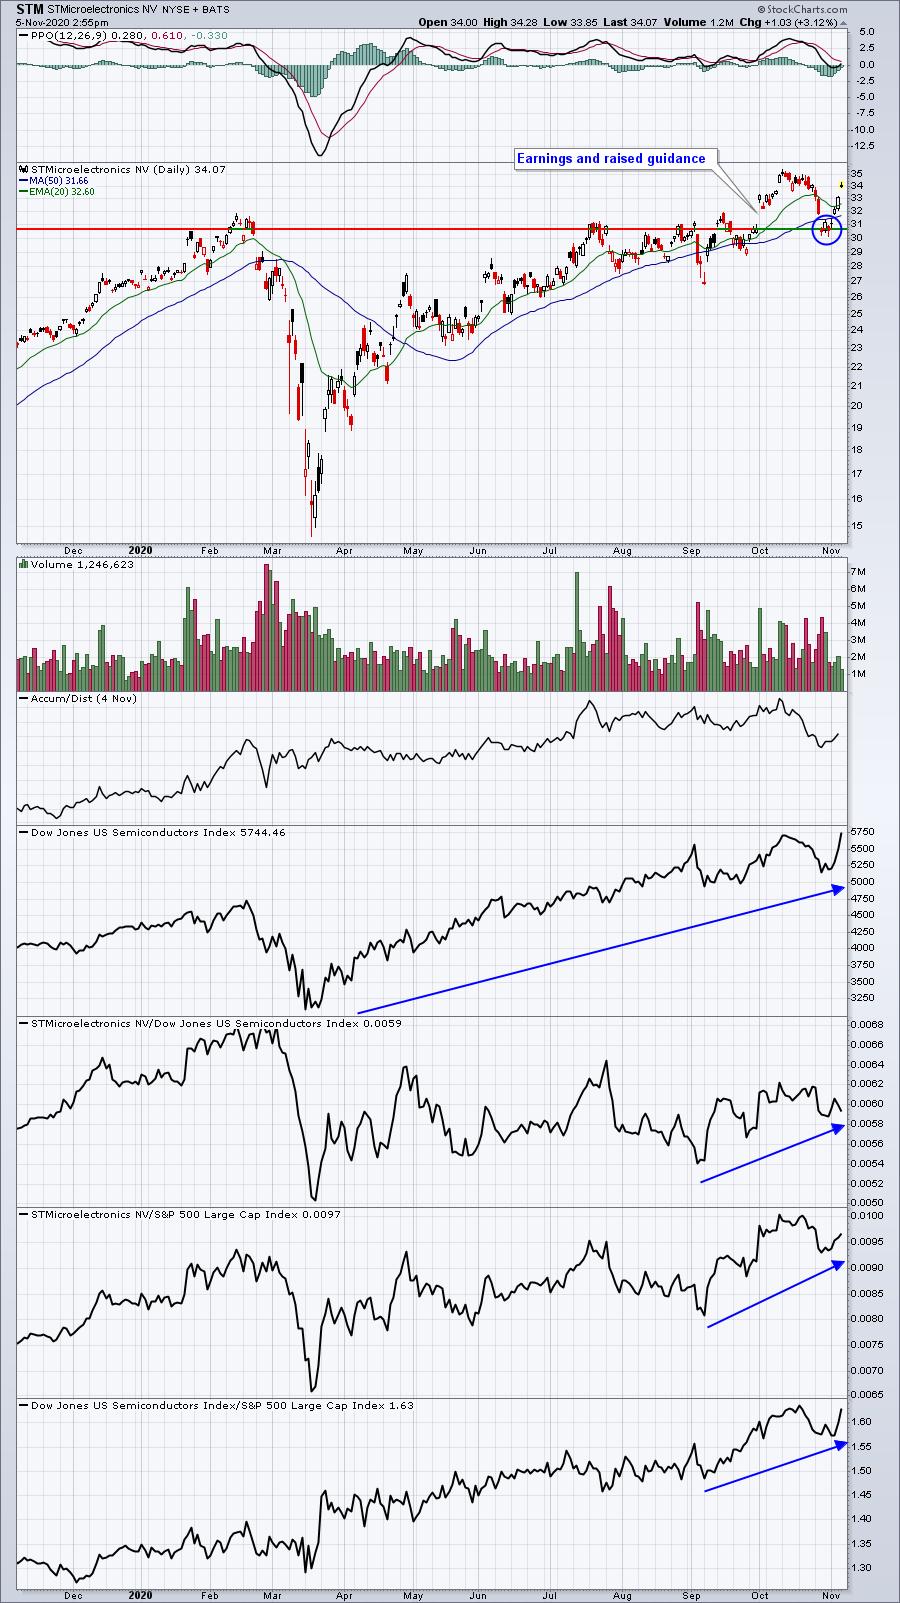
I wouldn't say that STM is the best semiconductor stock to trade, not even close, but it has been showing relative strength, and once it filled its earnings-related gap, it's been moving straight back up.
GPI:
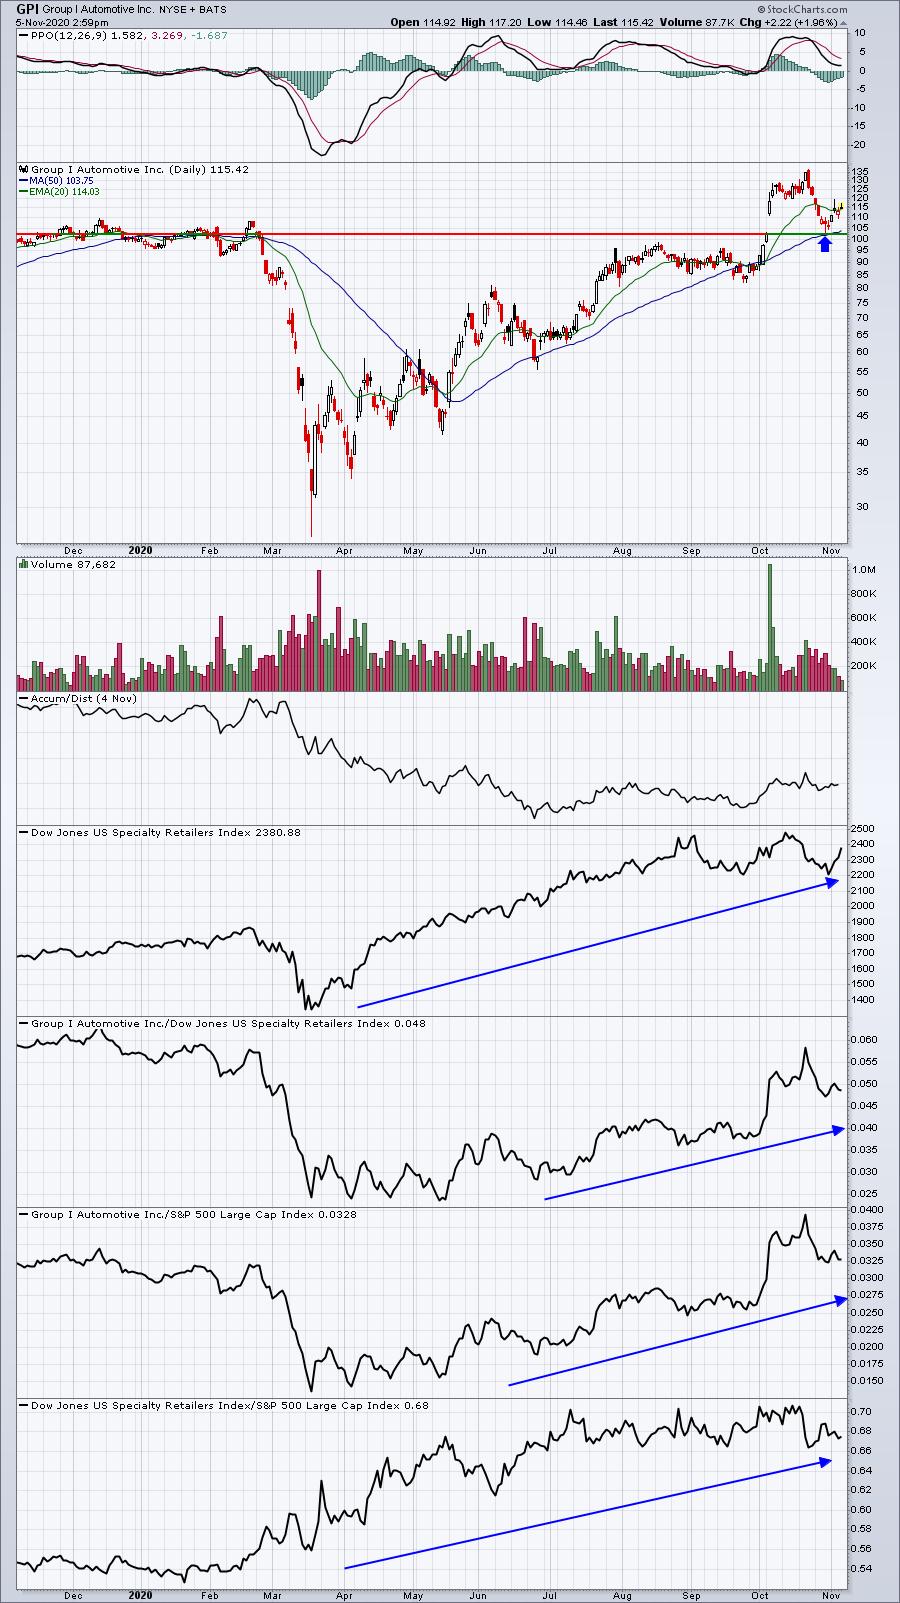
GPI did the same thing - filled its gap and then reversed. This is a great trading strategy after a company beats quarterly estimates and raises guidance. Watch the gap higher and then wait....and wait....and wait....until the reward to risk increases significantly. That's what we do for you. We establish the Raised Guidance ChartList for you to monitor as we move forward. The research is done. The organization is done. You can simply peruse the list to find stocks that meet your trading criteria/filters.
I'm hoping to have the Raised Guidance ChartList updated by tomorrow. If not tomorrow, then it should be available on Monday. I'll keep you posted.
Earnings Reports
Here are the key earnings reports for the next two days, featuring stocks with market caps of more than $10 billion. I also include a few select companies with market caps below $10 billion. Finally, any portfolio stocks that will be reporting results are highlighted in BOLD. If you decide to hold a stock into earnings, please understand the significant short-term risk that you are taking. Please be sure to check for earnings dates for any companies you own or are considering owning.
Thursday, November 5:
BABA, TMUS, BMY, AZN, LIN, ZTS, DUK, SQ, D, BDX, BKNG, CI, UBER, REGN, GM, GOLD, MNST, SRE, BCE, EA, PTON, IAC, BLL, RSG, PH, AIG, ED, MCHP, TTD, ROKU, MTD, PPL, EOG, ZG, ABC, VMC, FLT, CNQ, INCY, TTWO, EPAM, AMCR, NET, ALNY, CAH, BMRN, HUBS, EVRG, KL, NLOK, CDAY, CNP, PBA, AVLR, DNB, CNHI, LYV, SRPT, DISCA, CABO, GH, XRAY, WRK, TECH, OTEX, PCTY, TEVA, RGEN, XPO, WYNN, AYX, CZR, BILL, NWSA, IRM, AZPN, DBX, MLCO, RBA, HLT, RUN, LAMR, TNDM, AAXN, IRTC, SRCL, HBI, RP, ANGI, NVTA, PLNT, ADT, CHH, EBS, DXC, APPN, TREE, RDFN, YETI, STMP, SAIL, BLDP, SPCE, EVBG, GOOS, SWCH, AMN, SVMK, NKTR, VIAV, LAUR, VG, SYNA, TRIP, MTSI, CSOD, CARG, REGI, PGNY, TDC, MXL, TDS, EPAY, AAWW, YELP, ACMR, GLUU, ODP, GPRO, VCEL, EB, INSG
Friday, November 6:
CVS, ENB, MAR, HSY, ZBH, TU, VIAC, VTR, MGA, DISH, AES, ELAN, LNG, IEP, MYL, HRC
Economic Reports
Initial jobless claims: 751,000 (actual) vs. 745,000 (estimate)
Q3 productivity: +4.9% (actual) vs. +5.0% (estimate)
FOMC policy statement at 2:00pm ET
Happy trading!
Tom