
EB Daily Market Report - Thursday, November 12, 2020
Special Friday Webinar
We're very fortunate to have a great relationship with StockCharts.com. It's enabling us to get an encore showing from Bill Shelby, StockCharts.com's Lead Software Engineer. Bill created the scan engine at StockCharts, so he clearly understands how it works better than anyone on the planet. Bill's a good friend and has agreed to join us Friday morning for an "Advanced Scanning Strategies" webinar. I will begin the webinar at 10:00am ET, discussing recent market rotation, our ChartLists, and scanning strategies to take advantage of both. Bill will then join me at 11:00am ET and will discuss a few scanning techniques that I believe will be of interest to our membership. Bill has also agreed to answer scanning questions. This is a tremendous benefit to EarningsBeats.com members, especially those who also subscribe at StockCharts.com and use their scan engine. The room will open at approximately 9:30am ET and you can join by following this link:
https://us02web.zoom.us/j/84740830273
I hope you can join me and Bill!
Executive Market Summary
- Futures were mixed this morning as the NASDAQ kept its leadership role early
- We've seen mostly selling since the open as all major indices are negative, but the shift back towards growth remains in play
- Initial jobless claims fell unexpectedly down to near 700,000, while inflation at the consumer level (CPI) came in flat for October
- That combination has seen a big drop of 7 basis points in the 10-year treasury yield ($TNX) to 0.89%
- Financials (XLF, -2.00%) is among the worst performing sectors as banks ($DJUSBK, -2.69%) and life insurance ($DJUSIL, -3.27%) no doubt react to the falling treasury yields
- Health care providers ($DJUSHP, +0.57%) remain strong as Anthem (ANTM, +2.05%), Davita (DVA, +1.81%), Humana (HUM, +1.63%), and Unitedhealth Group (UNH, +1.47%) are among the S&P 500 Top 10
- Transports ($TRAN, -1.17%) have fallen back a bit today, but they're acting quite bullishly overall - see Market Outlook
Market Outlook
The action right now is quite confusing and I'm looking at every angle possible to try to figure out the market's next move. One thing I can tell you is that I remain bullish on a number of different fronts. Consumer stocks are behaving as though we're heading higher on our major indices and I cover that in the Sector/Industry Focus section. One other bullish development has been the action of transportation stocks ($TRAN). This group normally rallies only for one reason - a brightening economic outlook. It either takes more goods shipped or the prospects of more goods shipped to truly lift this area of stocks. Technically, the weekly chart for the TRAN is extremely bullish:
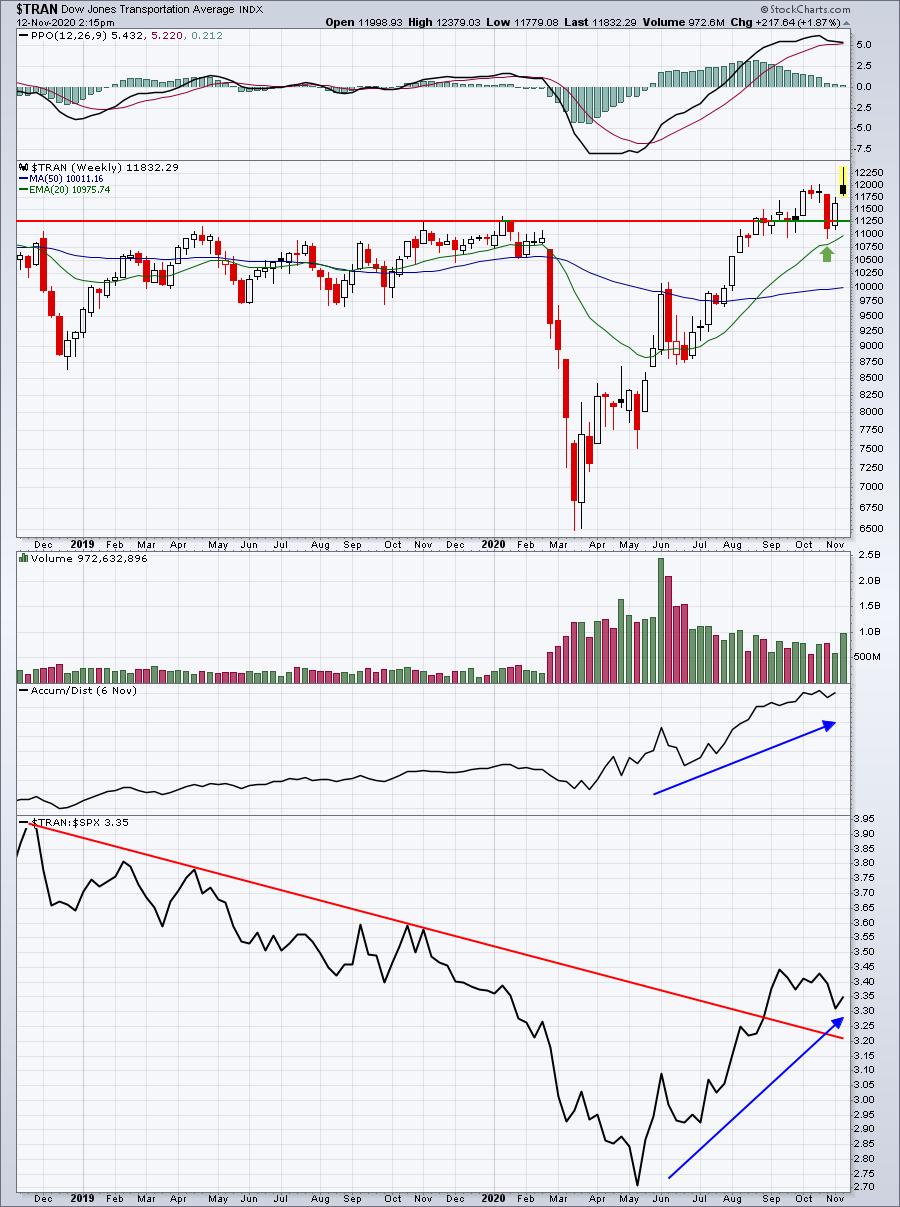
A market being led higher by transportation stocks? I'll take it every single time.
Sector/Industry Focus
One key ratio that I've been watching daily is the XLY:XLP ratio. There is a VERY strong positive correlation between the direction of this ratio and the direction of the S&P 500. The XLY:XLP ratio just printed its highest level ever at last Thursday's close:
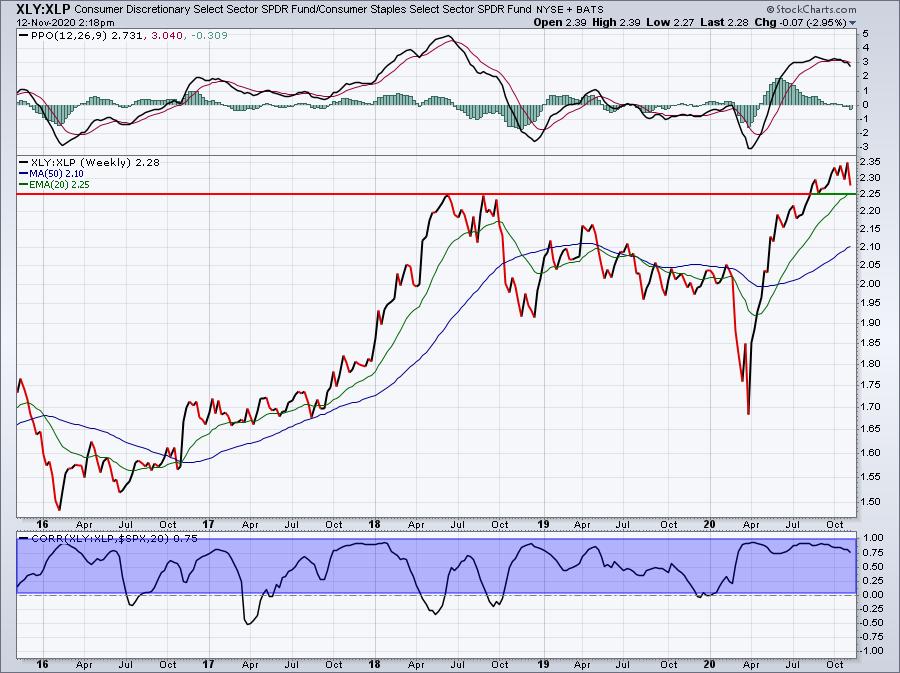
Granted, it's been dropping since the COVID-19 vaccine announcement on Monday morning, but the stock market knew this news was coming eventually. I believe we're seeing a bit of relative profit taking as traders book profits in discretionary stocks and move to a bit more conservative stance near-term.
The blue-shaded area in the bottom panel shows just how strong the positive correlation is between the XLY:XLP and the S&P 500. Therefore, if you see this ratio break out again, just realize that it represents an extremely bullish development.
ChartLists/Strategies
Given the obvious strength in transports from the weekly chart above, I thought I'd show you how to run a scan to search for transportation stock trading candidates using our ChartLists. I just updated the Strong Earnings ChartList (SECL) and the Strong Future Earnings ChartList (SFECL), so scanning for transportations stocks in those two ChartLists makes sense to me. Here's the scan syntax I used:
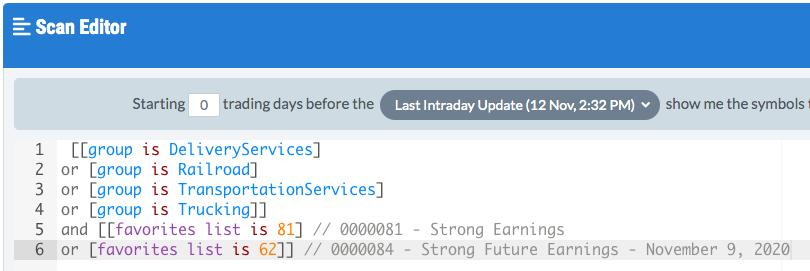
This essentially is saying that I want to see stocks that (a) are in any of the four transportation-related industry groups listed, and (b) are in one of the two ChartLists that I just updated this week. The results, in SCTR order, are as follows:
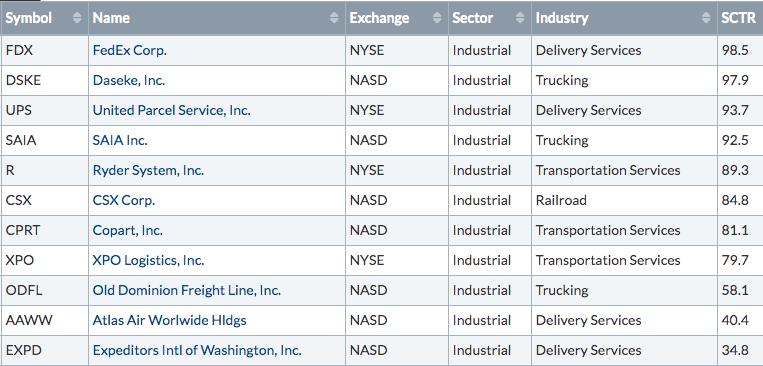
I like a number of these stocks, but let's focus on two - FDX and CPRT.
FDX:
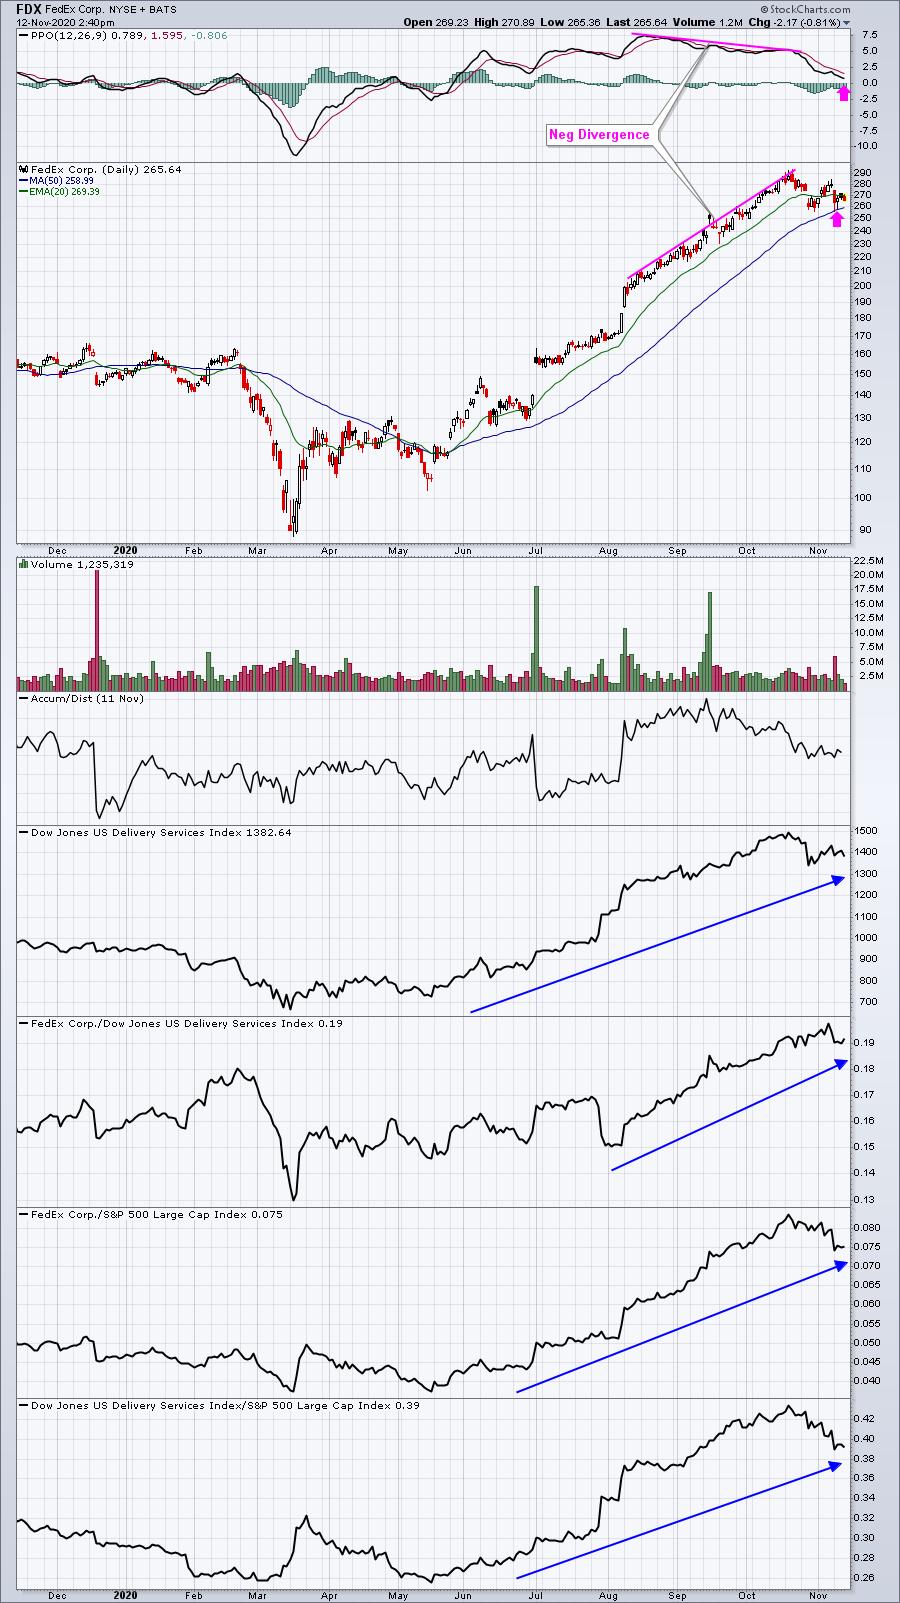
FDX has been a massive winner, but it likely got ahead of itself as its momentum weakened for weeks. Generally, a move lower to test PPO centerline support and the 50 day SMA (pink arrows) helps to unwind all that slowing momentum. I'd look for FDX to hold price support in the 258-260 area and then move higher.
CPRT:
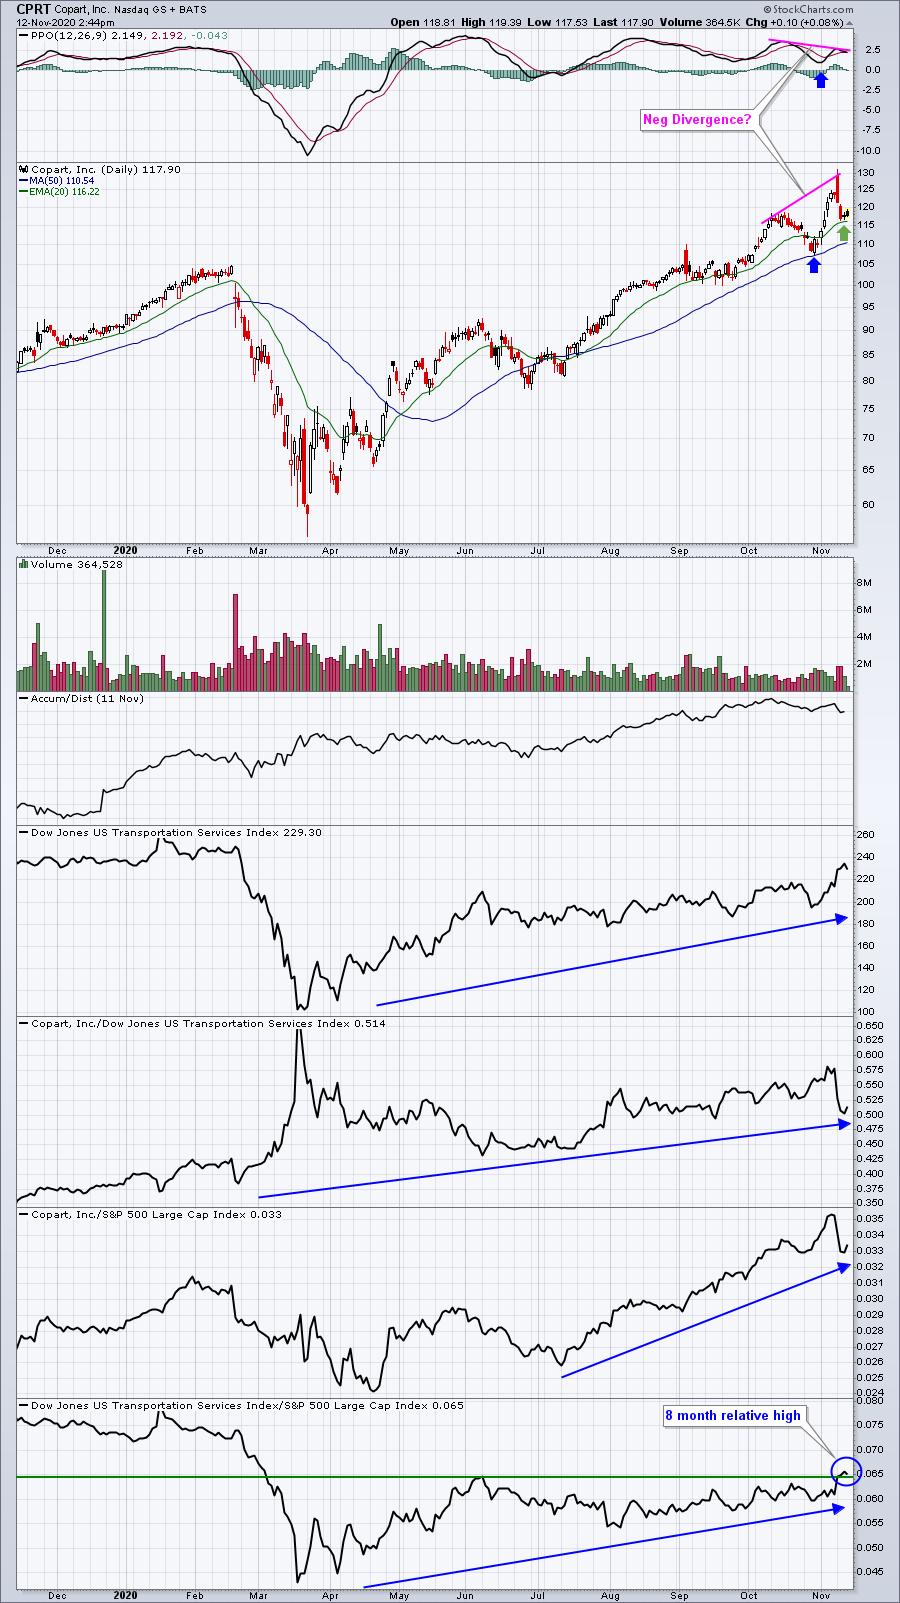
I don't view that lower PPO as a negative divergence. Why? Well, check out the blue arrows. We already had the 50 day SMA test. We've already seen deeper selling down to that moving average. I don't view this as slowing momentum any longer. Once I see a 50 day SMA test, I don't look at PPOs left of that time period. I'm only focused on the current rising PPO, suggesting to me that a 20 day EMA test is buyable. That's where we currently stand. If the 20 day EMA fails to hold on a closing basis, you can escape relatively unscathed.
Earnings Reports
Here are the key earnings reports for the next two days, featuring stocks with market caps of more than $10 billion. I also include a few select companies with market caps below $10 billion. Finally, any portfolio stocks that will be reporting results are highlighted in BOLD. If you decide to hold a stock into earnings, please understand the significant short-term risk that you are taking. Please be sure to check for earnings dates for any companies you own or are considering owning.
Thursday, November 12:
DIS, CSCO, PDD, AMAT, TDG, AMC, XPEV, PLTR, GDRX, NICE, FTCH, WIX, AQN, DLB, GLOB, ENR, TSEM, IGT, MTOR, CELH, INMD, SBH, SSYS, HIMX
Friday, November 13:
DKNG, VIPS, SPB
Economic Reports
Initial jobless claims: 709,000 (actual) vs. 757,000 (estimate)
October CPI: +0.0% (actual) vs. +0.2% (estimate)
October Core CPI: +0.0% (actual) vs. +0.2% (estimate)
Happy trading!
Tom