
EB Daily Market Report - Tuesday, November 17, 2020
Announcements
First, the Strong Earnings ChartList (SECL), Strong Future Earnings ChartList (SFECL), and Strong AD ChartList (SADCL) have all been updated over the past week or so. You can check our website to see if you have the latest versions. If not, and you're an Extra or Pro member at StockCharts.com, you can download these ChartLists directly into your StockCharts.com account. It's a lot of continuing research of ours that you can download into your account and it's a big time saver.
Second, NIO is reporting its quarterly results after the bell today. I did not have that listed below in the Key Earnings section in Monday's DMR and I also did not have it listed in our EB Weekly Portfolio Report on Sunday. I want to make sure everyone is aware of it, because NIO has been the best quarterly performer we've had since we started our various portfolios. At the time of inclusion in our Strong AD Portfolio on August 19th, NIO traded at 14.06. At last check, NIO was trading at 47.80. That's a 240% gain in just under 3 months. It has single-handedly carried our Strong AD Portfolio. We could see fireworks in either direction after the close today. Obviously, Wall Street is banking on a tremendous quarterly report from NIO. The reaction to this report could have a significant impact on our Strong AD Portfolio. I just wanted to make sure that our members are aware of the upcoming report.
Finally, I will be hosting our latest options webinar, "November Max Pain", at 4:30pm ET. It's designed to simply keep you informed of potential market direction based on open option interest. I'll also dive into a couple of potential individual stock trades based on large disparities of calls and puts, essentially attempting to mirror market maker positions as options expire. Market makers don't lose money very often. To join me for that webinar, you can use the following room link:
https://us02web.zoom.us/j/81140924367
The webinar room should open at approximately 4:00pm ET. Hope to see you there!
Executive Market Summary
- Futures were mixed this morning with the NASDAQ slightly higher, while the Dow Jones and S&P 500 took a breather
- Retail sales for October came in below expectations, but were positive
- The November housing market index, however, came in well above expectations, 90 vs. 85
- Despite the solid housing market index number, home construction ($DJUSHB, +0.26%) is relatively flat
- Walmart (WMT, -0.60%) and Home Depot (HD, -3.13%) both reported quarterly EPS above expectations
- The 10-year treasury yield ($TNX) has fallen 3 basis points to 0.87%, nearing its rising 20 day EMA
- Tesla (TSLA, +9.05%) will be joining the S&P 500, providing that stock and automobiles ($DJUSAU, +7.33%) a big boost
- Commodities are mostly lower as the U.S. Dollar (UUP) nears its early-September low
- Energy (XLE, +0.44%) is the best performing sector once again today
Market Outlook
When you look at a 10 year weekly chart of the QQQ (ETF that tracks the NASDAQ 100), it's almost hard to imagine that 2020 represented a year in which we've suffered through a 100-year pandemic and had to shut down our economy for a month with many other restrictions in place throughout the year. Seriously, check this out:
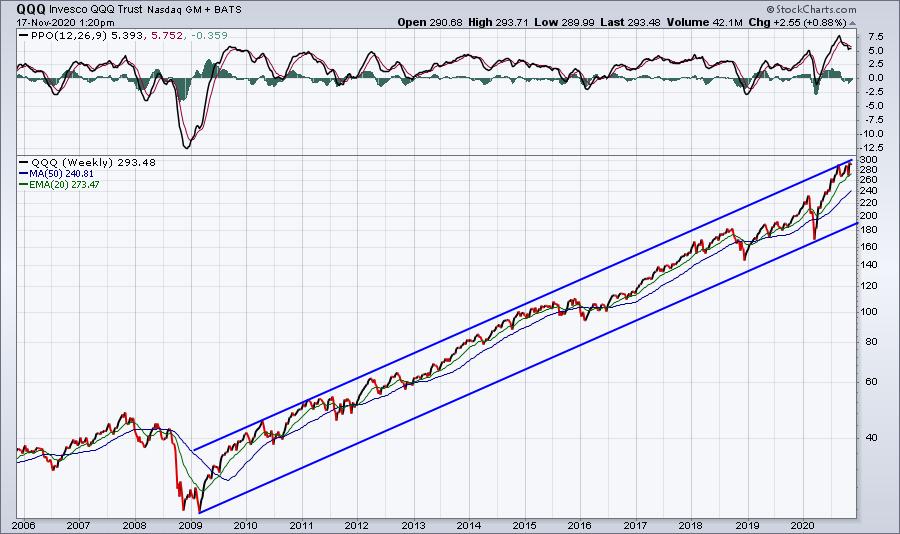
This is already looking like the aftermath of the 1987 market crash. Soon it will likely be a blip on the stock market radar. Take another look at that chart and think back to the media headlines of March 2020. It's disgraceful to think of how many people were scared out of their 401k's and are now waiting for the Great Depression 2.0 - that most media outlets said was coming - to get back in.
Sector/Industry Focus
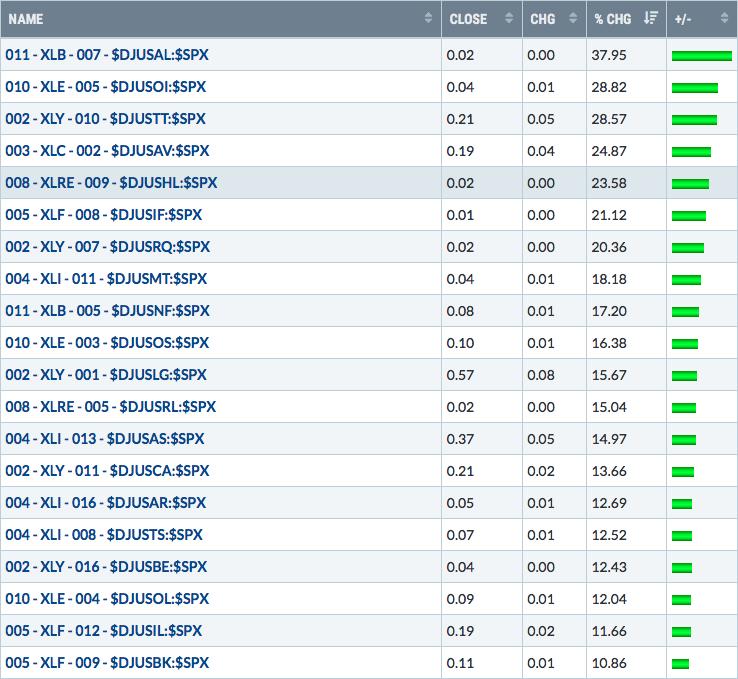
A big theme throughout 2020 has been the significant rotation resulting from the pandemic. Large caps over small caps. The NASDAQ over the S&P 500. Growth over value. Online retail over brick and mortar. The list goes on and on. When I discussed our newest portfolio stocks on the last "Draft Day" (August 19th), I said I believed the stock market was going higher, but that I was most concerned about leadership. I didn't want to change what was working, however, so I stuck with the high-octane growth stocks for one more quarter. They've done very well, but I'll use another football analogy. With just two more days to go before the next "Draft Day", I feel like an NFL team in "prevent defense" mode as we watch our quarterly outperformance try to hang on as the market tides shift. Our Aggressive Portfolio has already given up its lead. The Model Portfolio outperformance has been narrowing, although we're still in good shape there. But there's been a pretty simple explanation for the recent change in our outperformance. How many of the top 20 industry groups, in terms of monthly performance (October 18th through November 17th), can you name? I quickly glanced through the list and we have portfolio stocks that belong to just ONE of the TOP 50 (!!!) industry groups. Internet stocks ($DJUSNS) reside in that 50th spot. Here's the Top 20:
ChartLists/Strategies
I recently updated the Strong AD ChartList (SADCL), looking for stocks that have both strong relative charts AND a solid, and mostly rising, AD line. Here are two charts on this list that look interesting to me at current prices:
AAXN:
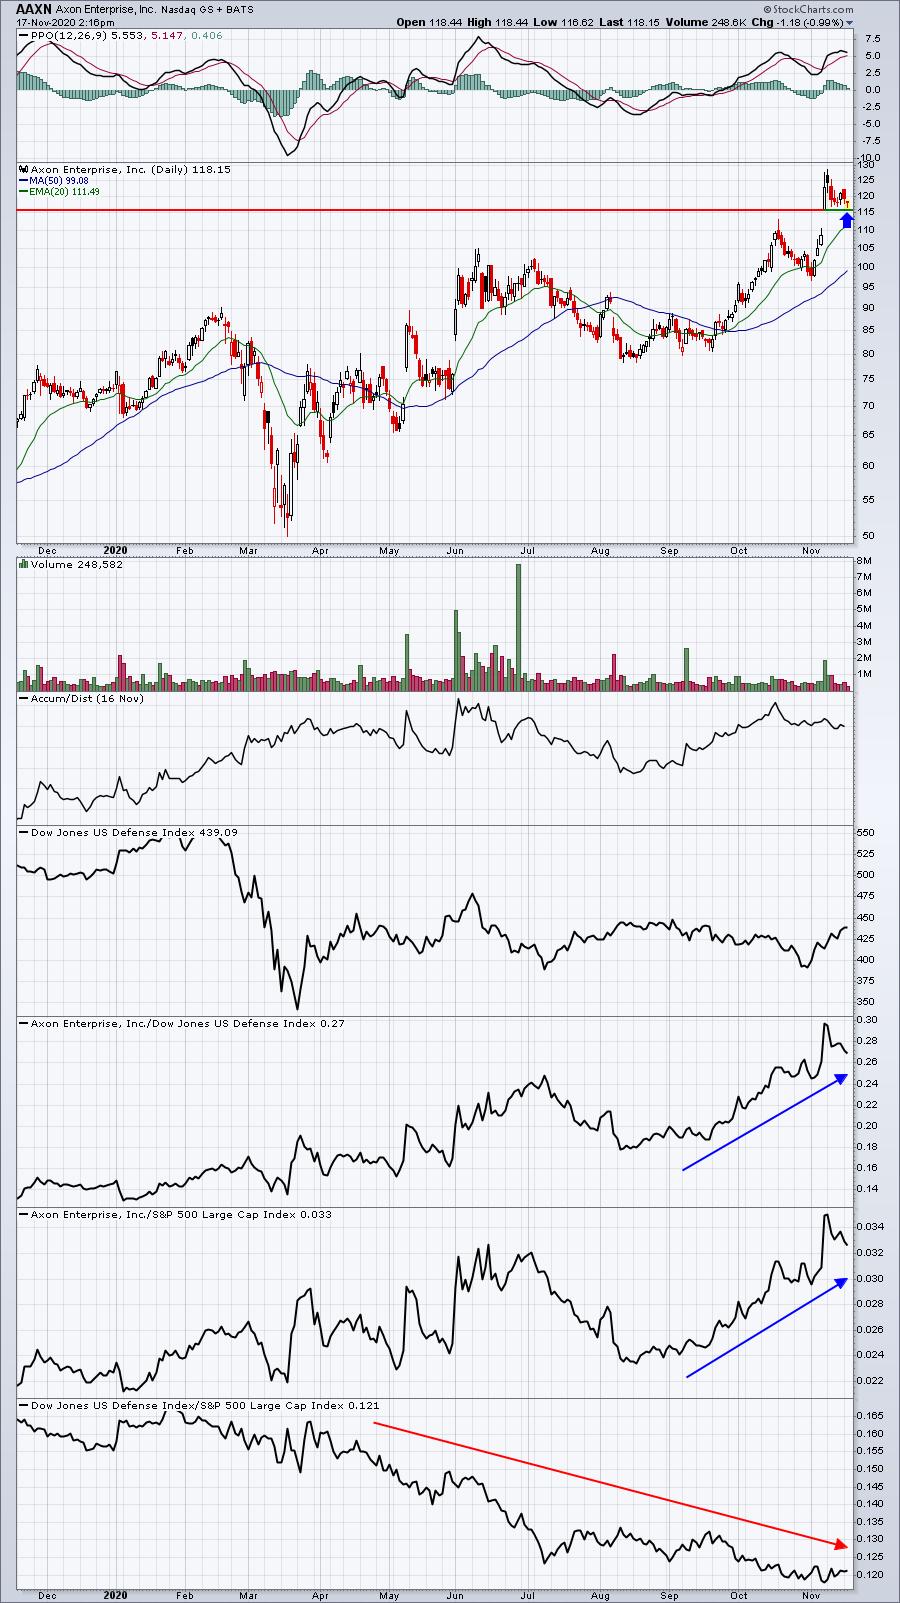
Defense stocks have been very weak, but AAXN has had no trouble outperforming the S&P 500 despite belonging to one of the worst industry groups. The top of gap support is holding thus far. If that gives way, then I'd look to the rising 20 day EMA for next support and a potential second entry.
(Disclosure: I own AAXN)
NSP:
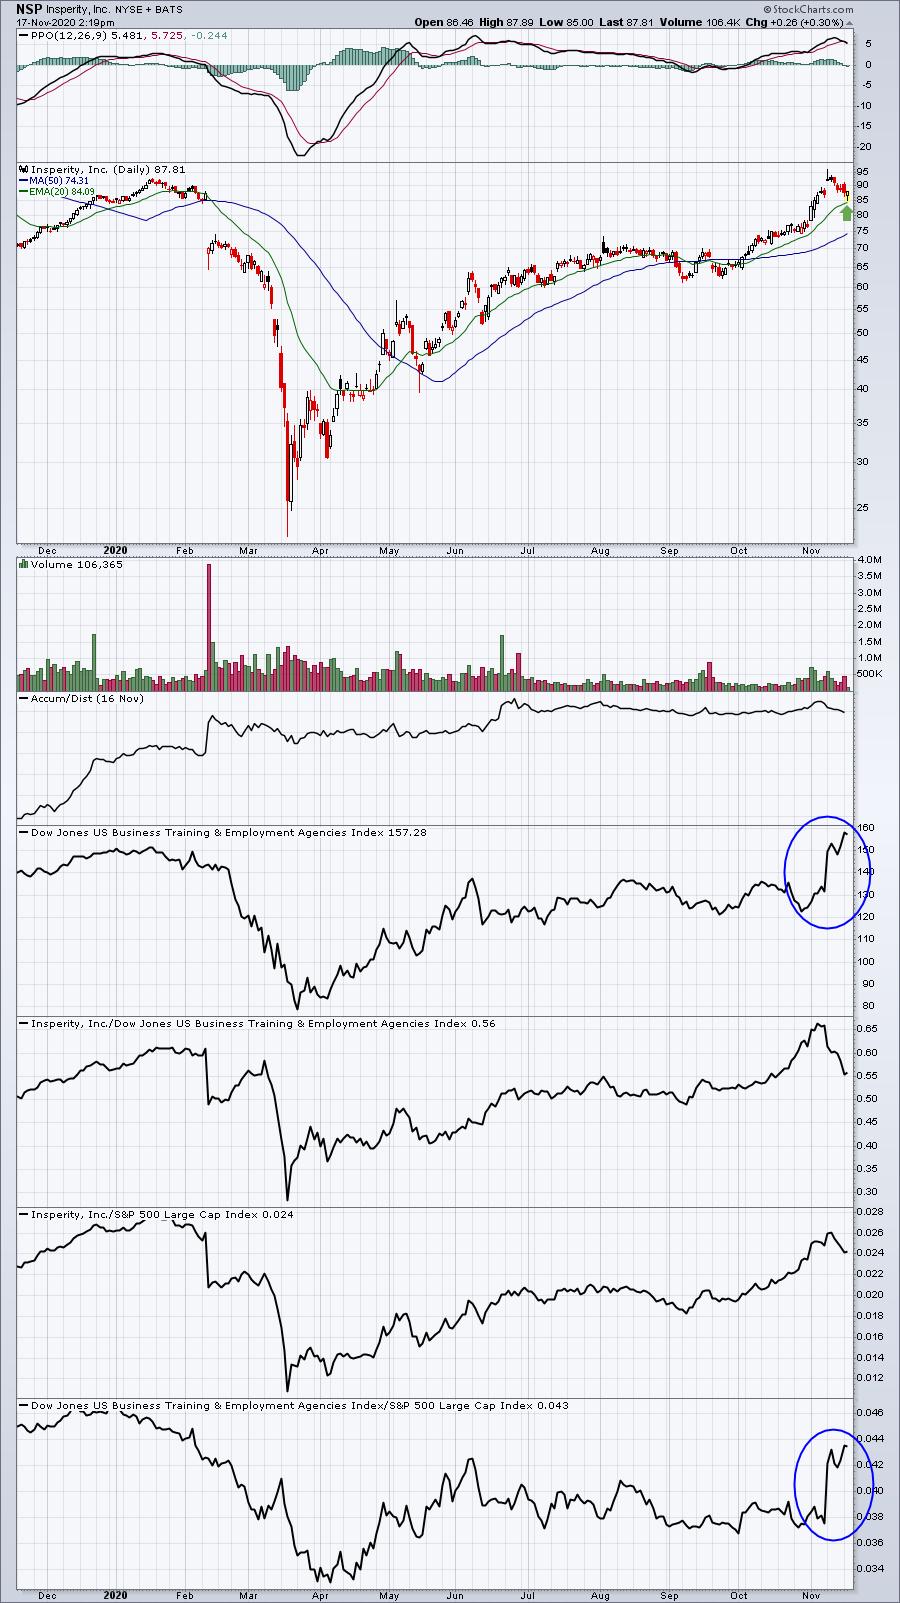
Any time a stock has accelerating bullish momentum (rising PPO), I'm generally a fan of buying on pullbacks to the 20 day EMA test. For NSP, I also cannot ignore those two blue circles. Wall Street has suddenly fallen in love with this NSP's industry. That won't hurt.
Earnings Reports
Here are the key earnings reports for the next two days, featuring stocks with market caps of more than $10 billion. I also include a few select companies with market caps below $10 billion. Finally, any portfolio stocks that will be reporting results are highlighted in BOLD. If you decide to hold a stock into earnings, please understand the significant short-term risk that you are taking. Please be sure to check for earnings dates for any companies you own or are considering owning.
Tuesday, November 17:
WMT, HD, NIO, SE, ARMK, KSS, LZB
Wednesday, November 18:
NVDA, LOW, TGT, TJX, CPRT, KEYS, ZTO, BILI, PAGS, SQM, NUAN, LB, KC, CPA, JACK, KLIC, AVYA
Economic Reports
October retail sales: +0.3% (actual) vs. +0.4% (estimate)
October retail sales less autos & gas: +0.2% (actual) vs. +0.6% (estimate)
October industrial production: +1.1% (actual) vs. +1.0% (estimate)
October capacity utilization: 72.8% (actual) vs. 72.2% (estimate)
September business inventories: +0.7% (actual) vs. +0.5% (estimate)
November housing market index: 90 (actual) vs. 85 (estimate)
Happy trading!
Tom