
EB Daily Market Report - Wednesday, November 18, 2020
Executive Market Summary
- Futures were mixed again, this time benefiting the Dow Jones and S&P 500, while the NASDAQ opened lower
- November max pain, discussed last night, suggests we should be careful over the next 7-10 days as there could be short-term downside
- Longer-term, signals remain quite bullish, in my view
- Crude oil ($WTIC, +1.62%) is higher once again, moving above $42 per barrel
- The 10-year treasury yield ($TNX) has risen 1 basis point to 0.88%, hovering just above its rising 20 day EMA
- Gold ($GOLD, -0.67%) has been struggling on a relative basis and that struggle continues today - see the Sector/Industry Focus section below
- NIO is flat today after reporting quarterly revenues and EPS ahead of expectations
- October housing starts beat expectations this morning, resulting in a solid day for home construction ($DJUSHB, +1.95%)
Market Outlook
The U.S. Dollar (UUP, -0.12%) has been weakening over the past several days, moving very close to price support established in early September at 24.80. There are signals developing that suggest we could see a dollar rally later this year or in 2021. The dollar has a history of following the relationship between the U.S. 10-year treasury yield ($UST10Y) and the German 10-year treasury yield ($DET10Y). The difference ($UST10Y-$DET10Y) between these two can be plotted on a SharpChart and you can see the correlation between the direction of this difference, or spread, and the direction of the U.S. dollar:
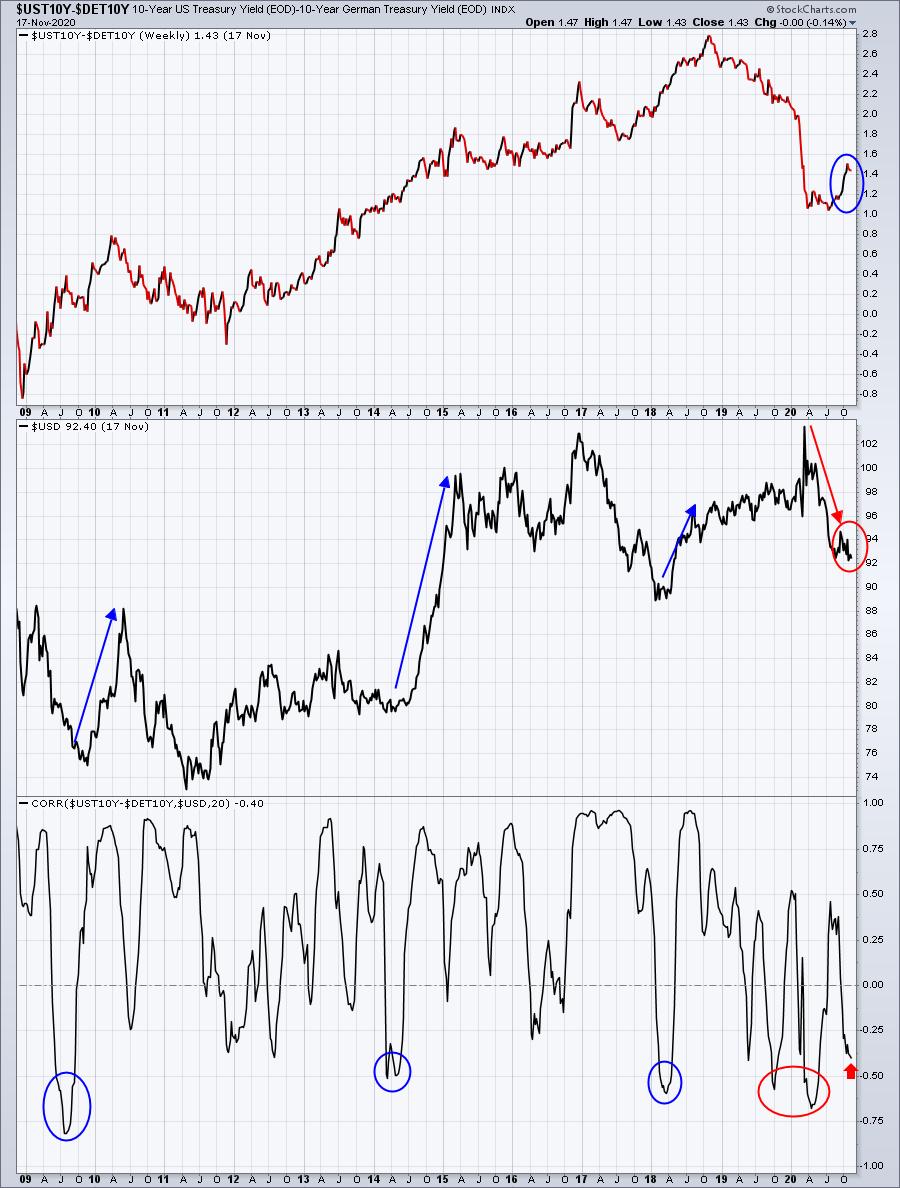
The three blue circles in the bottom correlation panel highlight the inverse correlation caused by the UST10Y-DET10Y yield difference rise without a corresponding rise in the dollar. That resulted in sudden surges higher in the dollar to bring the correlation back to normal positive fashion. The one red circle in that bottom panel highlighted the inverse correlation that resulted from the yield difference falling, while the dollar rose. That was quickly rectified when the dollar tumbled, starting in March 2020.
That brings us to today. I see the yield difference beginning to climb again. If that continues, I'd expect that later in 2020, or early 2021, we'll see a surge in the dollar. That would be a bearish development for both energy (XLE) and materials (XLB).
Sector/Industry Focus
Let's continue on that potential dollar rising theme as we look at gold ($GOLD). Many technicians have pointed to the rising price in gold as a reason to own it, or perhaps even overweight it. I believe that's a big mistake. Gold has had everything in its favor in 2020. The Volatility Index ($VIX) screamed higher and fear tends to benefit gold. In addition, the dollar has come crashing down in 2020 and there's a long-term inverse correlation between the dollar and gold. When the dollar falls, gold has a history of climbing, and vice versa. Despite everything moving in its favor, the relative performance of gold vs. the S&P 500 has not been very attractive:
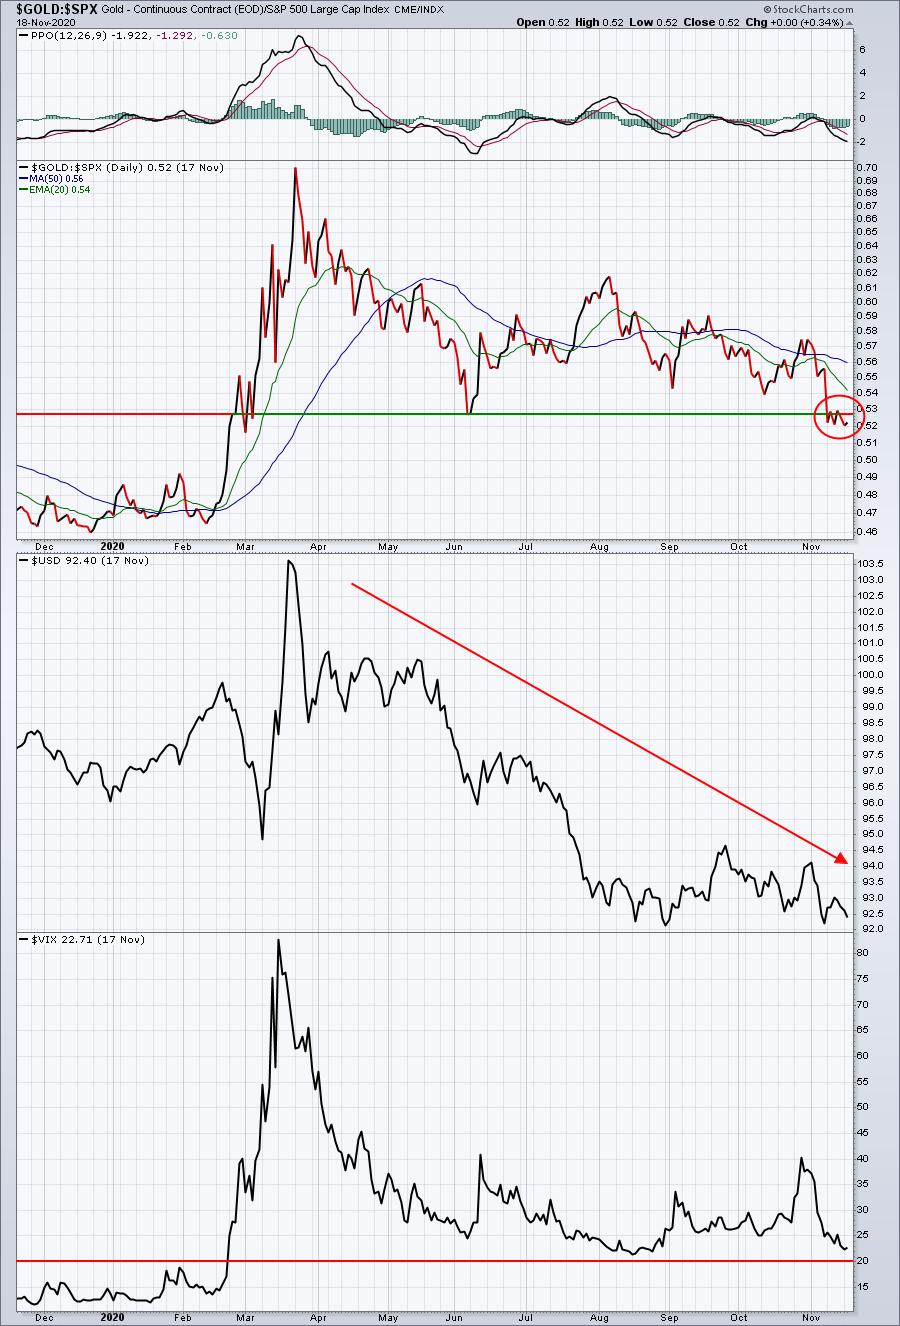
The dollar has tumbled more than 10% since its March high, yet GOLD has moved to a fresh 9-month relative low vs. the S&P 500. I couldn't be clearer. AVOID gold.
ChartLists/Strategies
I ran a scan of Strong Earnings ChartList stocks that have an RSI between 40-45 (so a pullback scan), and a SCTR above 80. One stock was returned - Peloton Interactive (PTON). I like the trade personally (disclosure: I own it) as there are plenty of in-the-money put options. There certainly could be financial incentive for market makers to drive PTON's price higher. It's a volatile stock, however, so make sure you're comfortable with the higher risk involved. Here's the current chart:
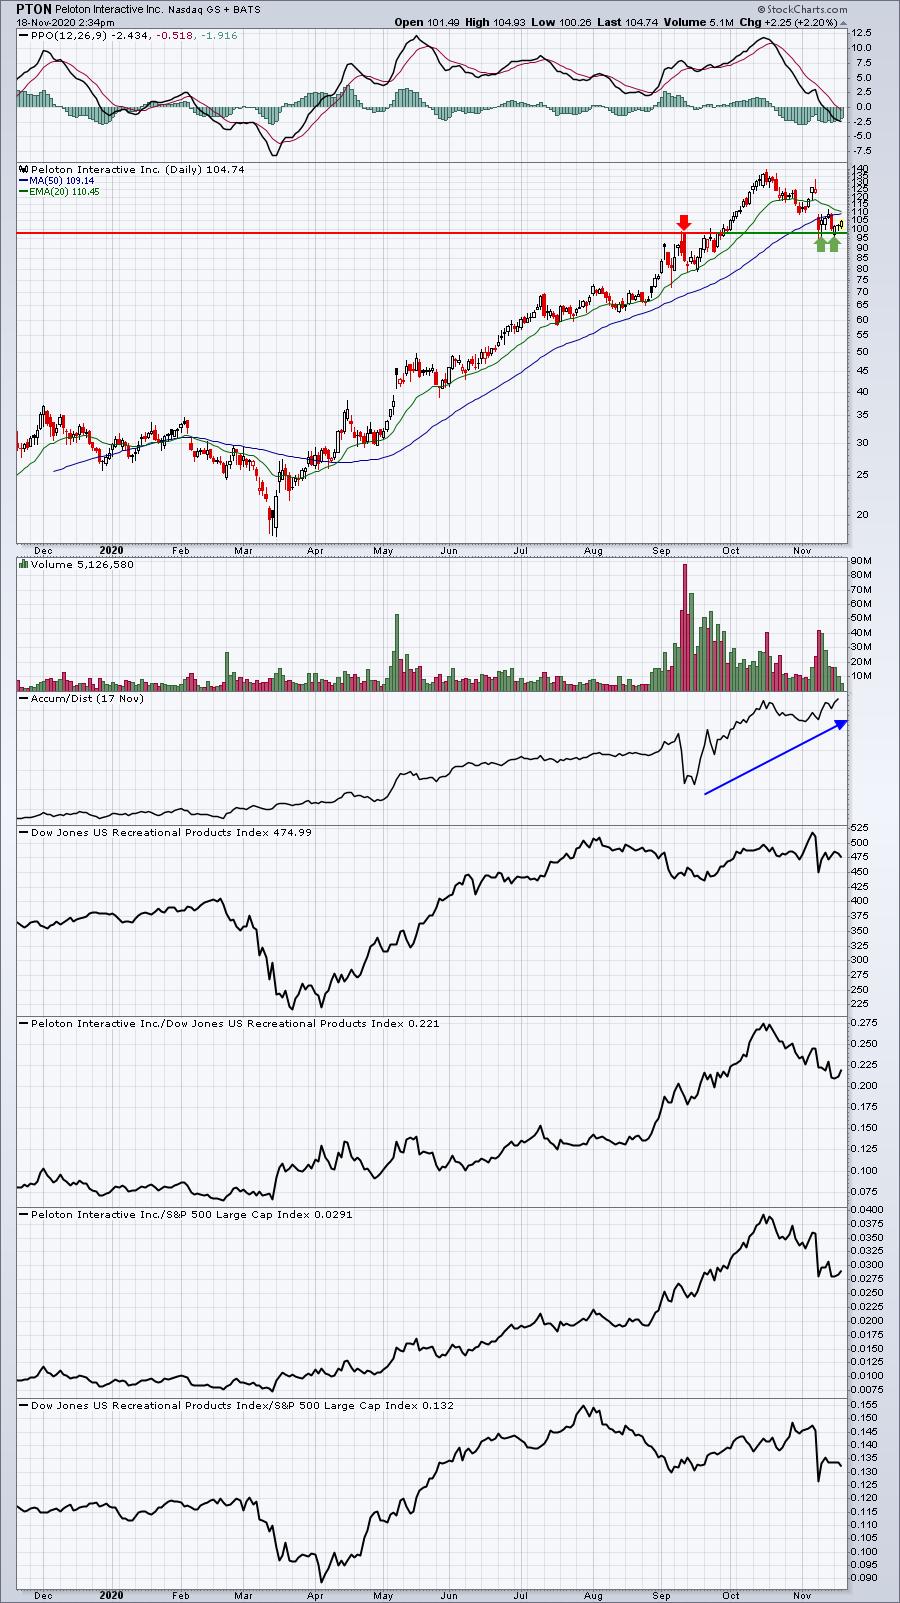
The AD line remains exceptionally strong here and PTON so far has successfully defended key price support in the 97-98 area. A break back above the now-declining 20 day EMA would help to confirm the resumption of an uptrend.
Earnings Reports
Here are the key earnings reports for the next two days, featuring stocks with market caps of more than $10 billion. I also include a few select companies with market caps below $10 billion. Finally, any portfolio stocks that will be reporting results are highlighted in BOLD. If you decide to hold a stock into earnings, please understand the significant short-term risk that you are taking. Please be sure to check for earnings dates for any companies you own or are considering owning.
Wednesday, November 18:
NVDA, LOW, TGT, TJX, CPRT, KEYS, ZTO, BILI, PAGS, SQM, NUAN, LB, KC, CPA, JACK, KLIC, AVYA
Thursday, November 19:
INTU, NTES, WDAY, ROST, MCFE, DADA, WSM, BERY, POST, WWD, BJ, MMS, JOBS, BECN, M, BRC, CSIQ, HP
Economic Reports
October housing starts: 1,530,000 (actual) vs. 1,460,000 (estimate)
October building permits: 1,545,000 (actual) vs. 1,560,000 (estimate)
Happy trading!
Tom