
EB Daily Market Report - Friday, November 20, 2020
Executive Market Summary
- Futures were weak this morning, though they were weaker on the Dow Jones and S&P 500
- There is no economic news of significance today; the 10-year treasury yield ($TNX) is down slightly to 0.84%
- The dollar (UUP) is flat, but commodities are mostly higher
- European markets are fractionally higher, while Asian markets were mixed overnight
- Utilities (XLU) began the day leading; communication services (XLC) have moved into positive territory to lead the NASDAQ higher on a relative basis
- Broadcasting & entertainment ($DJUSBC) stocks continue their three week climb, forging further into record high territory
- ETSY is today's top performing S&P 500 stock as it climbs toward gap resistance established by Pfizer's (PFE) vaccine news nearly two weeks ago
Market Outlook
The Pandemic Index that I created at StockCharts.com using the User-Defined Index (UDI) has broken out above its June 8th high. While that doesn't mean I'd go full throttle into those beaten-down groups during the early stages of the pandemic, it does serve notice that this bull market's rising tide is lifting all boats. That in itself is very, very bullish in my view. The objective in a bull market is to see ALL areas showing technical strength, leaving the bears nowhere to turn. This breakout is confirming that even the weakest are beginning to participate in this impressive bull market rally:
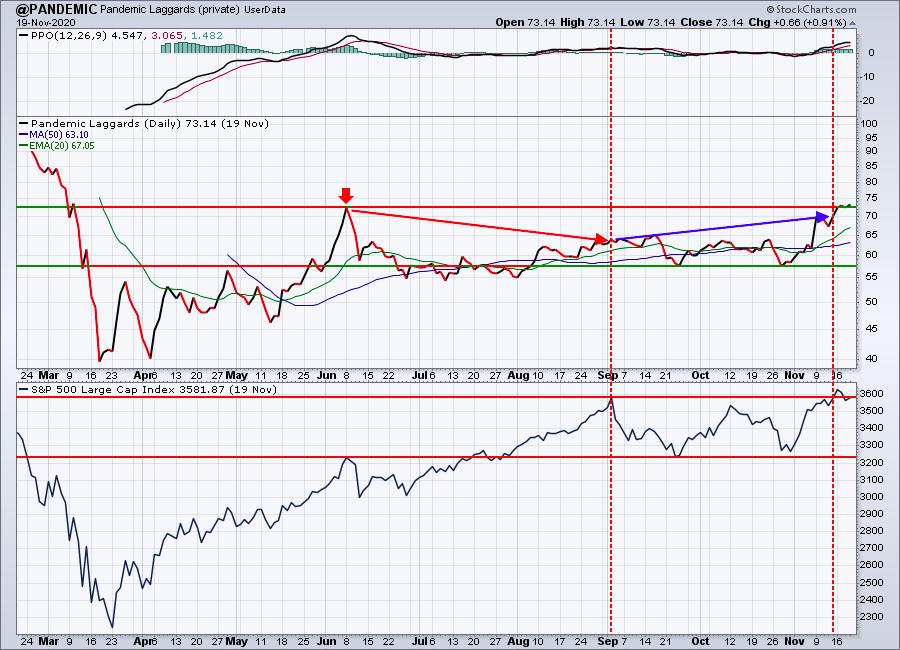
S&P 500 rallies have previously been led by the "chosen" industry groups that have benefited from stay-at-home orders, social distancing, etc. This one, however, is actually seeing the beaten-down industry groups rallying beyond their June 8th highs - a very bullish development.
Here is a relative chart of the Pandemic Index vs. the S&P 500:
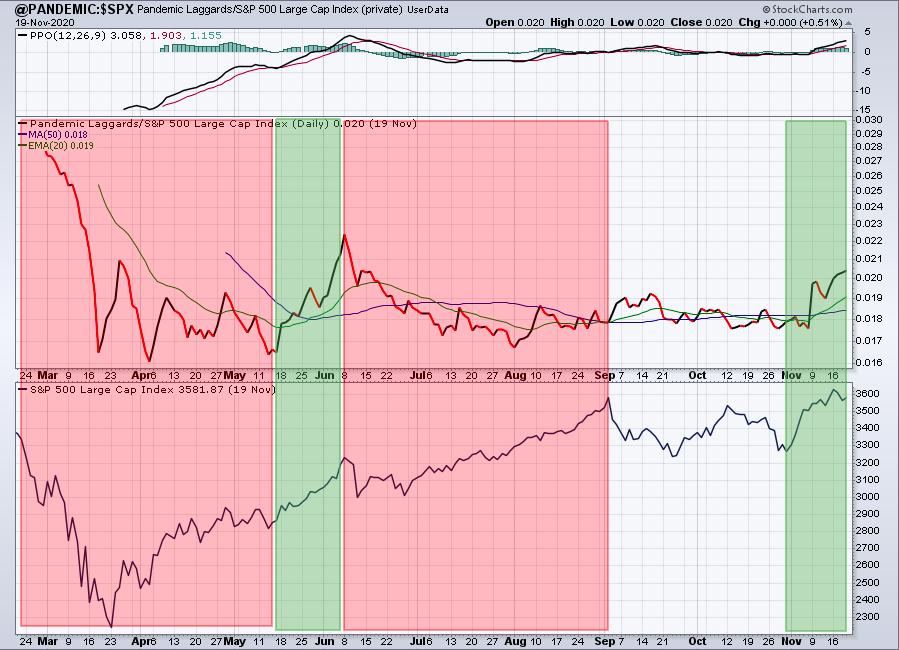
The relative strength has broken out above recent relative highs. The relative strength since early September is quite obvious, suggesting to me that there's significant rotation taking place that is BULLISH. It might not be bullish specifically for those stocks that have performed well during the pandemic, but wide participation is a hallmark of secular bull markets. We should welcome this rotation.
Sector/Industry Focus
Utilities (XLU) are showing relative strength today, but I think it's probably still got a bit further to go to the downside. Here's a chart that shows the negative divergence currently in play. I look for a PPO centerline test and/or 50 day SMA test when negative divergences develop on a daily chart:
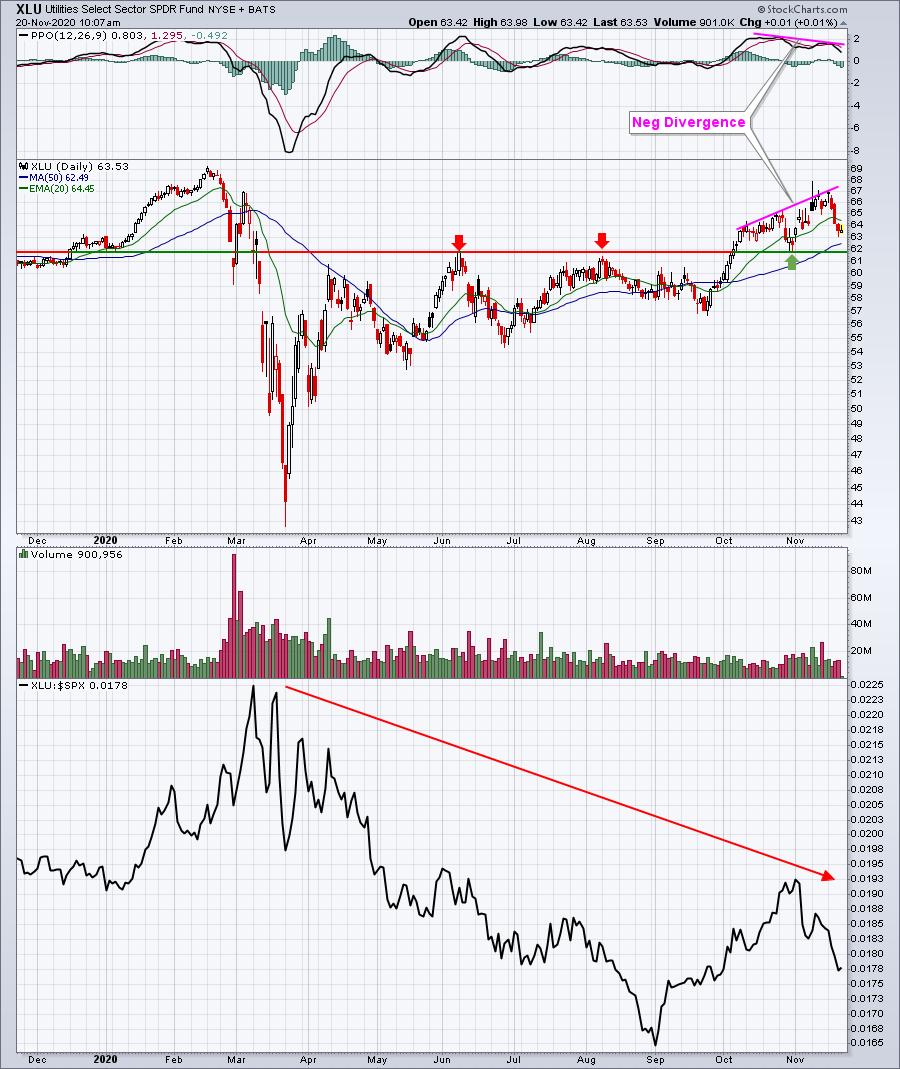
While the XLU is approaching what I'd deem to be very solid price support, I still expect any bounce to trail the S&P 500's gain as defensive sectors tend to trail on a relative basis during secular bull market advances. The bottom panel shows this quite well as the XLU has been trending lower on a relative basis ever since the S&P 500 bottomed. Its only relative strength occurred on the S&P 500 top in early September. As soon as the S&P 500 began rallying in November, the relative strength in the XLU faded.
ChartLists/Strategies
Sorting through our various ChartLists, I looked for bullish patterns that are simply awaiting breakouts to confirm. Here were 2 that I thought were worth mentioning:
CHWY:
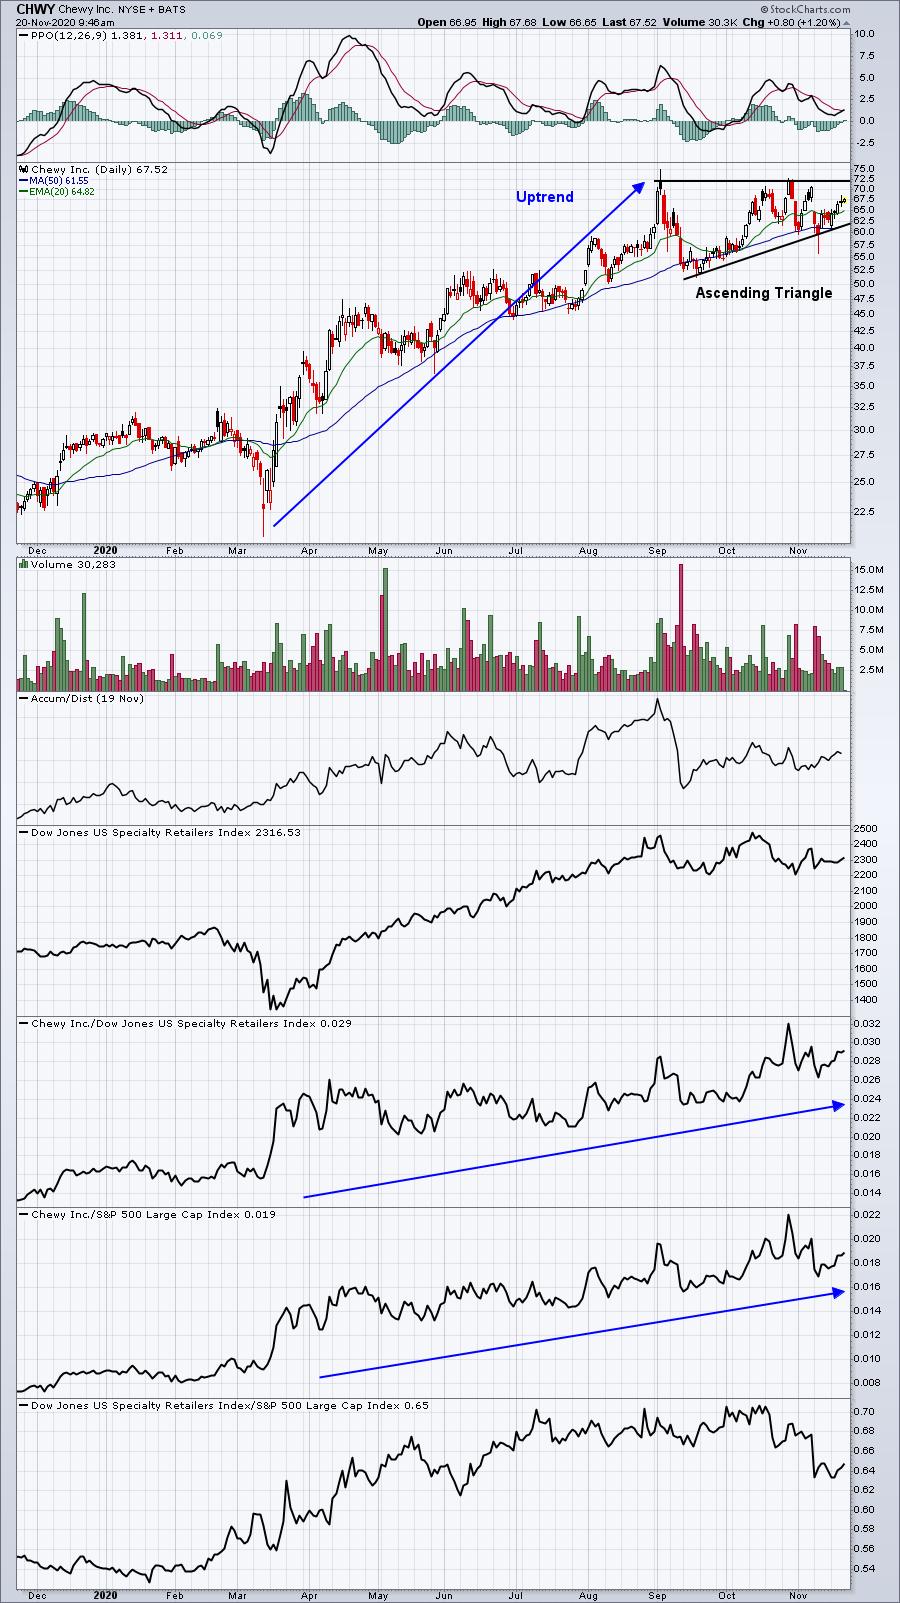
CHWY shows excellent relative strength, hindered only by its own recent consolidation. The ascending triangle pattern, however, is extremely bullish and I'd look for an eventual breakout. The stock can be bought during this consolidation pattern, but it'll likely require some patience. Upon breakout, this pattern measures up another 20 or so points to somewhere in the 92-93 range.
DGX:
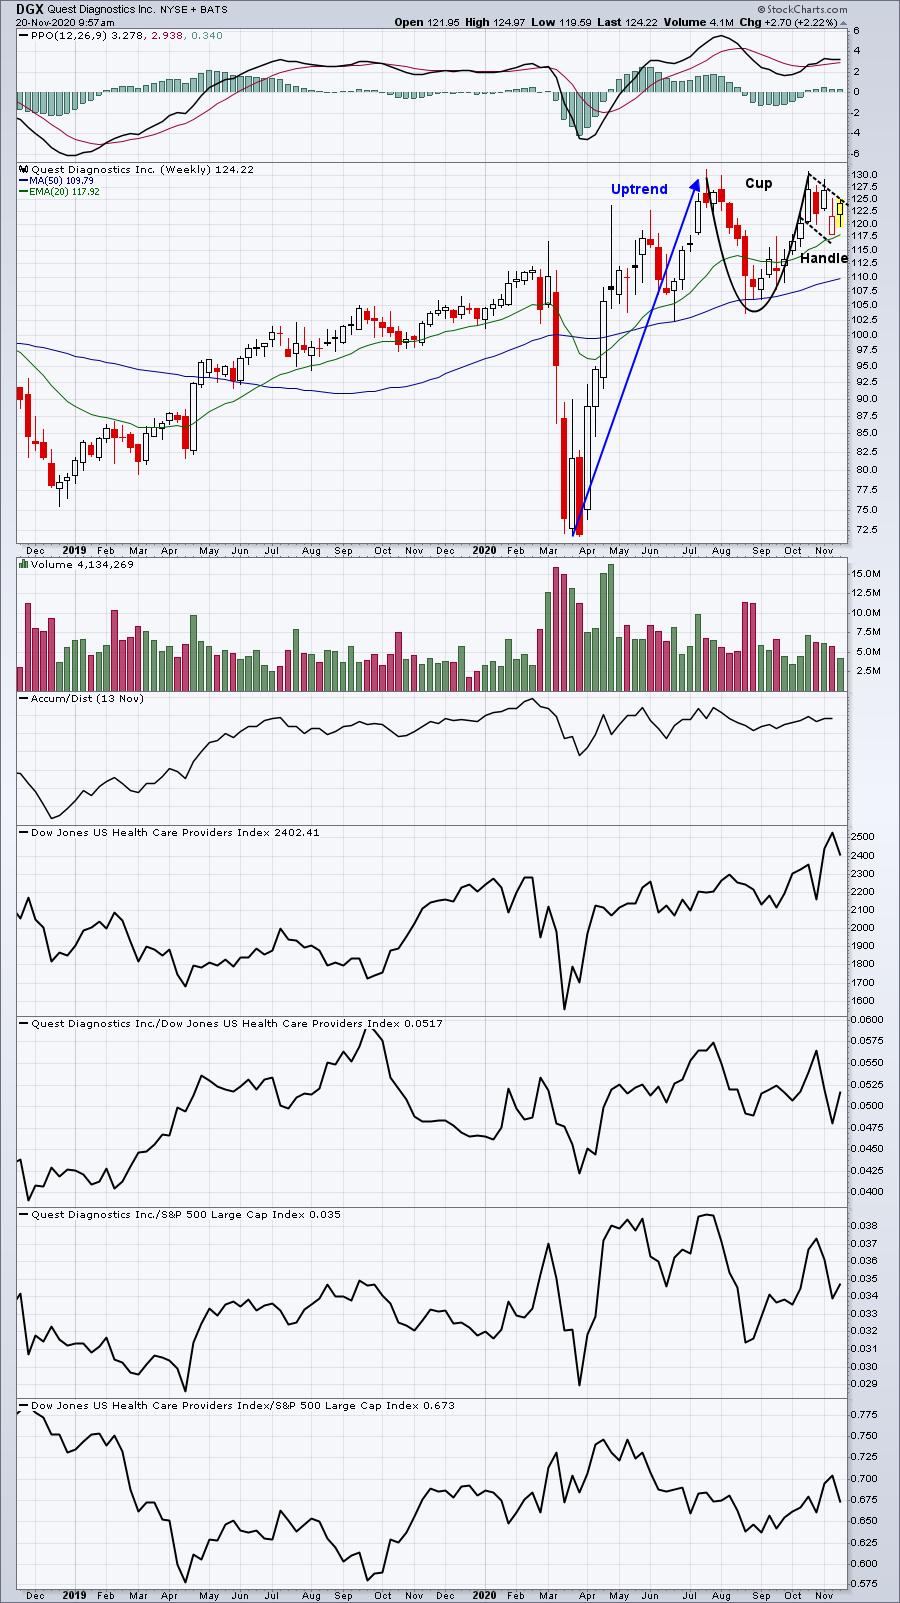
This is a weekly chart on DGX as the cup is extended on a daily chart and a bit more difficult to visualize. It's quite easy to see on this 2-year weekly chart, though. A typical handle in a cup with handle pattern tends to settle in at the rising 20 period EMA, which DGX has done. A breakout here measures from the top of the cup to its depth, or roughly 25 points. My initial target on a breakout would be approximately 150-155.
Earnings Reports
Here are the key earnings reports for the next two days, featuring stocks with market caps of more than $10 billion. I also include a few select companies with market caps below $10 billion. Finally, any portfolio stocks that will be reporting results are highlighted in BOLD. If you decide to hold a stock into earnings, please understand the significant short-term risk that you are taking. Please be sure to check for earnings dates for any companies you own or are considering owning.
Friday, November 20:
GSX, FL, BKE, HIBB
Monday, November 23:
A, WMG, ARWR, NTNX, TWST, DQ, URBN, NIU, CBT, CENT, AMBA, KFY
Economic Reports
None
Happy trading!
Tom