
EB Daily Market Report - Tuesday, November 24, 2020
Thanksgiving Holiday Schedule
U.S. markets are closed in observance of Thanksgiving Day on Thursday, November 26th. U.S. markets close at 1:00pm ET on Friday, November 27th. EarningsBeats.com will be closed Thursday and Friday, although there may be a brief Daily Market Report issued on Friday morning.
Executive Market Summary
- Futures were strong once again as this secular bull market advance carries on
- The Dow Jones has cracked 30000 for the first time in its history; the S&P 500 is attempting to close above its all-time high of 3626.91 from last week
- Economic reports were strong, especially those in the housing area; home construction stocks ($DJUSHB, -1.36%) are down, however
- The IWF:IWD (growth vs. value) ratio is testing key support at 1.69 - see Sector/Industry Focus below for more details
- Gold ($GOLD, -1.99%) is extending its recent slide as the Volatility Index tests its August low
- Crude oil prices ($WTIC, +4.51%) are soaring to $45 per barrel, their highest level since the massive March decline
- Energy (XLE, +4.62%) and financials (XLF, +3.14%) are the best performing sectors
- Meanwhile, defensive sectors are all at the bottom of the sector leaderboard, though they're all higher
- The Dow Jones is being led higher by Boeing (BA, +4.52%), Chevron (CVX, +4.03%), and JP Morgan (JPM, +4.00%)
Market Outlook
The Dow Jones is pushing past 30000 today and it's only fair that leadership come from transports ($TRAN). The TRAN is up 2.62% at last check and this combination - a breakout on the Dow Jones Industrial Average AND the Dow Jones Transportation Average - is what the Dow Theory is all about. Most technicians will agree that this 1-2 punch is extremely bullish for U.S. equities, simply building on what we've been discussing all year. Here's the latest chart on the TRAN:
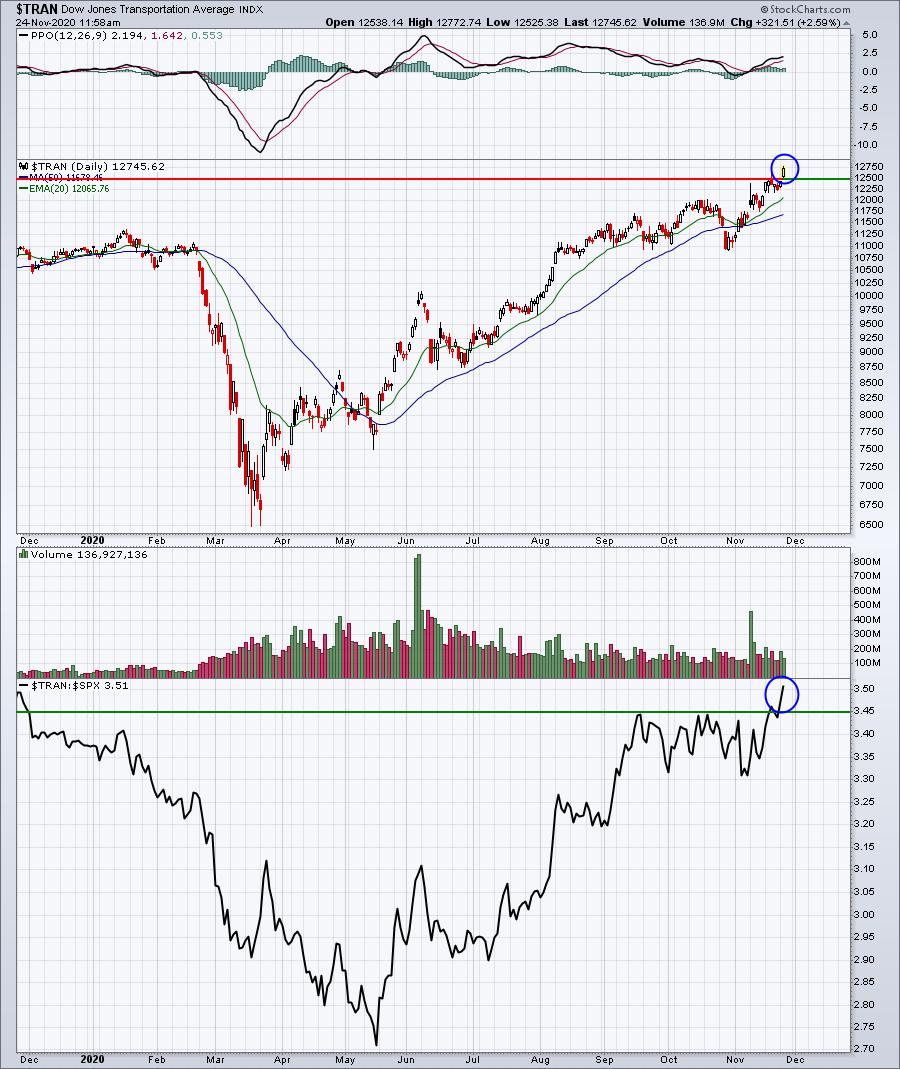
Those blue circles highlight not only the absolute breakout in transports, but also their relative leadership. Great action!
Sector/Industry Focus
The growth stocks (IWF) are clearly losing their relative luster compared to value stocks (IWD). I've previously written about key relative support being near 1.69. We're currently at that level:
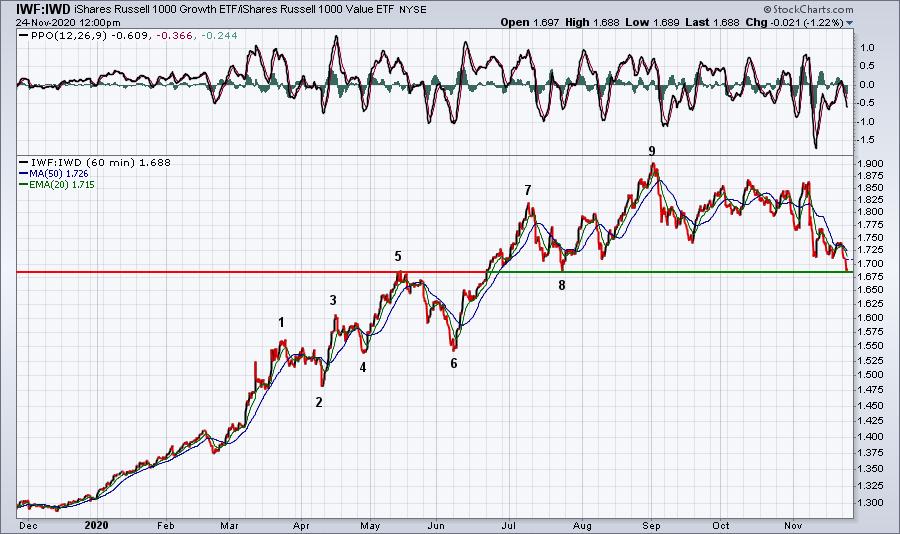
An uptrend, or in this case relative uptrend, is defined by a series of higher highs and higher lows. Based on that definition, I'd say this 1.69 level is very important to hold.
ChartLists/Strategies
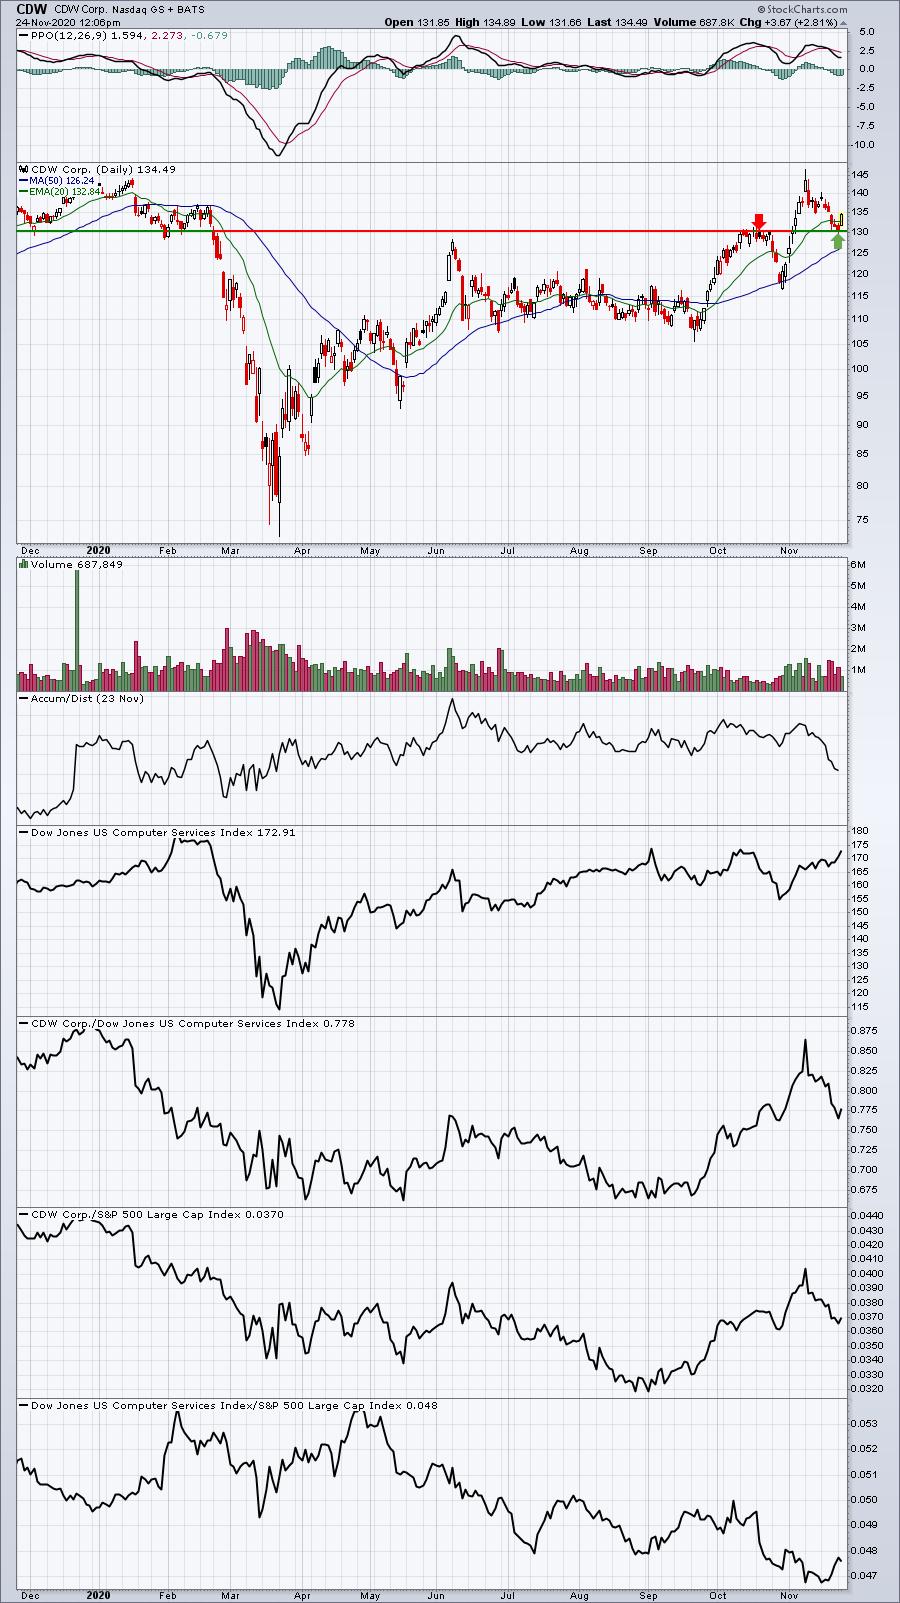
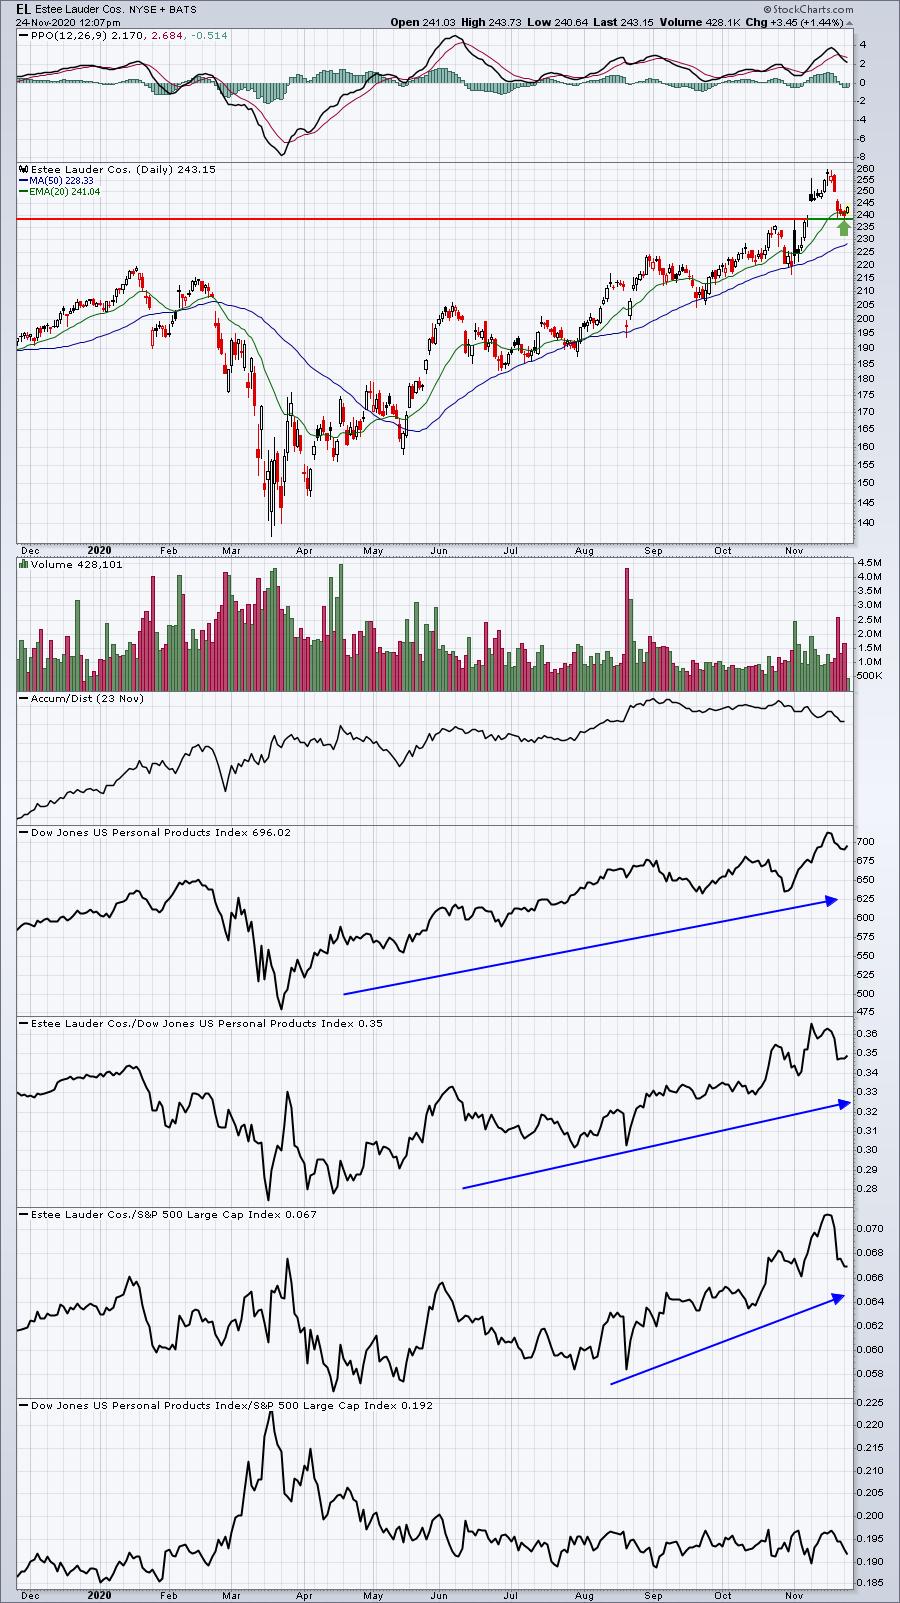
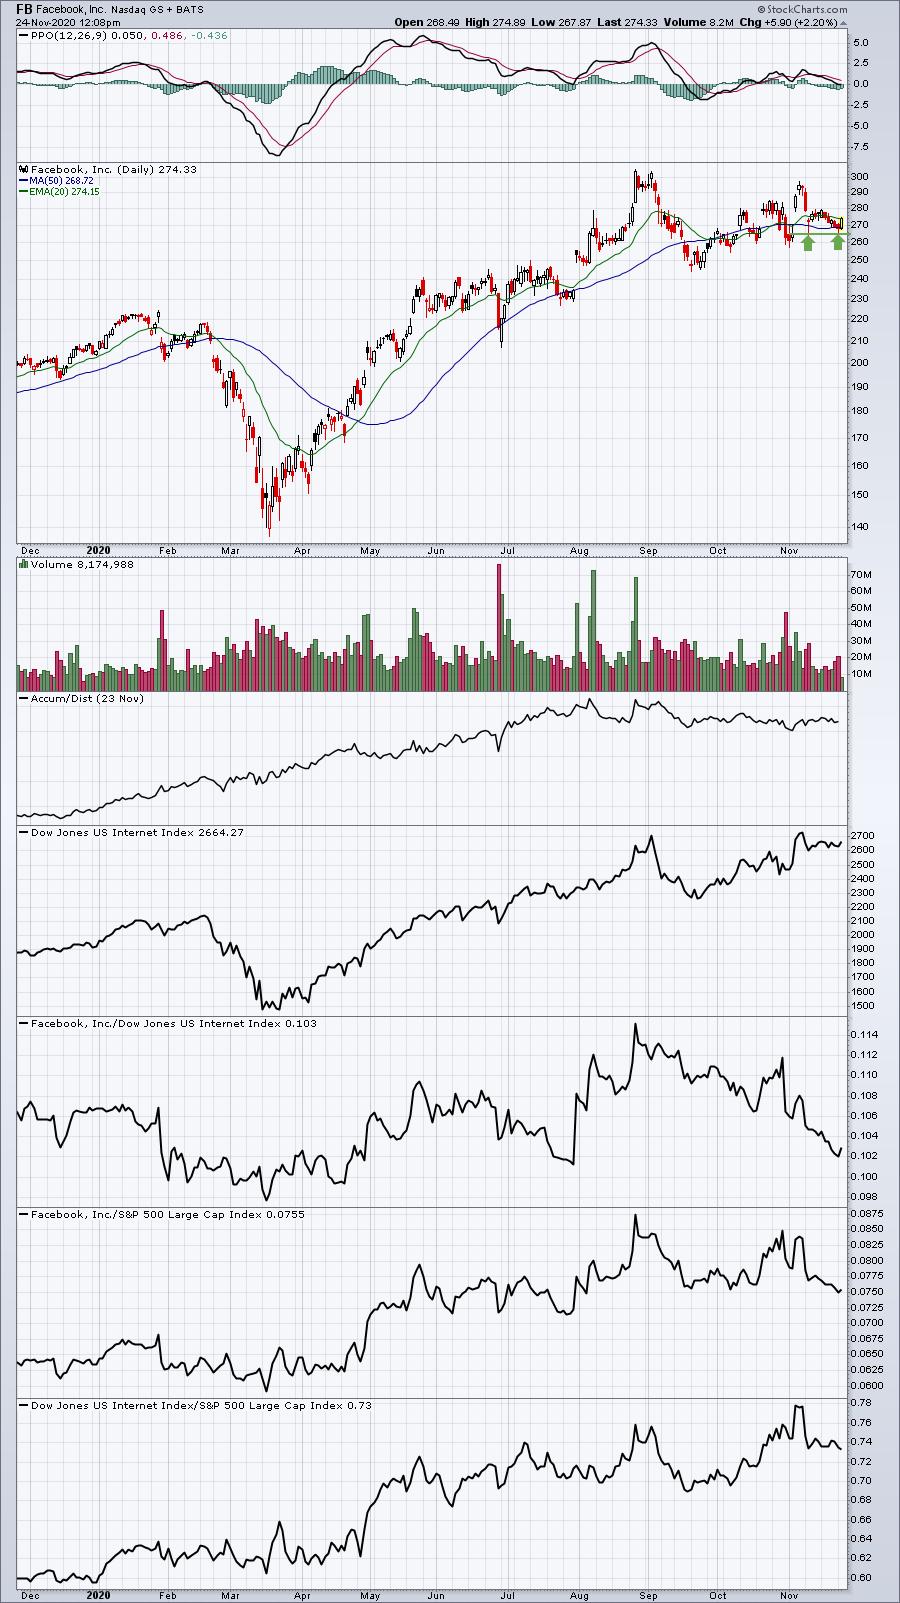
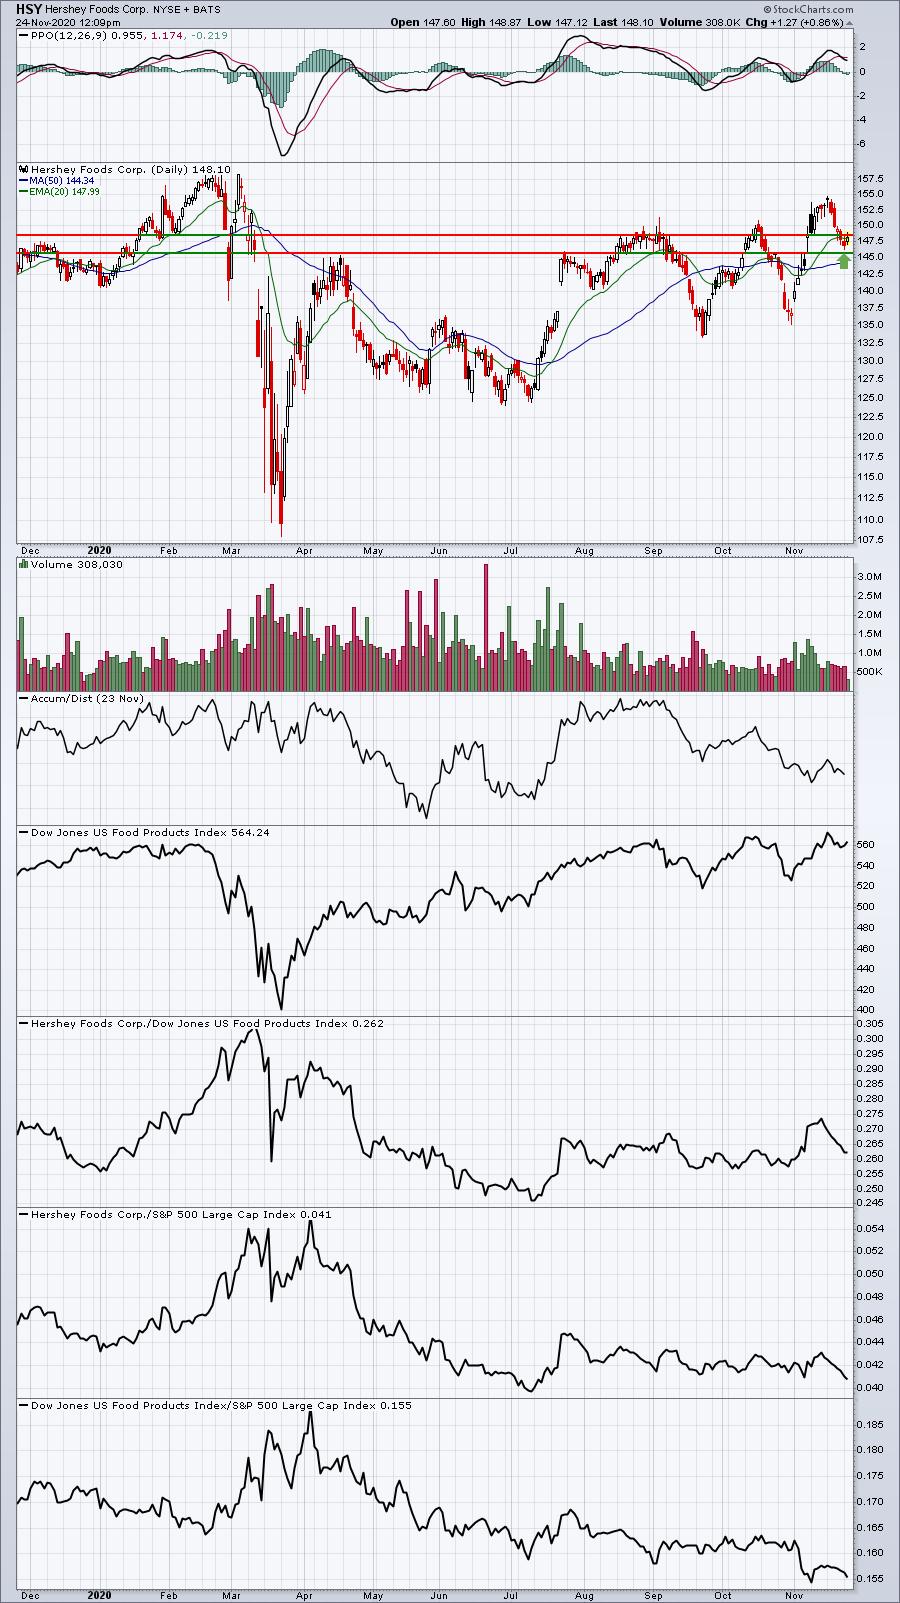
I run the Downtrend Reversal scan off our website every day against our ChartLists (except the Short Squeeze and Weak AD ChartLists). It just makes a lot of sense to me as it guarantees that I'm not chasing a stock. Today, several stocks appeared using this scan and I really liked most of the setups. They were ADP, CDW, EL, FB, HSY, SAVA. I didn't care much for ADP, mostly because it wasn't at a key support area. The others, however, do appear to be testing key support levels.
CDW:
EL:
FB:
HSY:
SAVA:
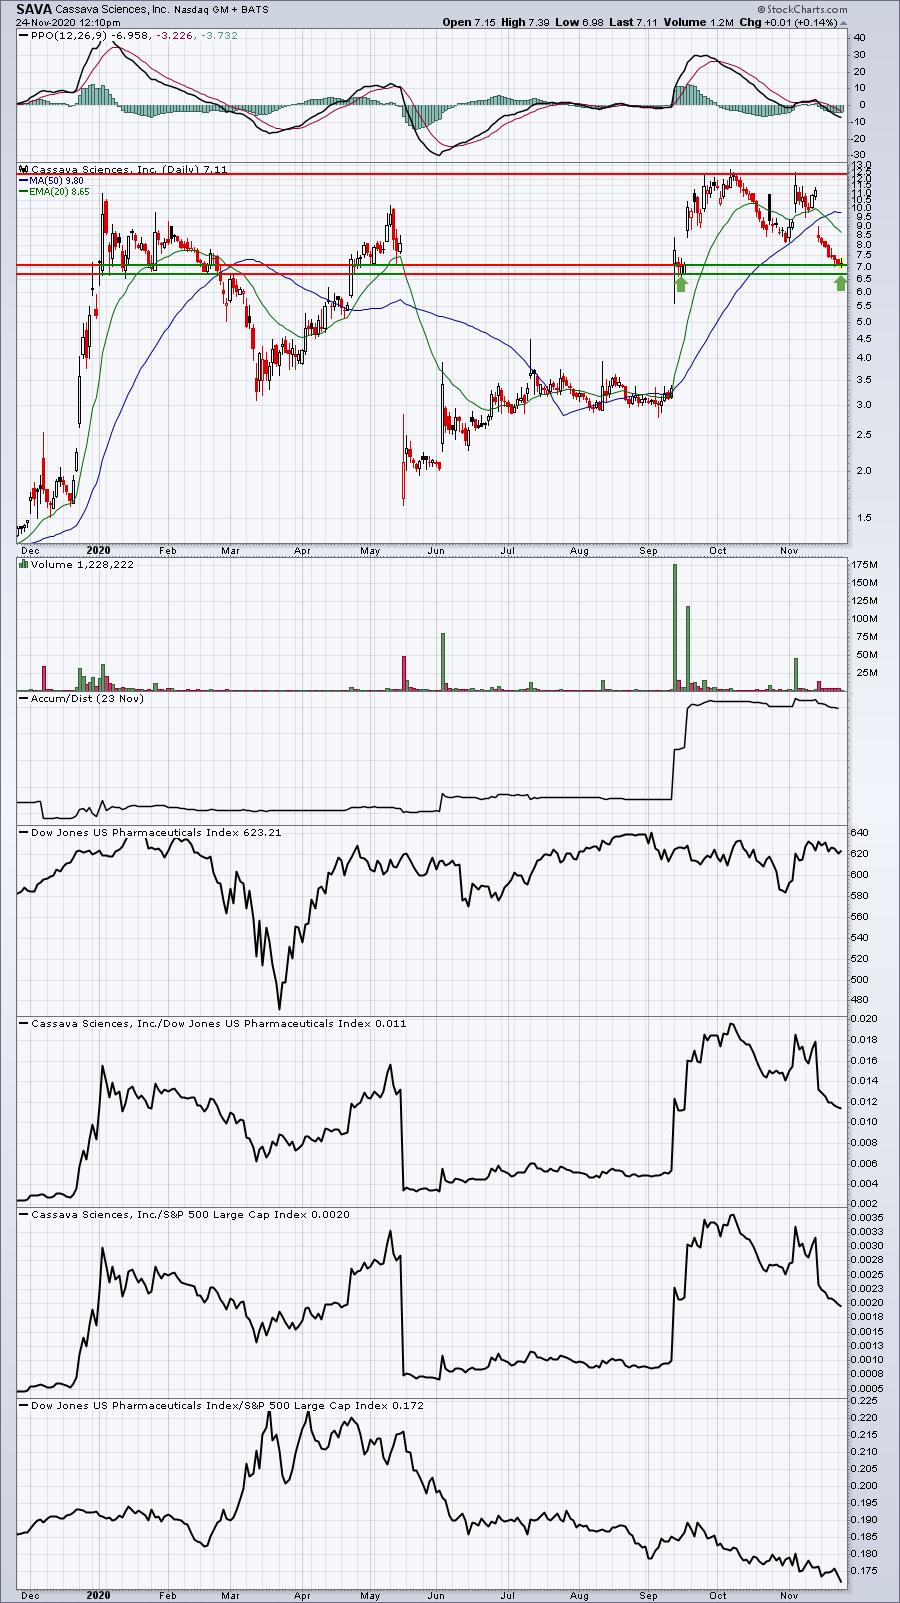
CDW and EL both came back down to test gap, price, or 20 day EMA support. They look the best technically. FB and HSY both look good in terms of their key areas of support being tested. Just keep in mind that they both have been performing miserably on a relative basis. In these types of cases, I'd simply make sure I kept my stop very tight. The final candidate, SAVA, is interesting. The stock tumbled recently when its secondary public offering was priced at $8. This can result in a very solid trading opportunity. I like SAVA, but just realize that it's quite volatile if you decide to trade it. There are multiple gaps on this chart in both directions, so holding overnight takes on new meaning on a stock like SAVA.
Earnings Reports
Here are the key earnings reports for the next two days, featuring stocks with market caps of more than $10 billion. I also include a few select companies with market caps below $10 billion. Finally, any portfolio stocks that will be reporting results are highlighted in BOLD. If you decide to hold a stock into earnings, please understand the significant short-term risk that you are taking. Please be sure to check for earnings dates for any companies you own or are considering owning.
Tuesday, November 24:
MDT, VMW, ADSK, DELL, ADI, BBY, HPQ, HRL, DLTR, TIF, J, SJM, GPS, PLAN, EV, DKS, PSTG, JWN, AEO, VNET, DY, AMWD, ANF
Wednesday, November 25:
DE, DOOO, FRO
Economic Reports
September Case Shiller HPI: +1.3% (actual) vs. +0.5% (estimate)
September FHFA HPI: +1.7% (actual) vs. +0.9% (estimate)
November consumer confidence: 96.1 (actual) vs. 98.0 (estimate)
Happy trading!
Tom