
EB Daily Market Report - Wednesday, November 25, 2020
Thanksgiving Holiday Schedule
Happy Thanksgiving!
U.S. markets are closed in observance of Thanksgiving Day on Thursday, November 26th. U.S. markets close at 1:00pm ET on Friday, November 27th. EarningsBeats.com will be closed Thursday and Friday, although there may be a brief Daily Market Report issued on Friday morning. The Friday after Thanksgiving Day tends to be slow without much volatility. If that's the case this year, there likely will be no DMR.
Executive Market Summary
- Futures were mixed overnight as traders turned more towards NASDAQ stocks at the opening bell
- Small caps ($SML) and mid caps ($MID) are today's worst performing indices
- Technology (XLK, +0.43%) and consumer stocks are leading today, while energy (XLE, -1.49%) sees some profit taking
- There were a lot of economic reports, but the 10-year treasury yield ($TNX) remains mostly unchanged
- Crude oil ($WTIC) is up another 2%, nearing $46 per barrel
- Renewable energy ($DWCREE, +2.85%) and broadline retailers ($DJUSRB, +1.62%) were among the best performing industry groups
- Autodesk (ADSK, +6.77%) and Etsy (ETSY, +5.84%) are today's top performing S&P 500 stocks
Market Outlook
The profit taking that we're seeing today is just normal selling after a solid advance. While weekly and daily charts on the S&P 600 Small Cap Index ($SML) look spectacular, it's not at all unusual to see short-term selling from time to time. Given the strength in the hourly PPO, I'd be fine with any short-term trip down to test the rising 20 hour EMA. On the $SML, here's what that looks like:
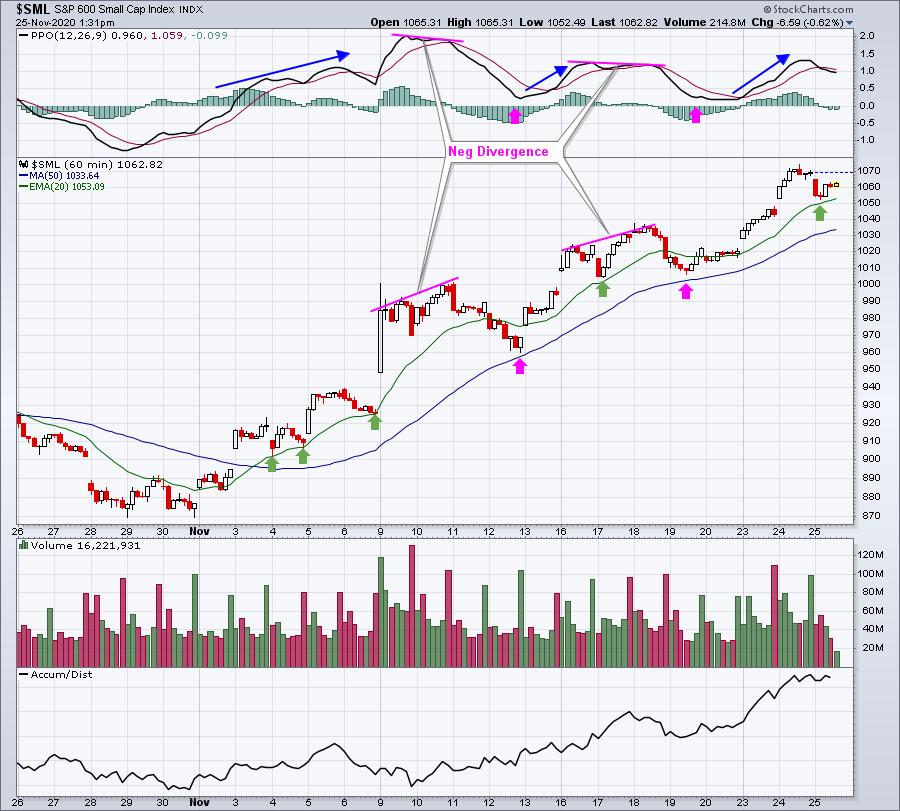
The pink arrows show the expectation for a period of deeper selling. This occurs after a negative divergence prints. When the PPOs are rising off of centerline tests, initial price pullbacks are typically contained by the rising 20 hour EMAs (green arrows).
Sector/Industry Focus
Broadline retail ($DJUSRB) seems to be somewhat forgotten, but that's typical as money rotates during a bull market advance. Different groups lead different advances. The DJUSRB has been a tremendous leader throughout 2020, but it's pausing and consolidating, resulting in relative weakness. Personally, I don't give up on a group like this, but it does take patience to allow the consolidation phase to play out:
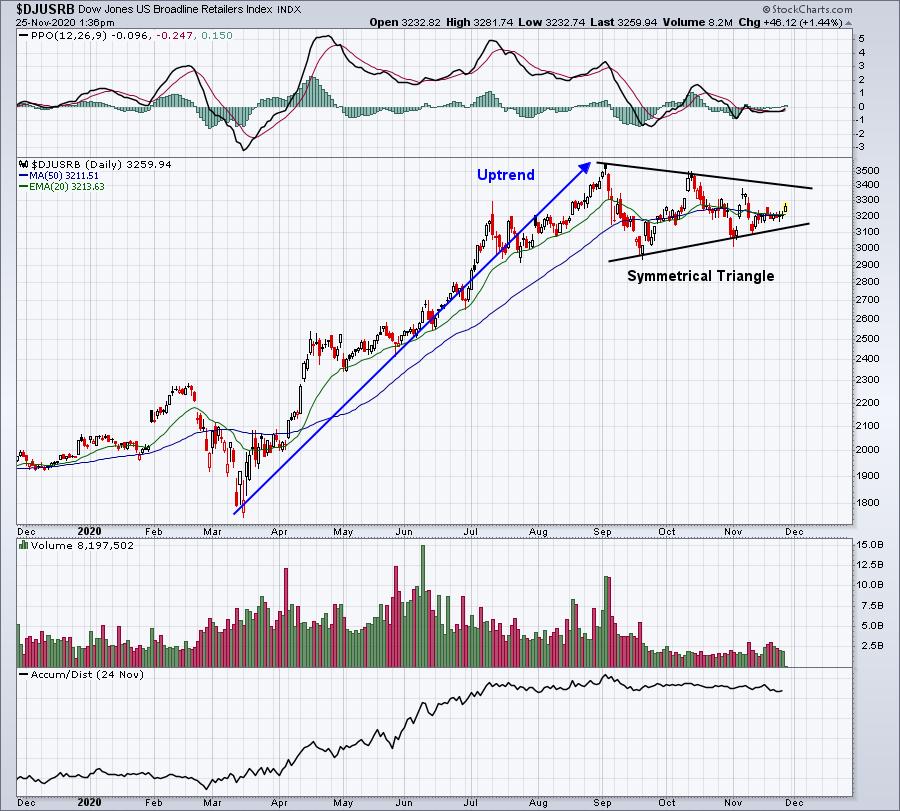
I find this to be a very bullish chart. But you'll grow very impatient trading stocks in this space, while the market continues to break out. It's extremely important to understand rotation and to visualize it. The DJUSRB might remain in this triangle pattern for a few more weeks, perhaps longer. If you own Amazon.com (AMZN) and can't understand why the stock market is going up without you, it's because of rotation and consolidation. AMZN is a great stock, but it provided leadership for months. It's taking a vacation, that's all.
ChartLists/Strategies
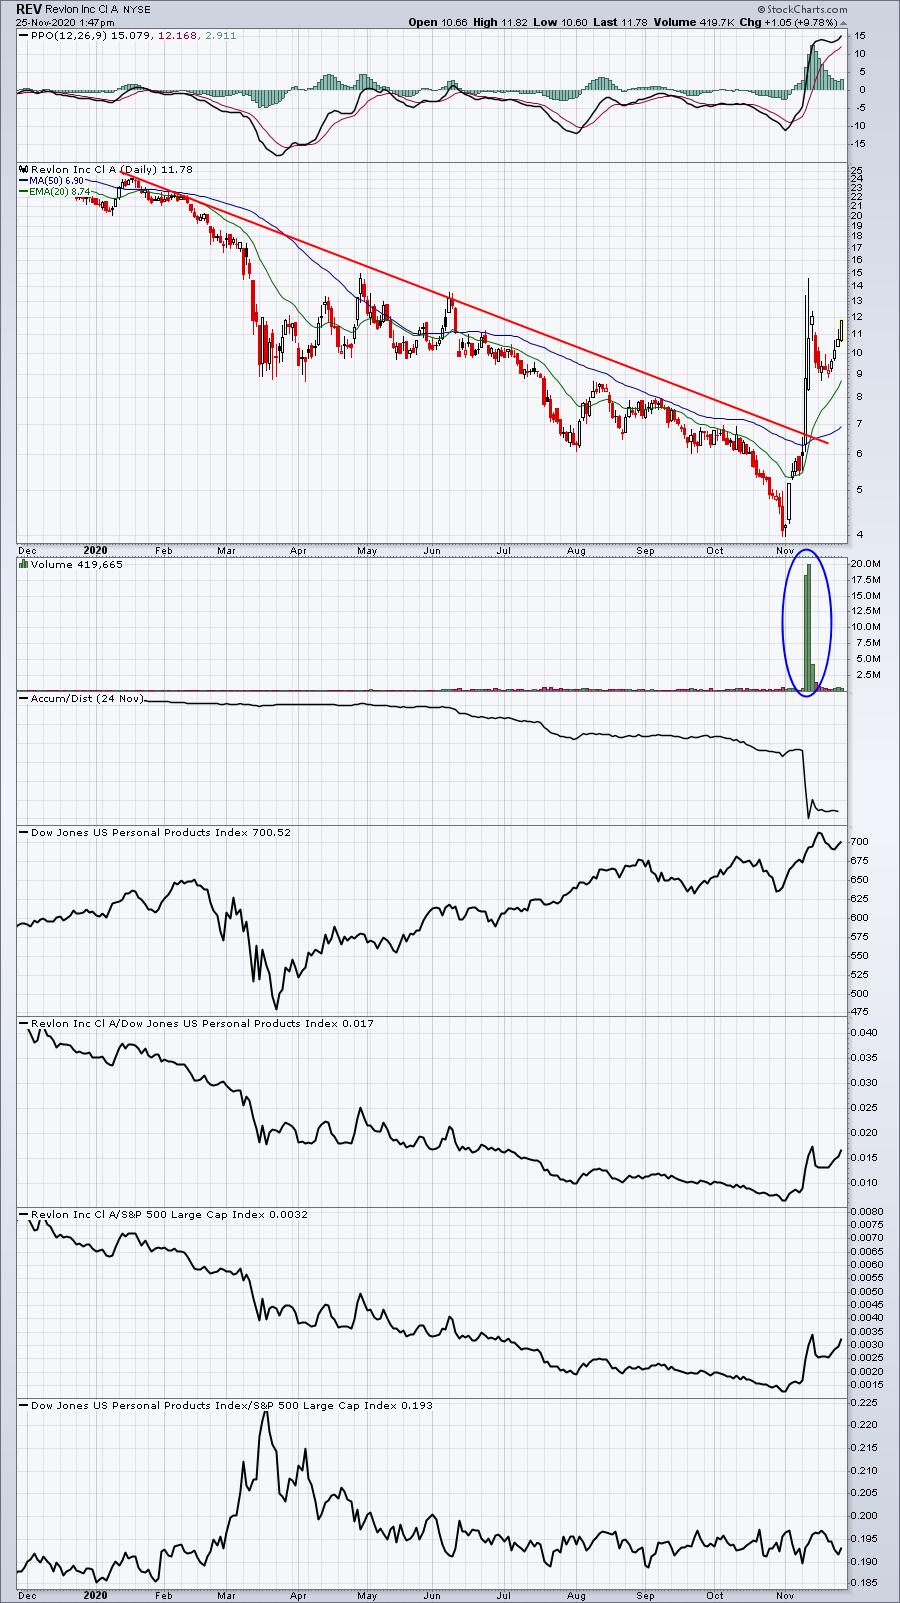
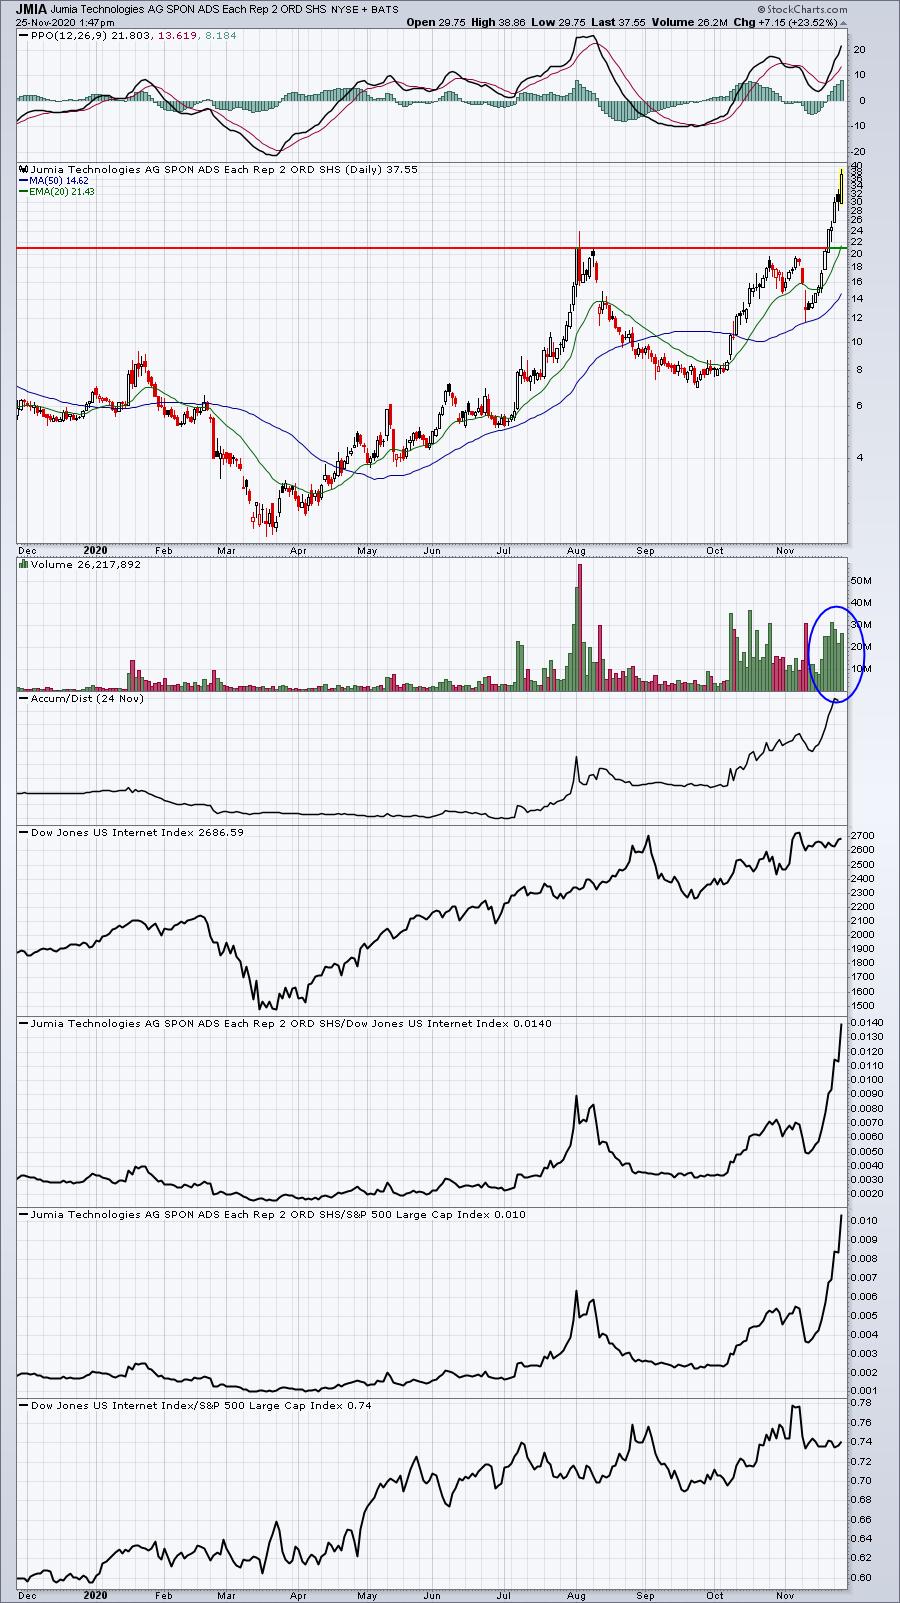
The recent market rotation into unloved areas of the stock market is triggering a slew of short squeezes. Here are the one month returns for the best performers on our Short Squeeze ChartList since the October low:
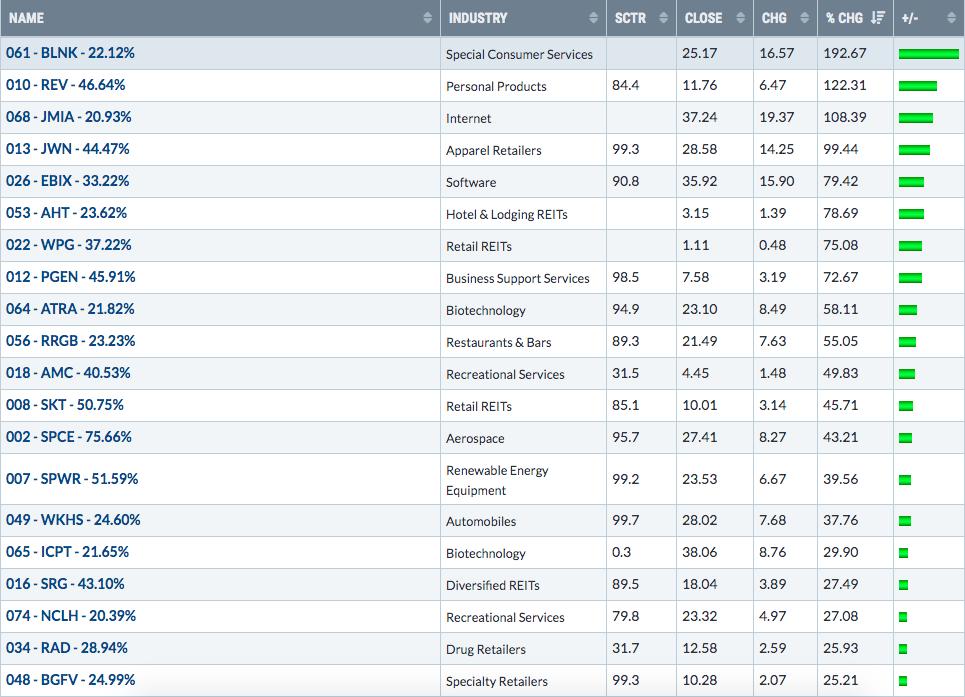
20 of our 74 Short Squeeze ChartList stocks have gained at least 25% over the past month. That's very impressive performance. The percentages next to the ticker symbols represent the "short % of float". The higher the number, the more of a short squeeze impact there could be upon a price breakout.
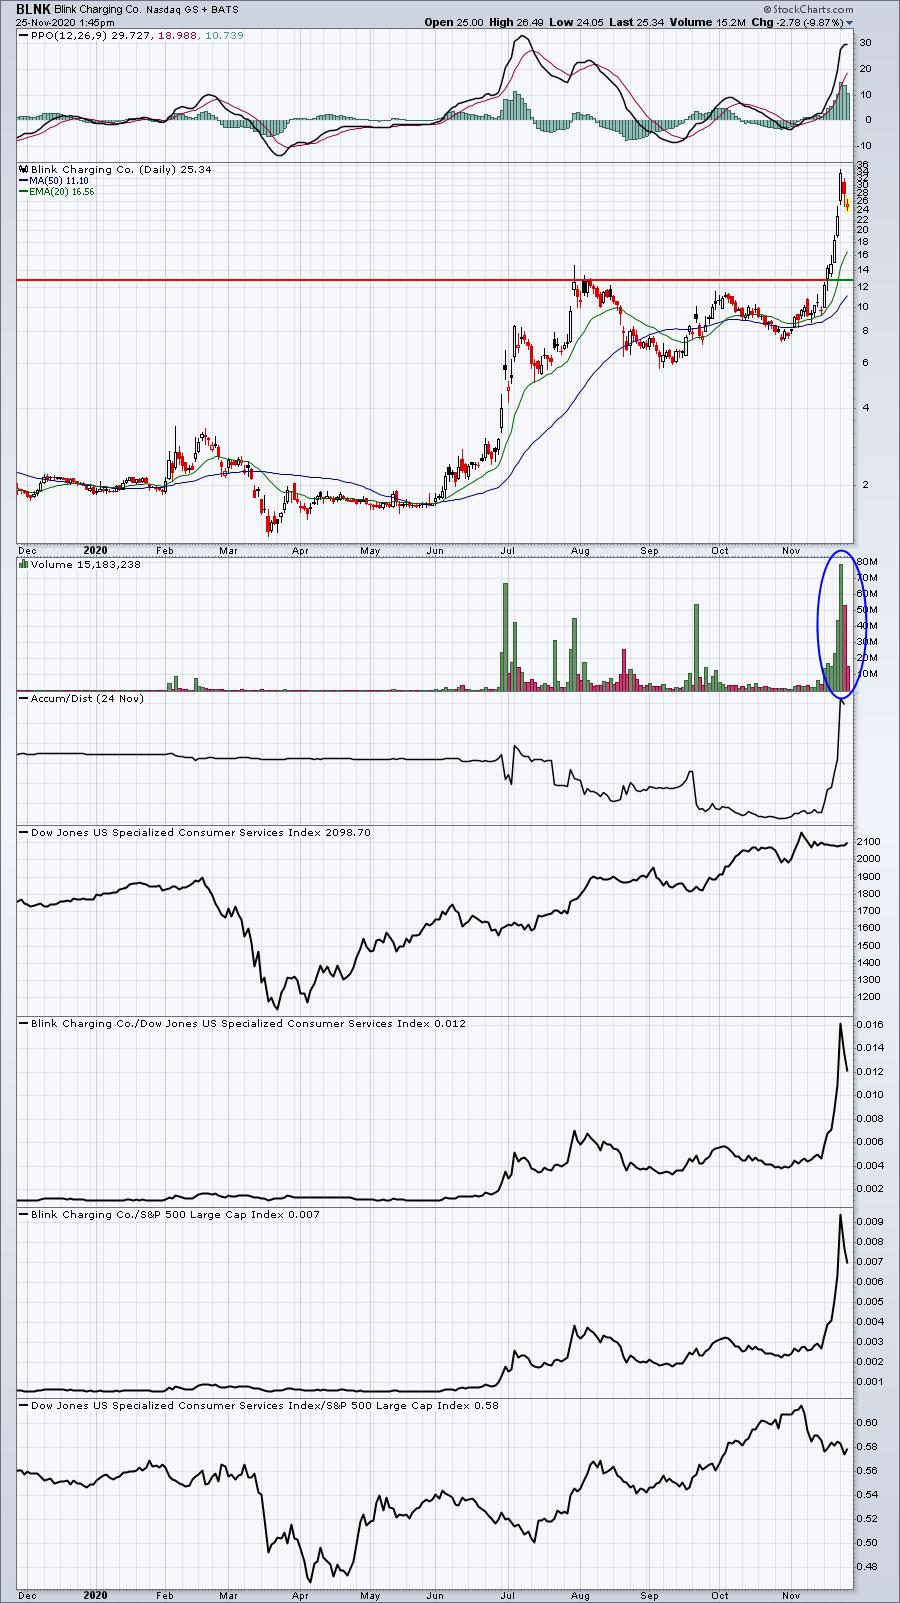
Here are current charts of the top 3:
BLNK:
REV:
JMIA:
Trading short squeeze candidates takes a trader with a much higher risk tolerance. These stocks can move very quickly in both directions. If you are inexperienced trading stocks with high short interest, consider starting out with a small number of shares so that the volatility doesn't turn you sour towards these types of trades. I like trading short squeeze candidates because it means there are guaranteed buyers ready to push that "buy" button. It's the reason we see meteoric rises in these stocks from time to time.
High volume is one indication of a short squeeze. As some short sellers begin to cover, it almost forces other short sellers to do the same, unwinding massive short positions like a rubber band.
Earnings Reports
Here are the key earnings reports for the next two days, featuring stocks with market caps of more than $10 billion. I also include a few select companies with market caps below $10 billion. Finally, any portfolio stocks that will be reporting results are highlighted in BOLD. If you decide to hold a stock into earnings, please understand the significant short-term risk that you are taking. Please be sure to check for earnings dates for any companies you own or are considering owning.
Wednesday, November 25:
DE, DOOO, FRO
Friday, November 27:
None
Economic Reports
October durable goods: +1.3% (actual) vs. +0.9% (estimate)
October durable goods ex-transports: +1.3% (actual) vs. +0.3% (estimate)
Q3 GDP (2nd Estimate): 33.1% (actual) vs. 33.1% (estimate)
Initial jobless claims: 778,000 (actual) vs. 730,000 (estimate)
October new home sales: 999,000 (actual) vs. 975,000 (estimate)
November consumer sentiment: 76.9 (actual) vs. 77.2 (estimate)
October personal income: -0.7% (actual) vs. +0.1% (estimate)
October personal spending: +0.5% (actual) vs. +0.4% (estimate)
FOMC minutes to be released at 2:00pm ET
Happy trading!
Tom