
EB Daily Market Report - Wednesday, December 2, 2020
Executive Market Summary
- Futures were under pressure overnight, though it appeared we'd open less than 1% lower, which we did
- Our major indices have recovered and trade very near their flat lines
- Energy (XLE, +4.17%) is the clear leader among sectors as most areas are lower today
- Consumer staples (XLP, -0.98%) lead the sector weakness, followed by other defensive sectors as well
- Communication services (XLC, +0.90%) is the second best sector, led by internet stocks ($DJUSNS, +1.13%)
- Drug retailers ($DJUSRD, +3.01%) and health care providers ($DJUSHP, +1.72%) are strong today, as WAB and UNH are among the Dow Jones' best performers
- Network Appliance (NTAP, +10.54%) reported better-than-expected quarterly results and is leading the S&P 500
- The 10-year treasury yield ($TNX) is up 2 basis points to 0.95%
Market Outlook
It's hard to say what news has been the best news. Clearly, the vaccine news was awesome. But I'm talking about technical developments on the charts. One very positive development has been the back seat that the defensive sectors have taken. They're moving higher, but they're not keeping up. That's a hallmark of a secular bull market advance. Here's the chart for visualization:
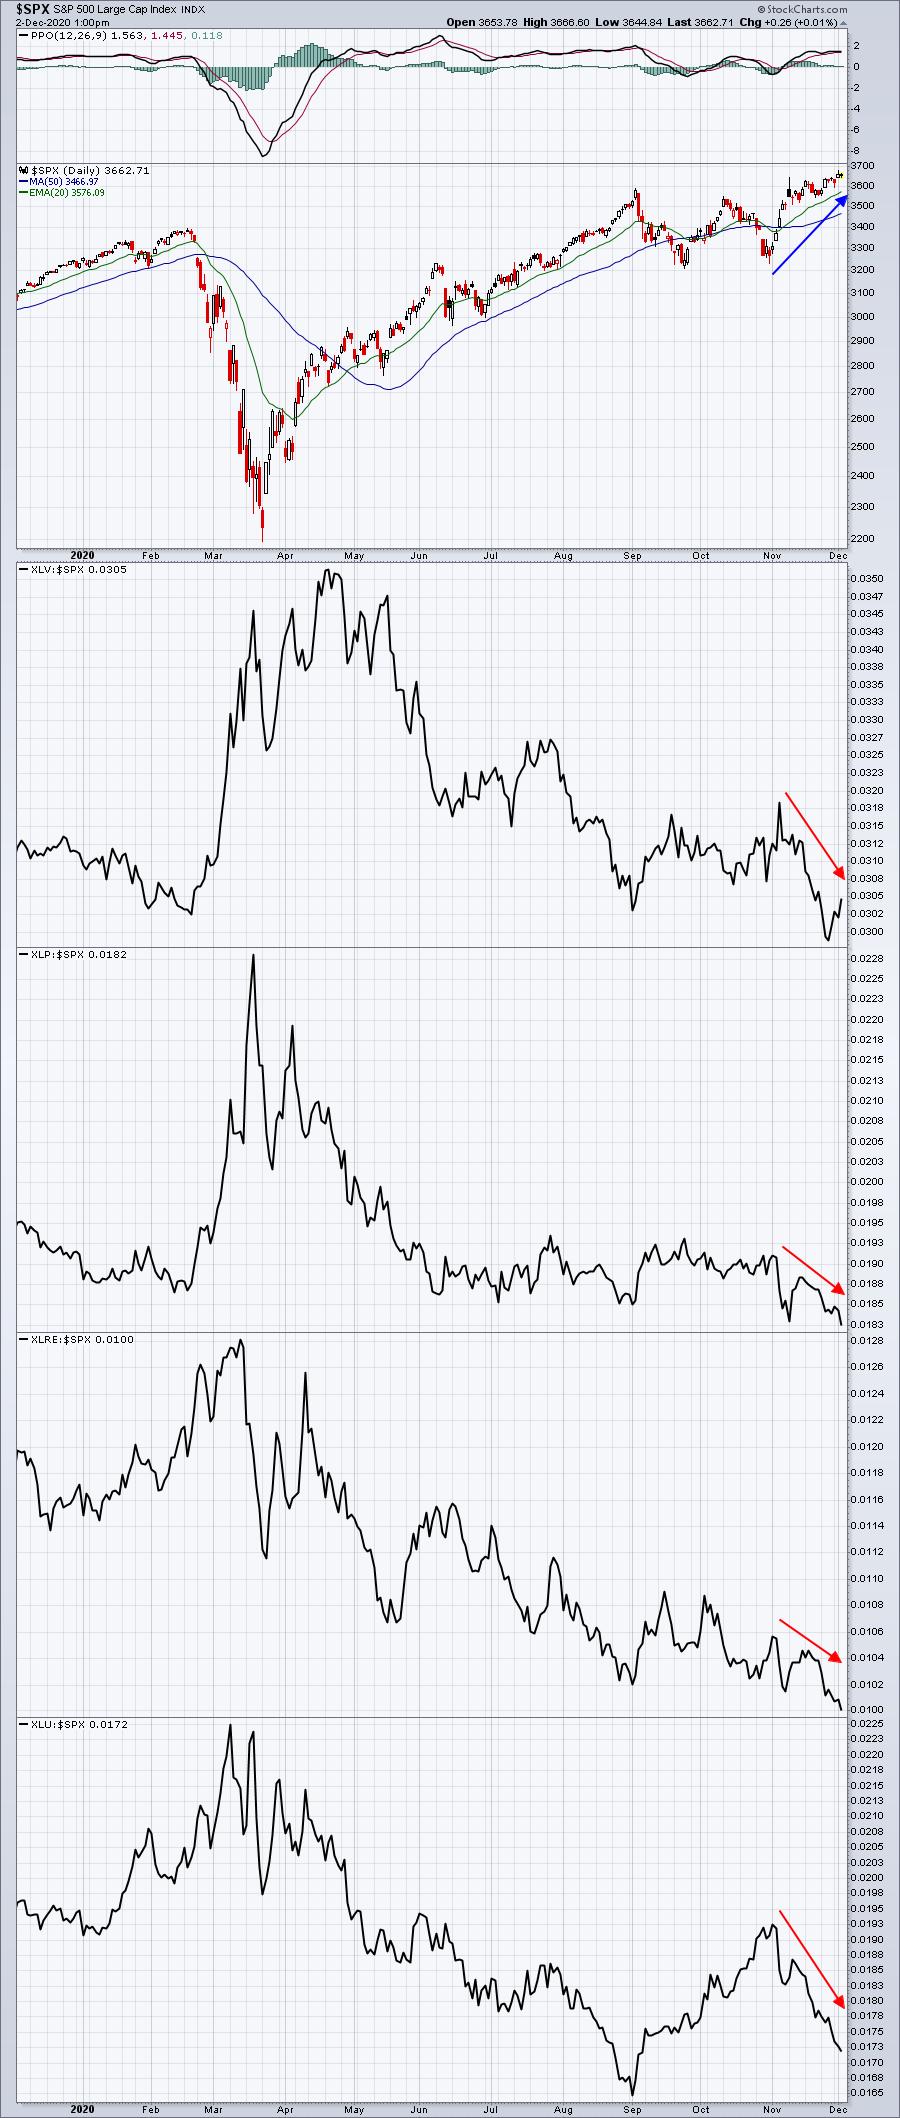
Where I grow concerned is when defensive groups are showing leadership as the S&P 500 breaks to all-time highs. That signals the type of rotation that leads to a market reversal. Instead, we're see very aggressive market rotation and that signals to me that this rally will be sustainable into the foreseeable future, with pullbacks along the way of course.
Sector/Industry Focus
Energy (XLE) was a key focus during the big November rally and for good reason. It's exploded higher. But, even if the XLE performs well over the next few years, I don't believe it will be straight up. We'll have big resistance tests along the way and we'll also want to watch key support tests during selloffs. The following is a weekly chart to illustrate some key levels I'll be watching on the XLE:
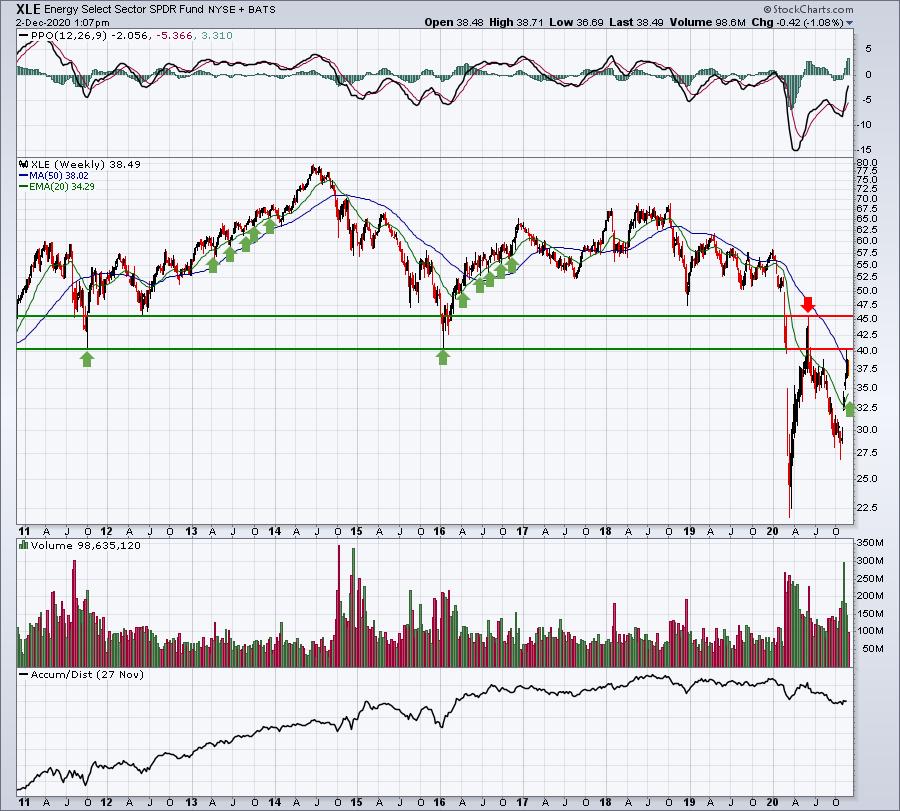
I don't feel the need to rush into the XLE. It was at 80 in 2014. After this monstrous month, it resides below 40. 6 years later and a 50% haircut. Trying to time the XLE rallies has been a bit like trying to time the rain in Southern California. When a sector, industry group, or stock has underperformed for a long time like the XLE, I will only enter a long position when I can manage my risk to a negligible level. If you study the above XLE uptrends, you'll note that the rising 20 week EMAs have provided solid reward/risk entry points. Let the momentum settle down for a period and pick the XLE up as it nears its rising 20 week EMA. It will inevitably happen and that's really about the only time I'd consider a position here.
ChartLists/Strategies
Here are a few stocks that looked interesting to me today:
Strong Earnings ChartList (SECL) - RingCentral (RNG):
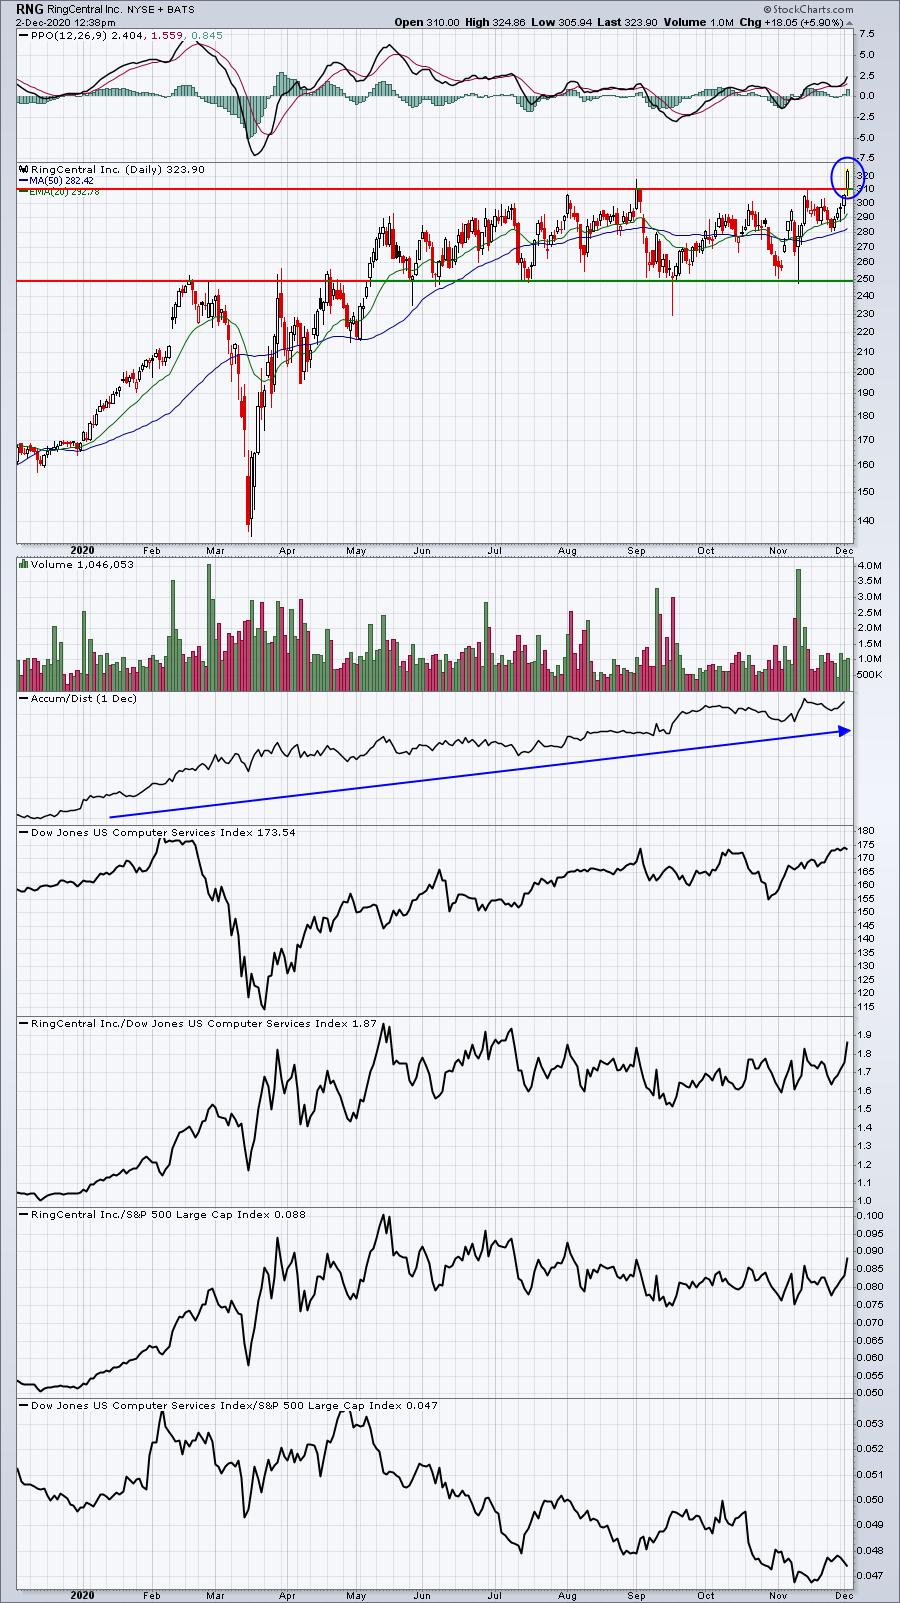
Nice breakout after a lengthy period of consolidation. Looks good. I'd now watch the rising 20 day EMA as major support going forward.
SECL - Upwork (UPWK):
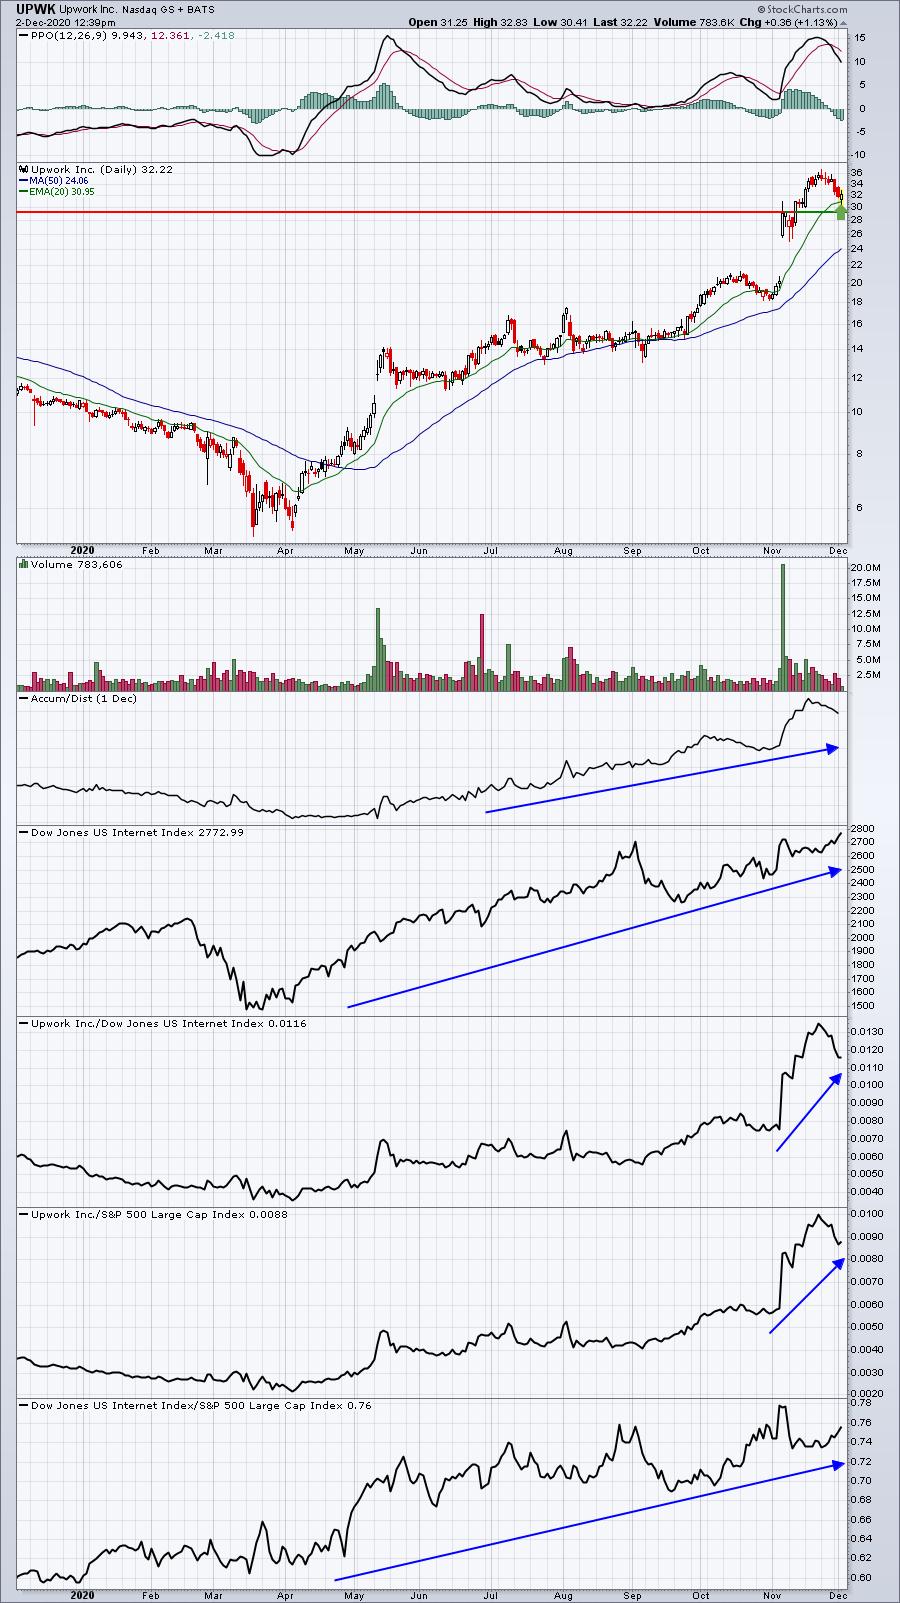
UPWK hit 36.66 a little over a week ago before seeing some profit taking. Buyers returned at the 20 day EMA, although there's also price support at 29.26 if it turns lower one more time. UPWK is a portfolio stock and one of my favorites in the internet space ($DJUSNS).
Short Squeeze ChartList (SSCL) - Jumia Technologies (JMIA):
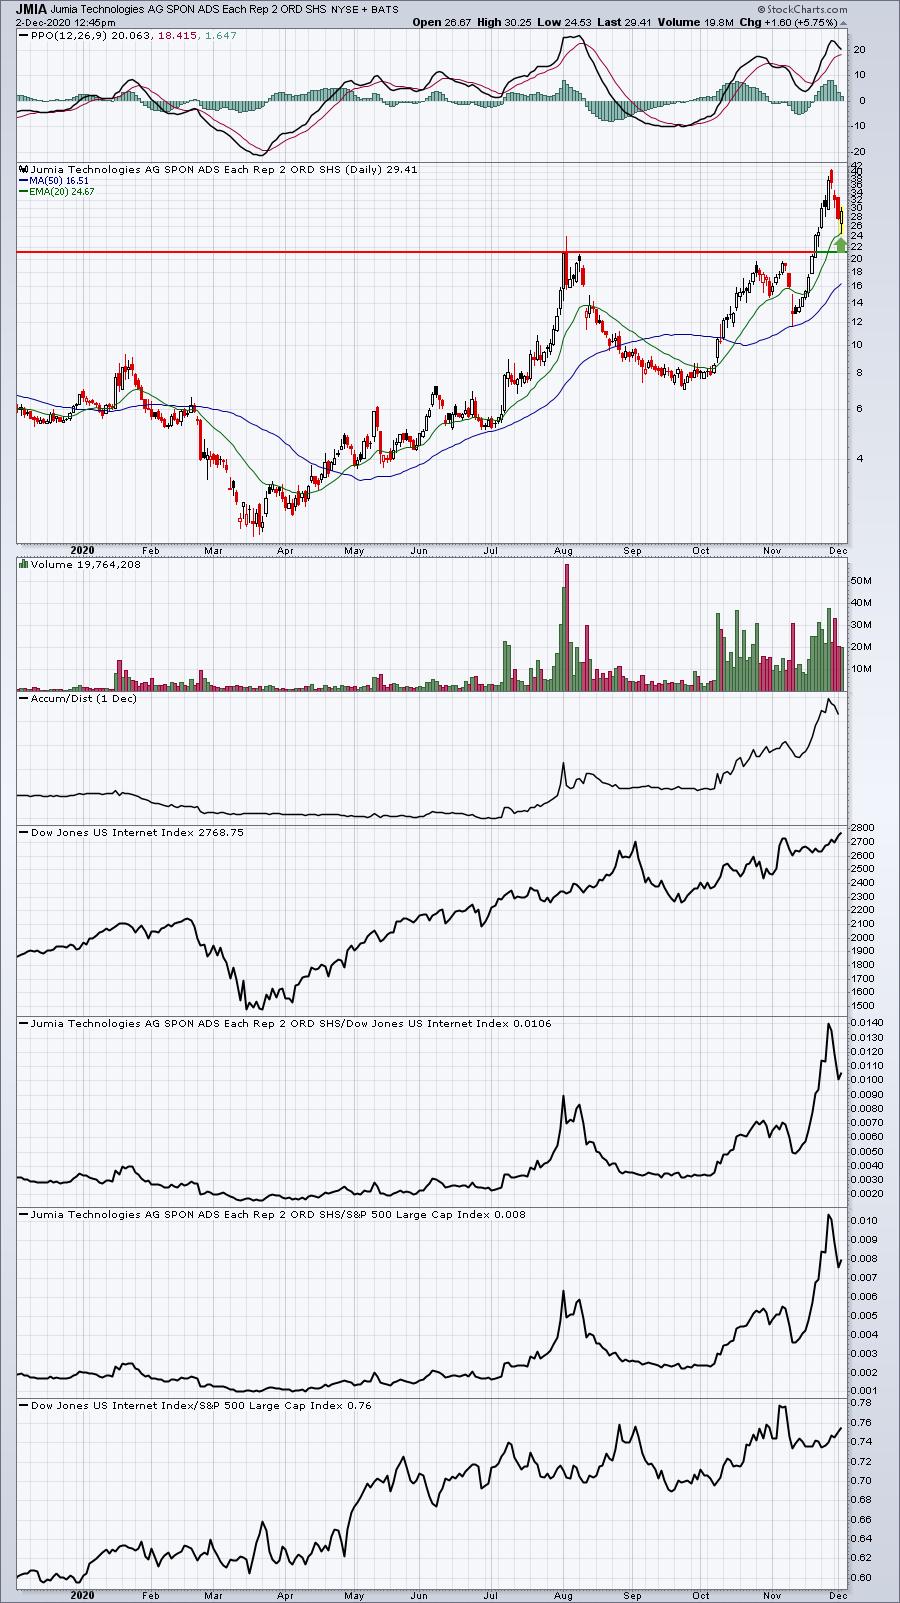
Hindsight's always 20/20, but JMIA is a perfect illustration why I look for 20 day EMA tests. On Friday, with JMIA trading above 40, what was the likelihood that JMIA would fall 16 bucks in 3 days to test its rising 20 day EMA. But that's what happens with stocks. The stock market is so inefficient in the short-term, but if you like short-term trading, this is what you want to try to benefit from. I do not own JMIA, but my strategy if I had traded it, would likely have been to buy at two levels - first at that rising 20 day EMA and second at price support at 21. It's been quite a rally off that initial 20 day EMA test.
Earnings Reports
Here are the key earnings reports for the next two days, featuring stocks with market caps of more than $10 billion. I also include a few select companies with market caps below $10 billion. Finally, any portfolio stocks that will be reporting results are highlighted in BOLD. If you decide to hold a stock into earnings, please understand the significant short-term risk that you are taking. Please be sure to check for earnings dates for any companies you own or are considering owning.
Wednesday, December 2:
RY, SNOW, SNPS, CRWD, SPLK, OKTA, ZS, ESTC, FIVE, PVH, DSGX, SMTC, PDCO, GES
Thursday, December 3:
TD, DG, DOCU, CM, MRVL, KR, COO, ULTA, DCI, OLLI, CLDR, CBRL, PD, YEXT, SIG, MIK, ZUO, DOMO, ZUMZ
Economic Reports
November ADP employment report: 307,000 (actual) vs. 420,000 (estimate)
Beige book due out at 2:00pm ET
Happy trading!
Tom