
EB Daily Market Report - Thursday, December 3, 2020
Executive Market Summary
- Futures were mixed overnight and we're seeing slightly positive action thus far today
- Energy (XLE, +1.81%), industrials (XLI, +0.83%), and real estate (XLRE, +0.74%) are showing leadership
- Utilities (XLU, -0.85%) and health care (XLV, -0.29%) are the two primary laggards, although 6 of the 11 sectors are down today
- Airlines ($DJUSAR, +6.28%) and recreational services ($DJUSRQ, +5.15%) are among the best industries
- Crude oil ($WTIC, +1.06%) is nearing $46 per barrel, close to an 8-month high
- The 10-year treasury yield ($TNX) is down 3 basis points to 0.92%; banks ($DJUSBK, -0.22%) are lower today as a result
- Aerospace ($DJUSAS, +4.26%) is benefiting from strength in Boeing (BA, +6.76%) as the DJUSAS clears its June high
Market Outlook
It makes sense to be a little nervous about the market when the equity only put call ratio ($CPCE) prints readings at 0.4 every day, but let me say this. The CPCE has always been much better at calling market bottoms than market tops. Fear is a much easier emotion to quantify and it's quite predictable. Nearly every major bottom in the stock market has formed the same way - with CPCEs shooting stratospherically higher. The extreme low readings, however, do not always mark tops. Market makers can protect themselves by simply buying the stock when they sell calls to traders. That strategy continues pushing stocks higher, despite the demand in calls. The time to truly be careful with low CPCE readings is options expiration week, or in the few days following options expiration Friday. This month, that falls on Friday, December 18th. When the CPCE is extremely low during options expiration week, there is financial incentive for market makers to pull the proverbial "carpet out from under" traders on the call side, eliminating billions of dollars of net in-the-money call premium. We've seen it in recent months and we've pointed it out ahead of time. Nonetheless, it's still important to realize that a short-term reckoning could be approaching. Here's the 5-day moving average of the CPCE:
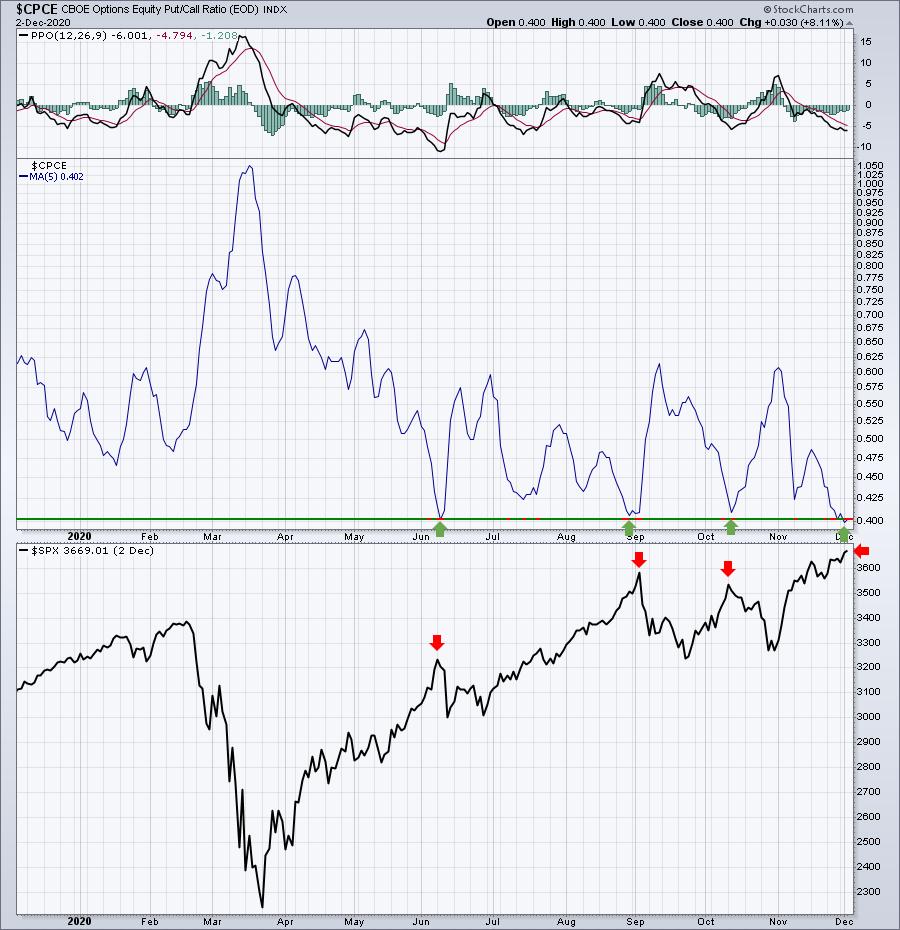
Make no mistake, we could see a pullback at any time. Just remember that none of these CPCE topping "signals" resulted in long-term tops. They're simply temporary signs that let us know that the "gambling crowd" thinks the market can't go anywhere but up. That usually doesn't end well.
I love the market and all the long-term signals that I'm seeing, but we cannot avoid necessary pullbacks from time to time. If the current uptrend remains with us for another 7-10 days, things will get very interesting during options expiration week.
Sector/Industry Focus
First, let me say that software ($DJUSSW) is not a fan of December. It acts more like The Scrooge. Here's the seasonal tendency of software vs. the S&P 500 over the past 7 years during December:
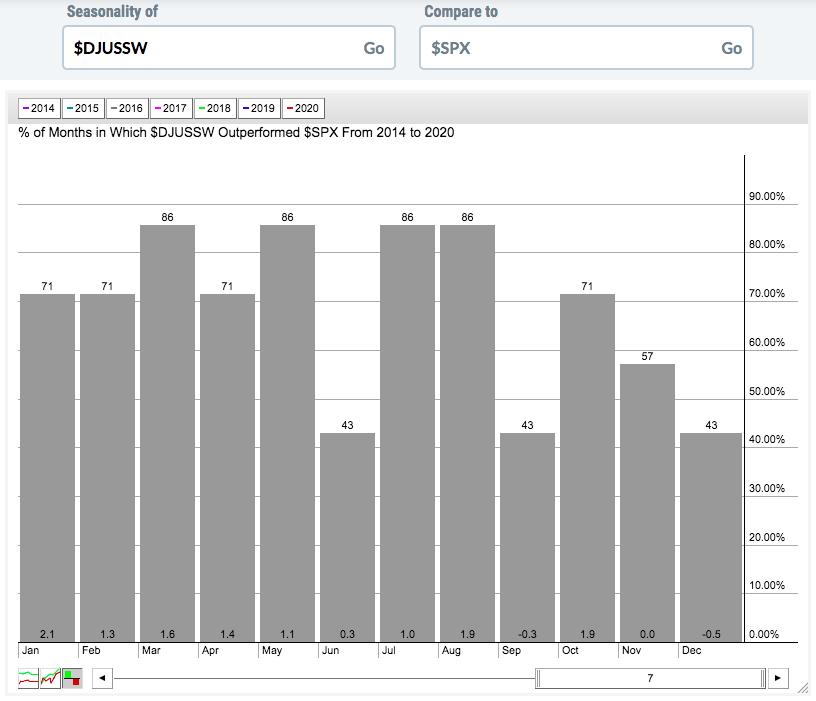
I picked the last 7 years because that's when the S&P 500 finally cleared its double top that was established in 2000 and tested in 2007. The 2013 breakout represented the beginning of a long-term secular bull market. Software has been a major leader throughout this secular bull market, but as you can see above, December, September, and June have been the weakest months, with December the absolute weakest. Based on this, I wouldn't be surprised to see the DJUSSW simply consolidate throughout December, saving their next absolute breakout for January. Software has been very strong in the first calendar half of the year. Here's the absolute chart for software that shows a possible symmetrical triangle (bullish continuation pattern) in play:
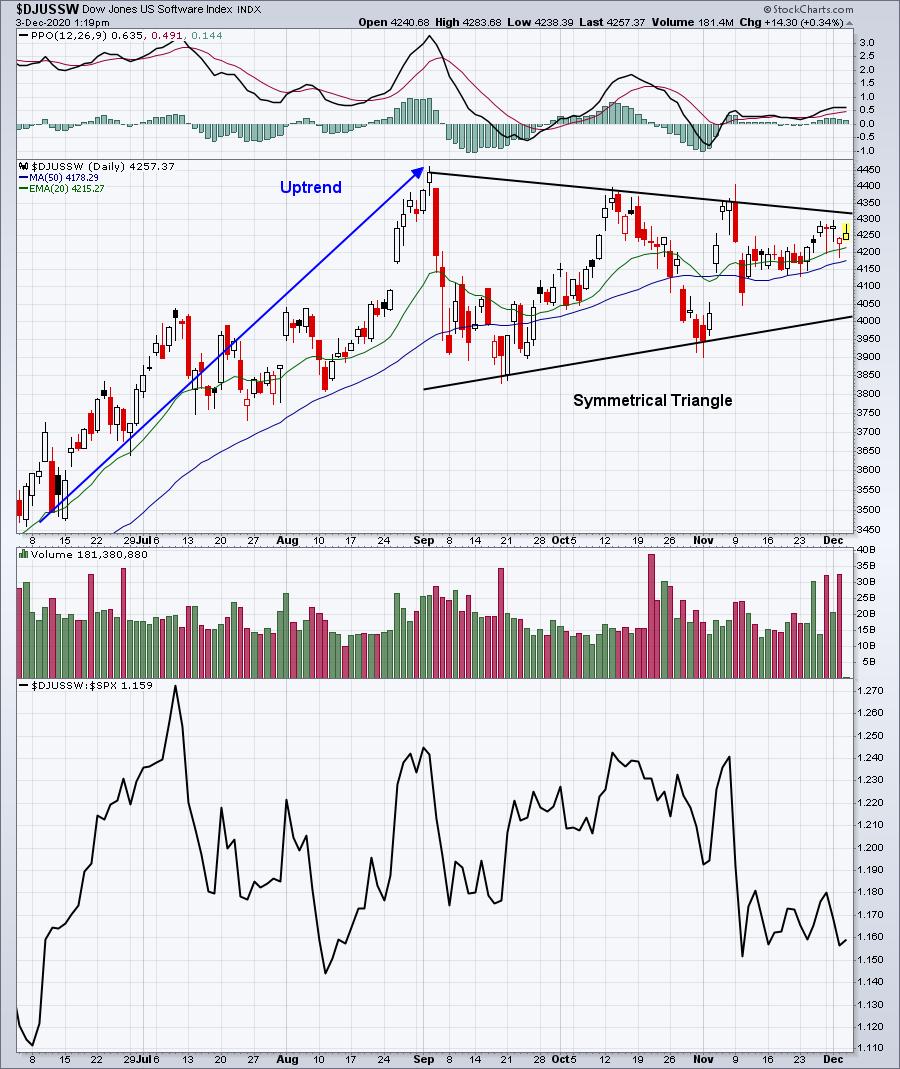
Many traders are already getting very frustrated with this group and it's showing in many component stocks showing deterioration in their relative strength lines. Microsoft (MSFT), believe it or not, just set a new 52-week relative low vs. its software peers. That won't last forever. In fact, I fully expect we'll see MSFT lead again in 2021. But for now, trading software names may require more patience than many traders have.
My point here is that we need to lower our expectations for software stocks.....temporarily. Like Arnold in The Terminator, they'll be backkkk.
ChartLists/Strategies
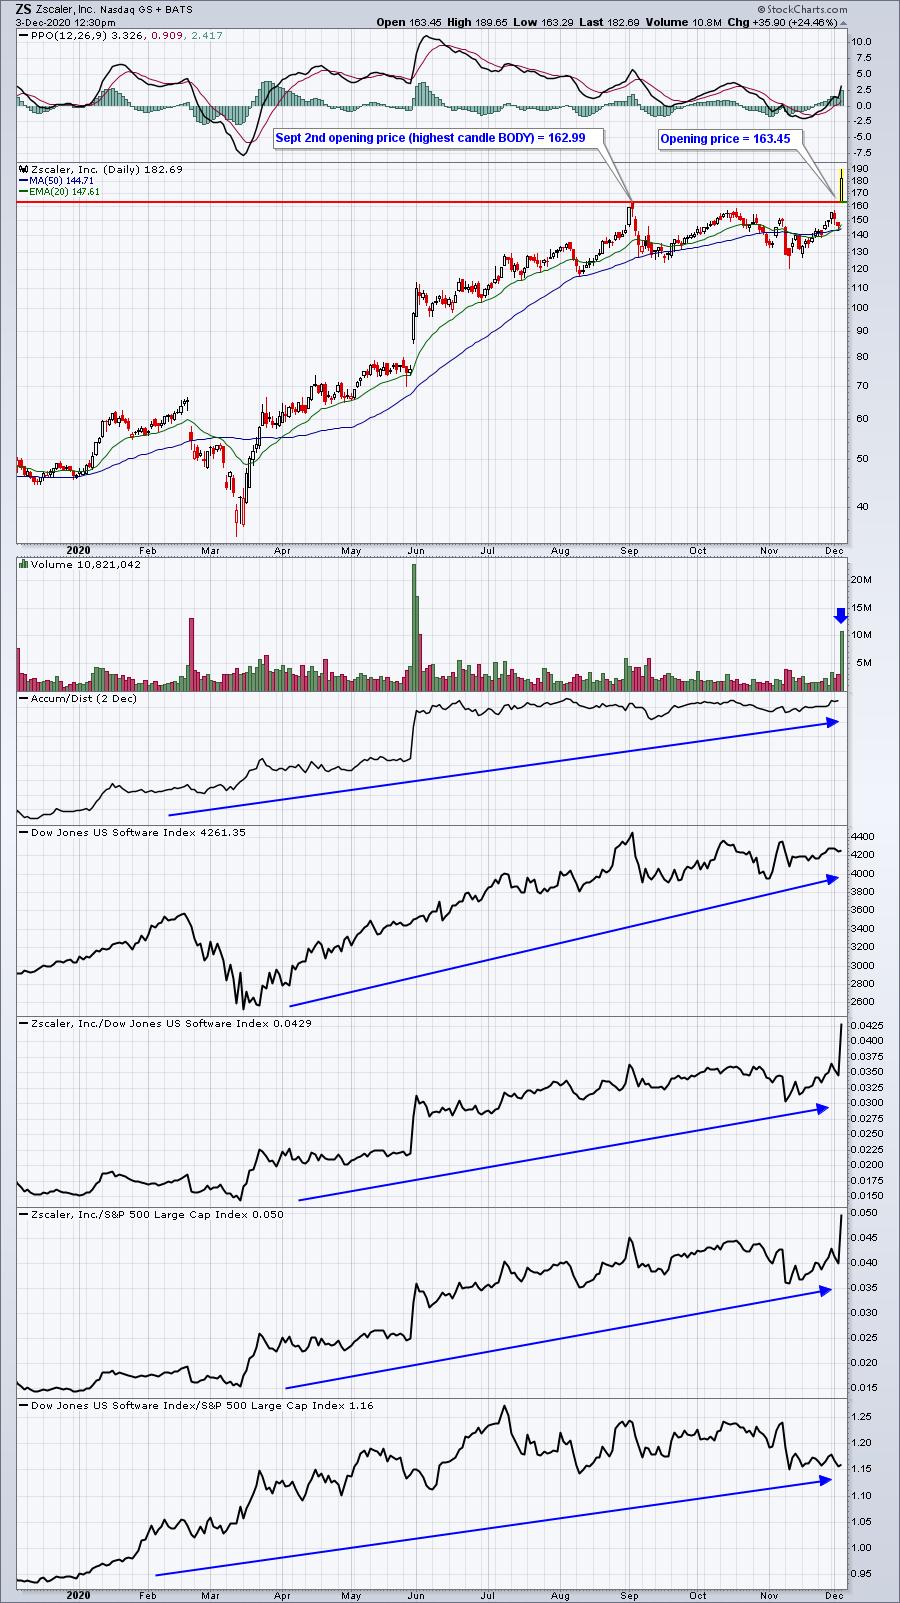
A centerpiece of our trading strategy at EarningsBeats.com is trading earnings gaps. I believe the opening price - to the penny - can be extremely important in the signal that it sends. When a stock gaps higher due to earnings and it clears the highest open or close (candle BODY), I believe its odds of moving higher are much greater than when we see a gap higher, but below its previous high open or close (candle BODY). Here are today's examples of the signals I receive from this trading behavior:
Bullish - ZS gaps ABOVE prior candle BODY highs:
Bearish (not really bearish, maybe less bullish would be the right description) - OKTA gaps higher, but BELOW prior candle BODY highs:
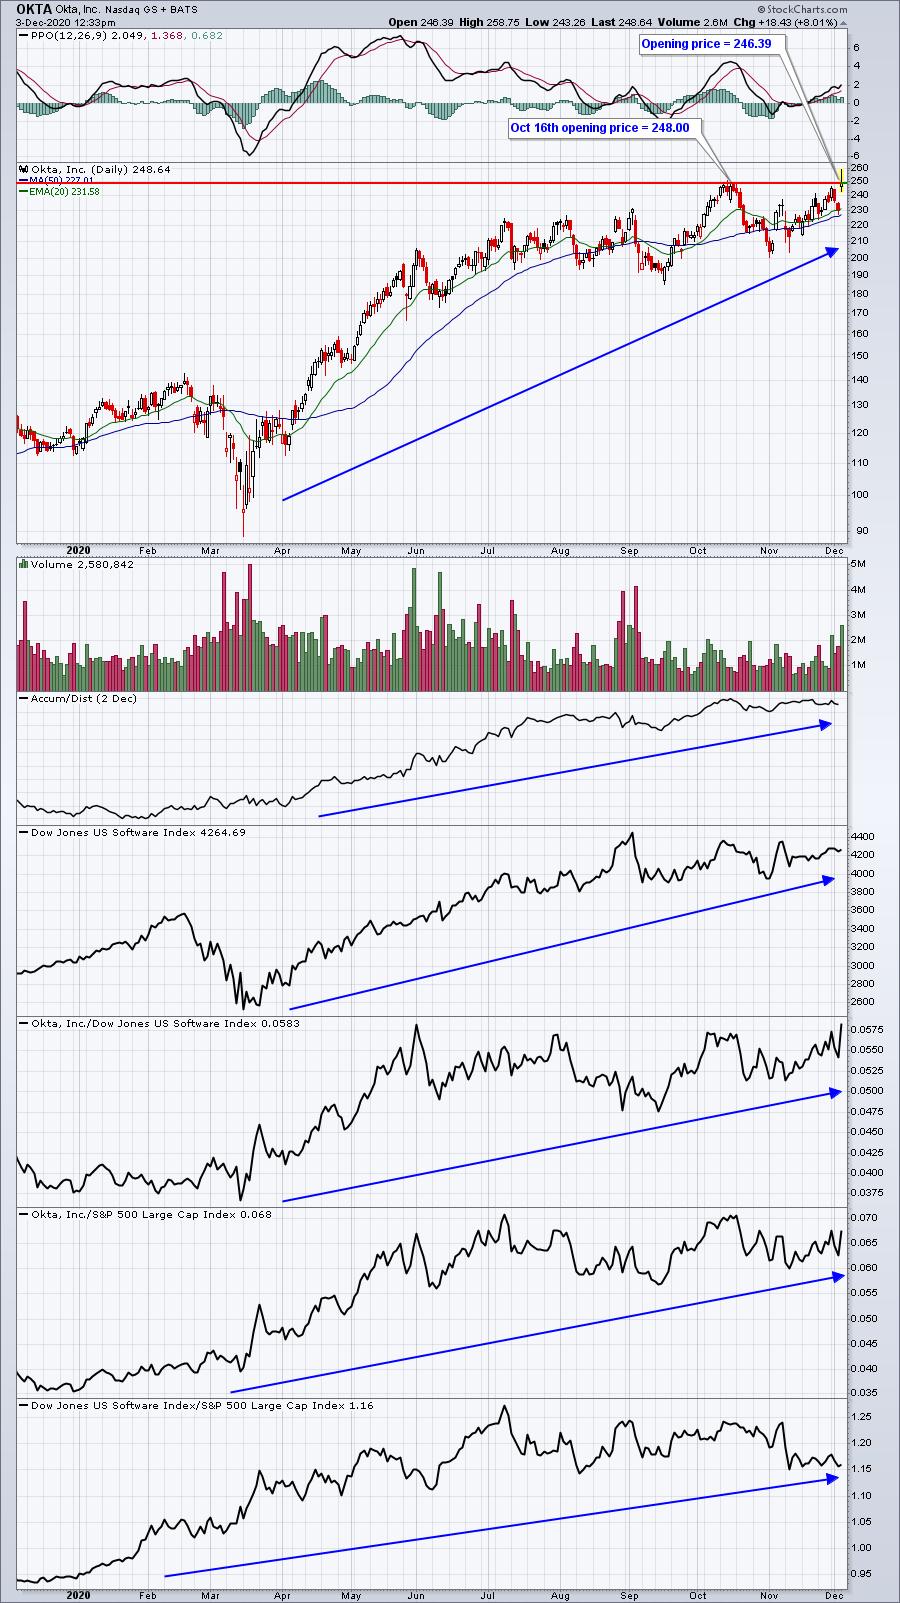
In this case, ZS opened with a breakout and buyers poured in. OKTA also opened much higher, but below key resistance. After an initial push higher, that move has failed (so far). Let me be clear - I like both of these software stocks. Their quarterly results were strong, but the way each trades in the short-term can sometimes be heavily impacted by "where" they open and then how they trade the balance of the day. The reason is simple and it gets back to the short-term inefficiencies of the market. When a company's results are viewed favorably, demand exceeds supply. There are more buyers than sellers. Market makers see this imbalance and account for it by raising the price. The imbalance results in market makers having to take short positions as they sell the shares necessary to provide liquidity. But if you understand one thing, please understand that market makers rarely lose money. That's why MOST stocks will gap higher and then "fill their gap", which means the price of the security will return to their prior close (before the earnings gap higher). If a stock gaps higher, with market makers on the short side, and keeps rising, that's a very good sign of nearly insatiable demand. Many times the TOP of gap support becomes major support, not the bottom of gap support.
Looking at ZS above, if it finishes well above its opening price today, then that opening price is the support I'd use to buy the stock on any future pullback. OKTA, on the other hand, has a much better chance of revisiting its Wednesday close if it doesn't break out today.
Earnings Reports
Here are the key earnings reports for the next two days, featuring stocks with market caps of more than $10 billion. I also include a few select companies with market caps below $10 billion. Finally, any portfolio stocks that will be reporting results are highlighted in BOLD. If you decide to hold a stock into earnings, please understand the significant short-term risk that you are taking. Please be sure to check for earnings dates for any companies you own or are considering owning.
Thursday, December 3:
TD, DG, DOCU, CM, MRVL, KR, COO, ULTA, DCI, OLLI, CLDR, CBRL, PD, YEXT, SIG, MIK, ZUO, DOMO, ZUMZ
Friday, December 4:
HDS, BIG
Economic Reports
Initial jobless claims: 712,000 (actual) vs. 780,000 (estimate)
November PMI composite: 58.6 (actual) vs. 57.9 (estimate)
November ISM services index: 55.9 (actual) vs. 56.0 (estimate)
Happy trading!
Tom