
EB Daily Market Report - Friday, December 4, 2020
Save The Date!
Event: MarketVision 2021
Date: Saturday, December 19, 2020
Time: 9:00am - 2:00pm ET
More details will be coming soon!
ChartList Update
The Strong ETF ChartList (SETFCL) has been updated and a new link provided on our website. Given the strength in U.S. equities, I wanted to provide the "best of the best", so only ETFs with a SCTR above 90 (as of Tuesday) were considered. There are 29 ETFs on our current list, with breakdowns of sector allocation and Top 10 holdings on every chart. You can view and/or download this updated ChartList at your convenience.
The Strong Earnings ChartList (SECL) and Strong Future Earnings ChartList (SFECL) updates are nearly complete. I'm hoping to have those ready over the weekend and available to everyone on Monday morning, at the latest.
Executive Market Summary
- Futures pointed to an opening rally and that's what we've seen throughout much of the day
- Small caps ($SML, +2.30%) and mid caps ($MID, +1.67%) continue their recent outperformance, leading again today
- Energy (XLE, +4.66%) is easily the best performing sector with materials (XLB, +1.88%) a distant second
- Both are benefiting from a very weak dollar (UUP, +0.03%) that's attempting to end its recent slide
- Copper ($COPPER) has been on a tear over the past 5 weeks and that's a great technical signal for global equities
- Ulta Beauty (ULTA, -3.73%) did not impress investors with its latest quarterly earnings report, despite beating its bottom-line estimate; ULTA is the worst performer in the S&P 500
- The Dow Jones has moved comfortably back above 30000 as Caterpillar (CAT, +5.04%) breaks out and leads this index of conglomerates
- The 10-year treasury yield ($TNX) is up 5 basis points to 0.97%, despite a much weaker nonfarm payrolls number than expected
Market Outlook
While I believe we could see a 1-2% pullback at most any time, I like the slow, methodical push to the upside in the S&P 500. We've risen rather steadily over the past two weeks, but the hourly PPO has yet to crack the 0.5 level. That tells us it's been a rather boring climb. Bull markets LOVE "boring"! By looking at a 6-month hourly chart of the S&P 500, you can see just how boring this advance has been:
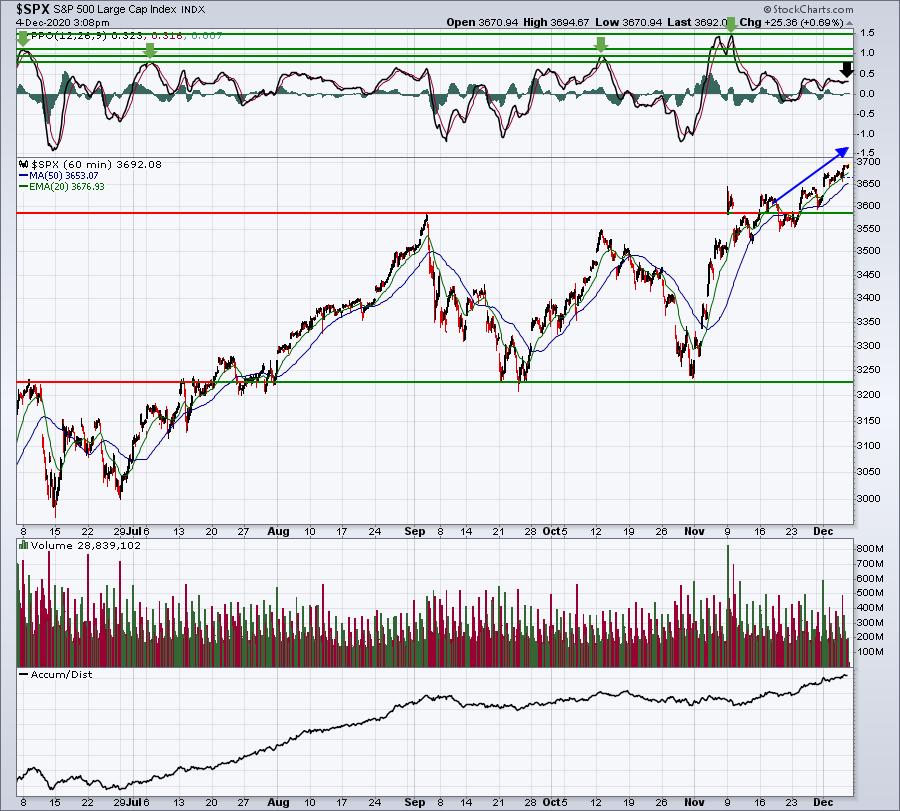
The breakout after consolidation is nice and I see this rally continuing. The green arrows above mark the 4 highest levels of hourly momentum over the past 6 months. The black arrow highlights where we are right now. The gains are not being accompanied by high bout of volatility. In fact, the VIX is at 20.73 and threatening to break below 20 for the first time since the pandemic began in February. Today's intraday low was 19.97.
I've read many accounts of market pundits saying that market participants are too bullish and using that as a contrarian indicator that a top is forming. Given the very high level of the VIX vs. history, I don't agree with at all. complacency truly begins to settle in when the VIX moves down to 10 or even just below it. We have a long ways to go before we reach that level - probably a good portion of 2021.
Sector/Industry Focus
Oil equipment & services ($DJUSOI, +7.04%) is leading energy higher today and the group is also testing a very key resistance level - its June 2020 high:
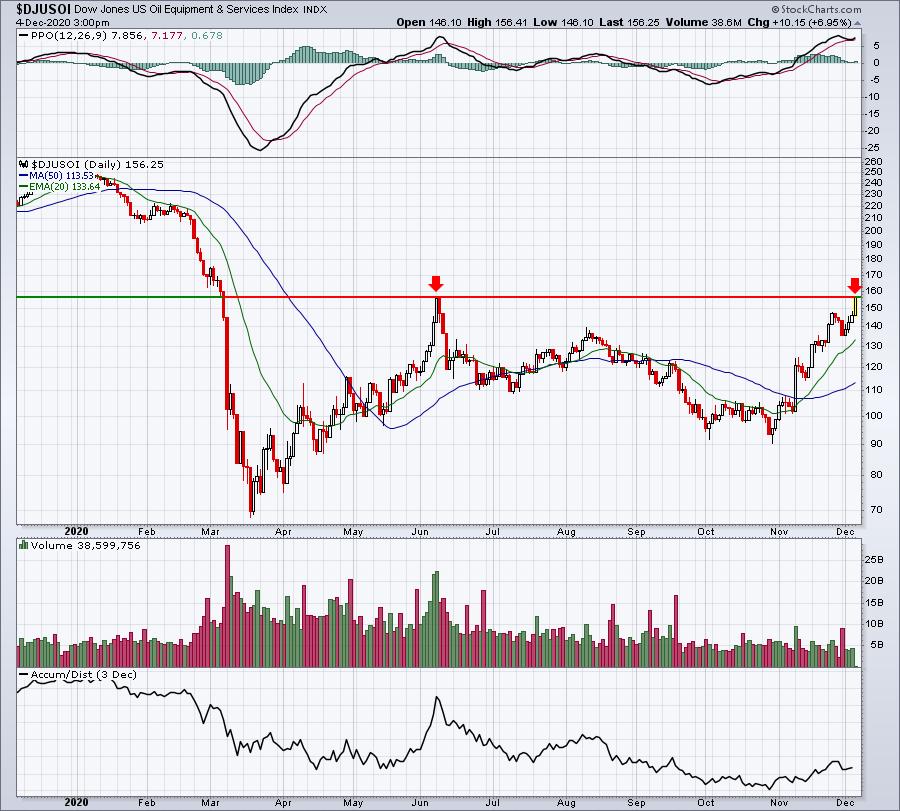
I currently have no positions in energy, but I'm pulling hard for this breakout. I want ALL sectors/industries participating in this secular bull market advance. The more the merrier! In the bottom panel, you can see that even the AD line is trying to get up off the floor. Signs in this area are clearly improving, but the longevity of any relative advance in this area has to be questioned until it can show sustainability.
ChartLists/Strategies
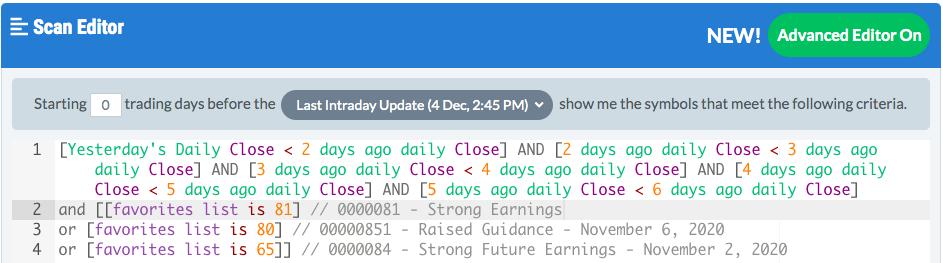
I decided to run a scan similar to the Downtrend Reversal scan on our website. The primary difference, however, was that I only wanted stocks that had CLOSED down for 5 straight days (prior to today). This is how the scan syntax was written:
10 stocks were returned:
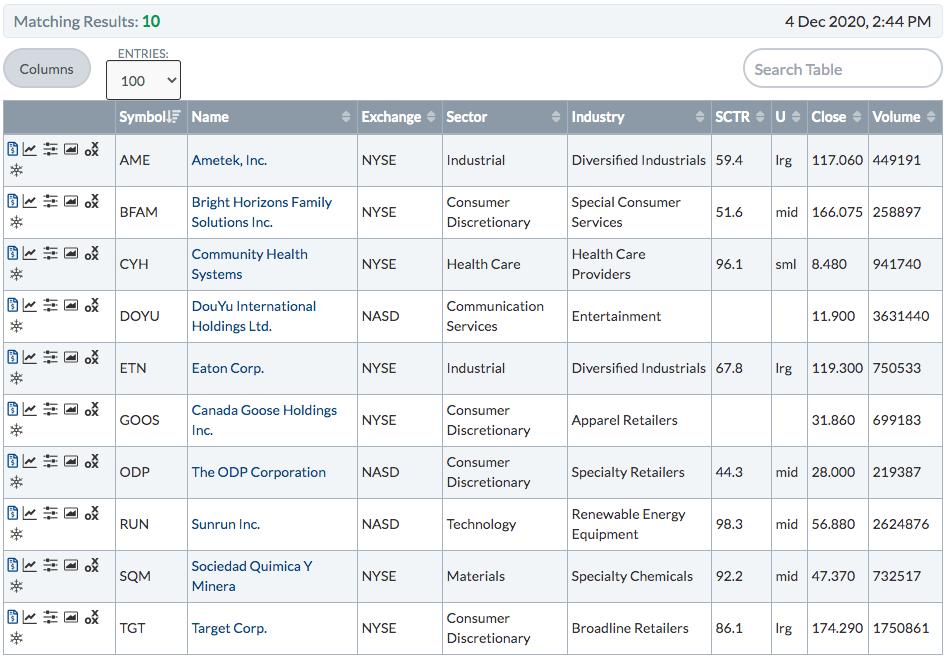
I much prefer to buy stocks after a period of selling, especially if they're at or nearing what I believe to be key support - whether it be moving average support, trendline support, price support, whatever.
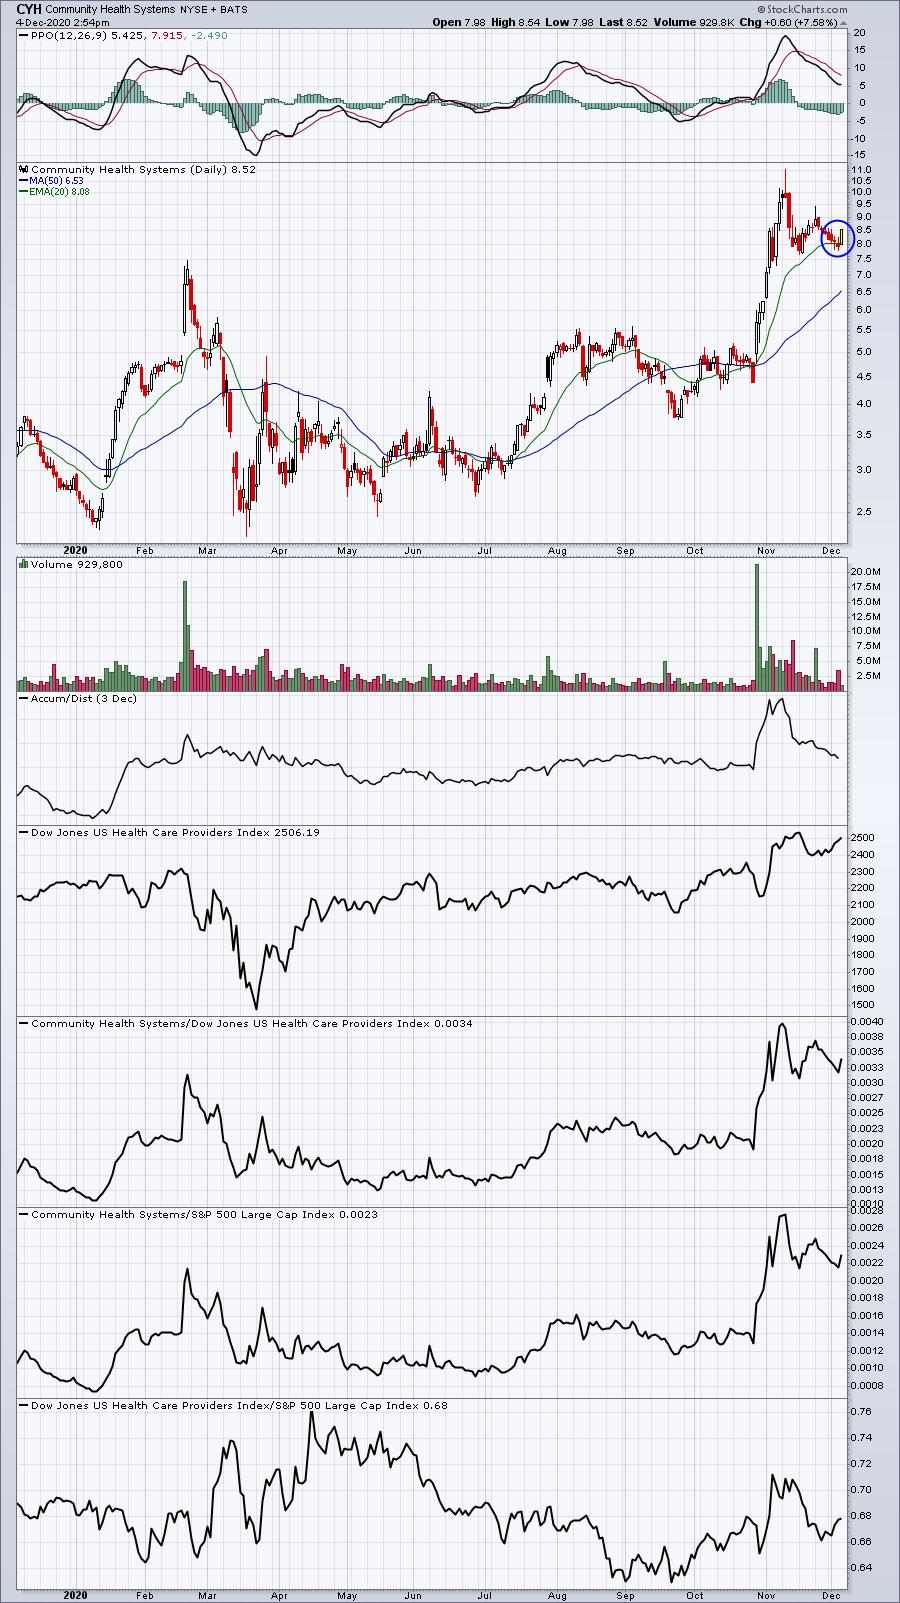
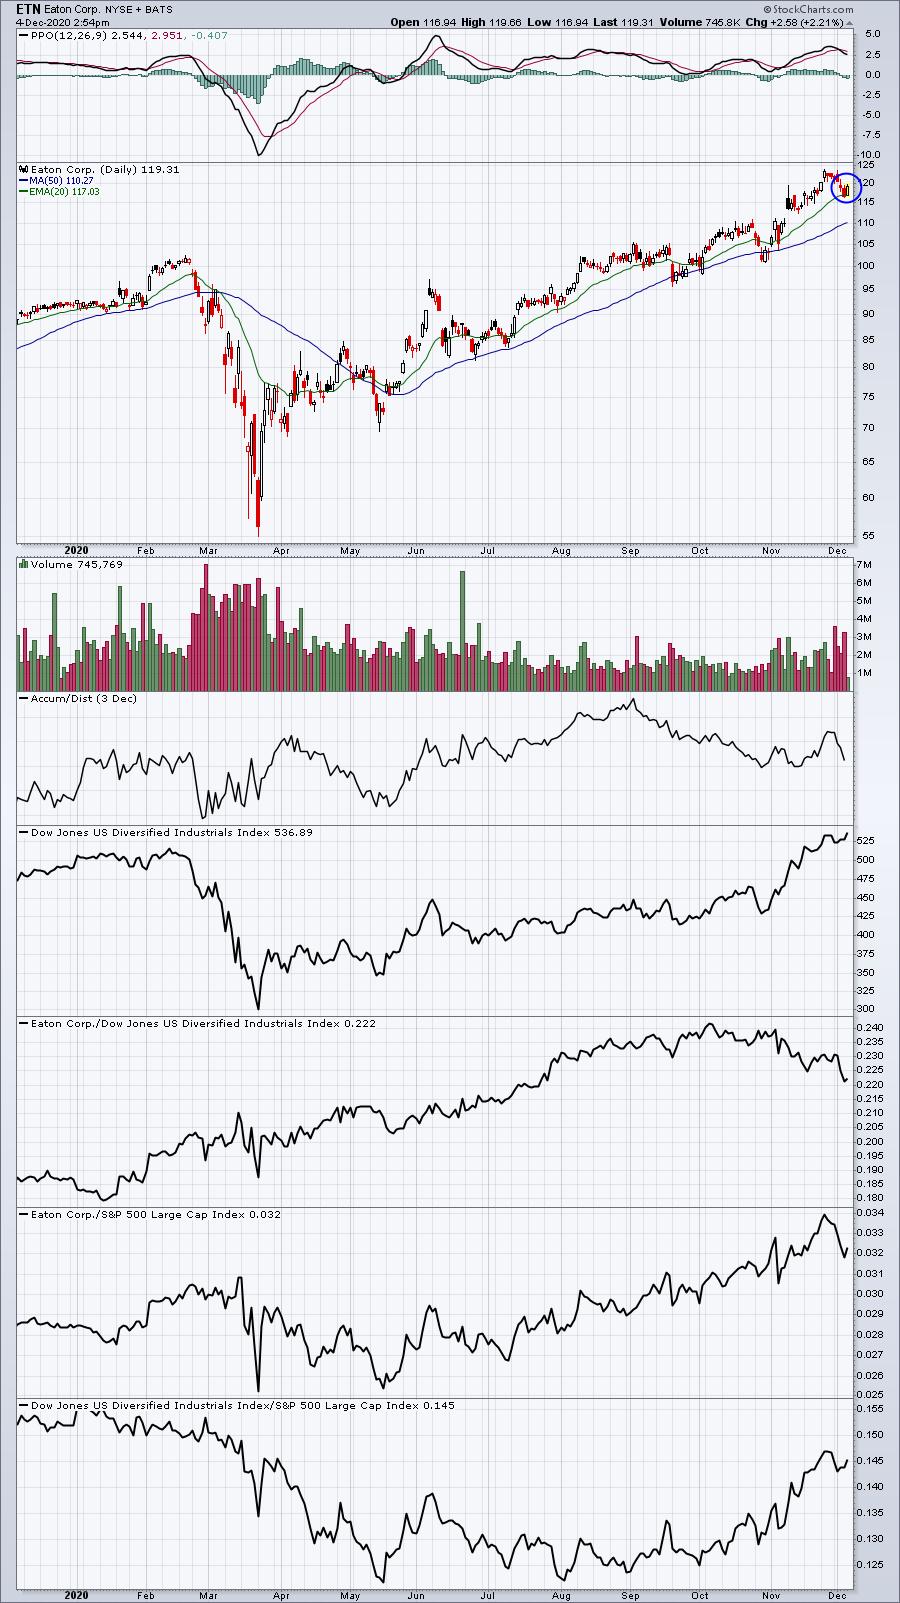
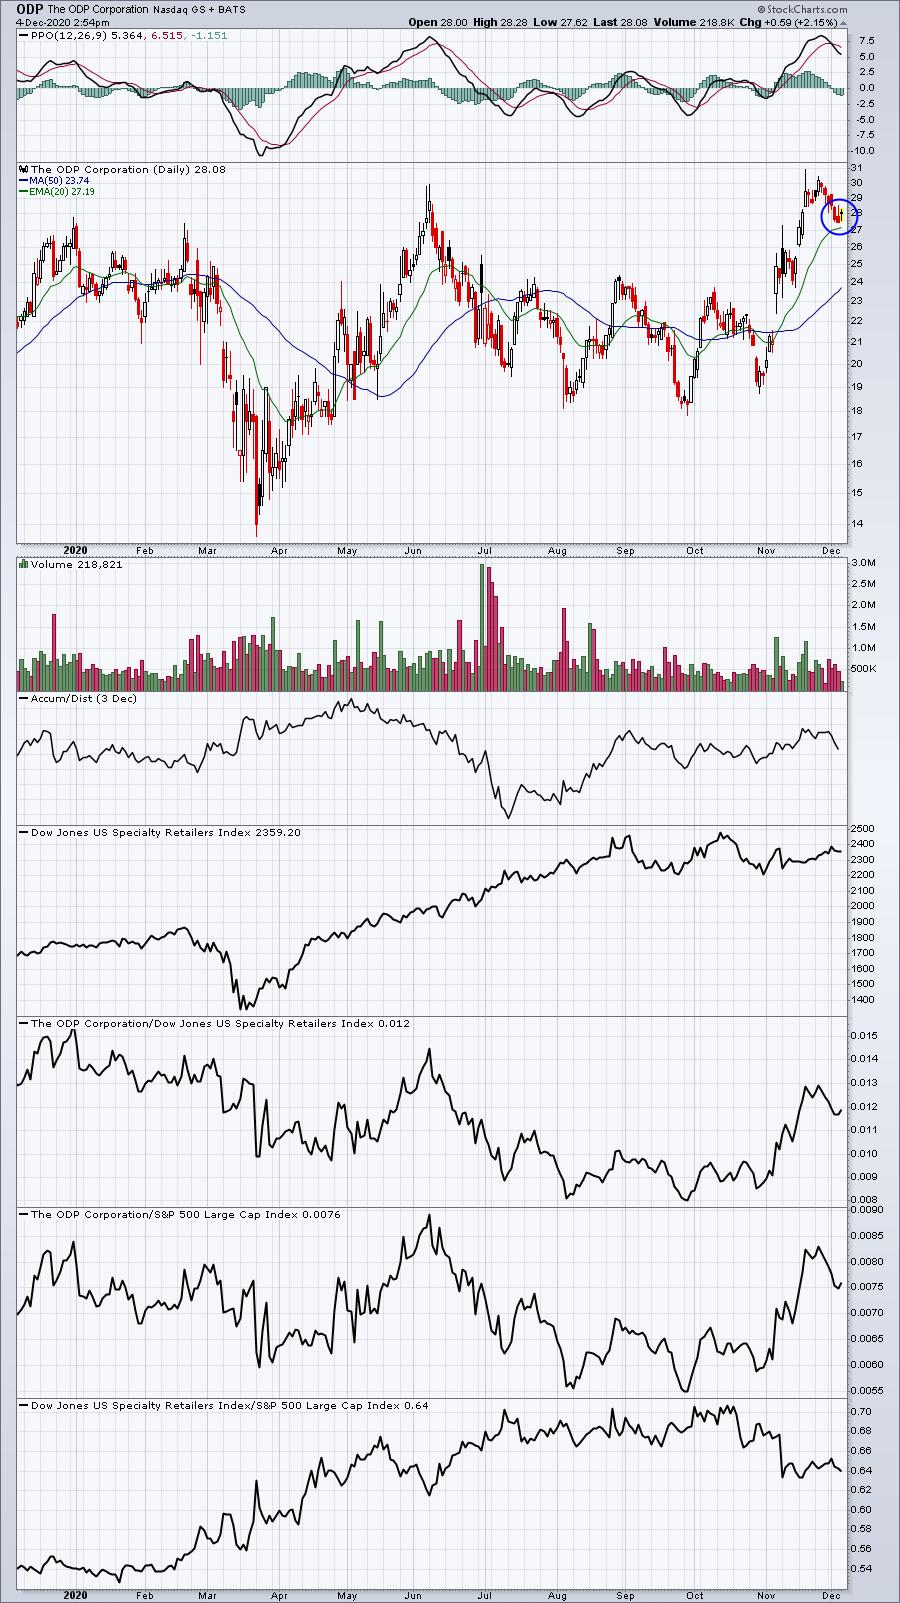
I thought CYH and ETN were both interesting because they were testing rising 20 day EMAs. Both are bouncing off those moving averages beautifully today. Here are those two charts plus two more on the list that I'd also consider for bounces off an upcoming 20 day EMA test.
CYH:
ETN:
ODP:
TGT:
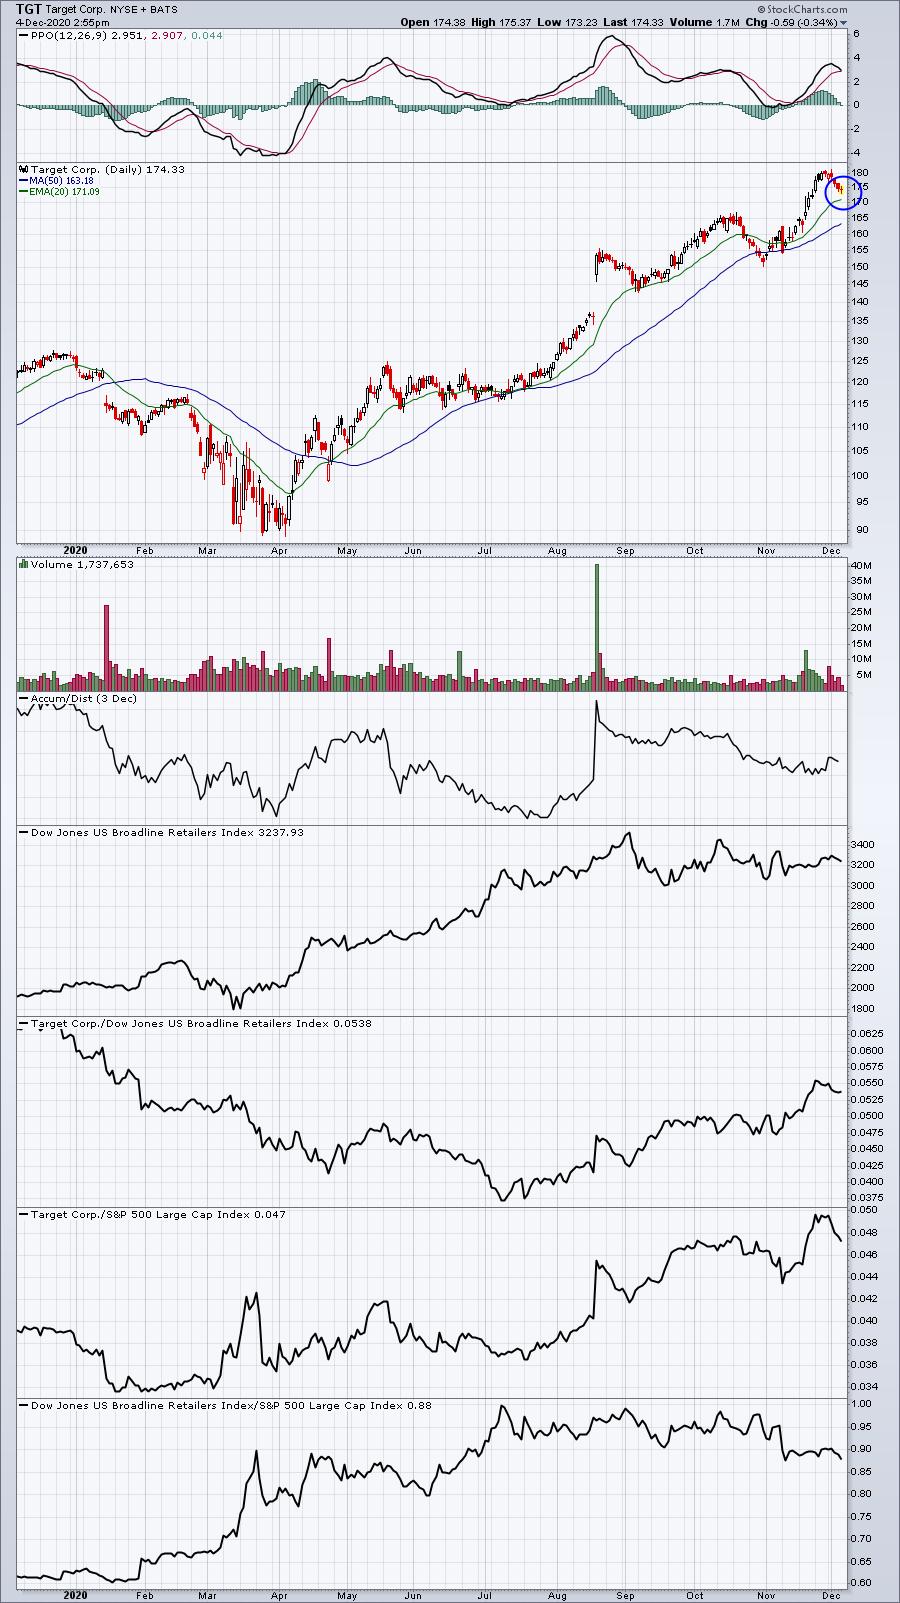
CYH and ETN both had strong and rising PPOs, which suggests to me that a rising 20 day EMA test is a solid reward to risk entry for a short-term trader. ODP and TGT appear as though they're more likely to remain in their short-term downtrend. If so, further weakness could lead to rising 20 day EMA tests. Given their strong and rising 20 day EMAs, I'd look for buying at that moving average to develop.
Earnings Reports
Here are the key earnings reports for the next two days, featuring stocks with market caps of more than $10 billion. I also include a few select companies with market caps below $10 billion. Finally, any portfolio stocks that will be reporting results are highlighted in BOLD. If you decide to hold a stock into earnings, please understand the significant short-term risk that you are taking. Please be sure to check for earnings dates for any companies you own or are considering owning.
Friday, December 4:
HDS, BIG
Monday, December 7:
COUP, CASY, SMAR, TOL, HQY, SFIX, JKS
Economic Reports
November nonfarm payrolls: 245,000 (actual) vs. 500,000 (estimate)
November private payrolls: 344,000 (actual) vs. 590,000 (estimate)
November unemployment rate: 6.7% (actual) vs. 6.8% (estimate)
November average hourly earnings: +0.3% (actual) vs. +0.1% (estimate)
October factory orders: +1.0% (actual) vs. +0.8% (estimate)
Happy trading!
Tom