
EB Daily Market Report - Monday, December 7, 2020
Save The Date!
Event: MarketVision 2021
Date: Saturday, December 19, 2020
Time: 9:00am - 2:00pm ET
More details will be coming soon!
ChartList Update
The Strong Earnings ChartList (SECL) and the Strong Future Earnings ChartList have been updated on our website, with a new link provided.
Executive Market Summary
- Futures were lower on the Dow Jones and S&P 500, higher on the NASDAQ
- That bifurcation has continued throughout the day with leadership remaining in NASDAQ shares
- The 10-year treasury yield ($TNX) has fallen 4 basis points after a stellar advance last week
- There is little economic data due out this week, so our major indices will trade mostly off of technical conditions and global markets
- Global markets were lower overnight and are mostly lower today as well
- Communication services (XLC, +0.36%) is the best performing sector as media agencies ($DJUSAV) gain nearly 2%
- Energy (XLE, -2.46%) is taking a much-deserved rest to start the week
- Gold ($GOLD, +1.40%) is solidly higher, while crude oil ($WTIC, -0.45%) pulls back fractionally
- The U.S. Dollar (UUP) is attempting to find a bottom after trading at its lowest level in more than two years
Market Outlook
The weekly PPO of the 10-year treasury yield ($TNX) has turned positive for the first time since late-2018. That's significant because it's telling us that the momentum has been strong enough to the upside for the 12 week EMA to rise above the 26 week EMA. Hourly and daily PPOs is one thing. Seeing enough momentum to clear the weekly centerline is quite another. The takeaway here is the fact that sellers of treasuries have cash to invest in equities. Over the years, a rising TNX usually correlates quite positively to a rising S&P 500:
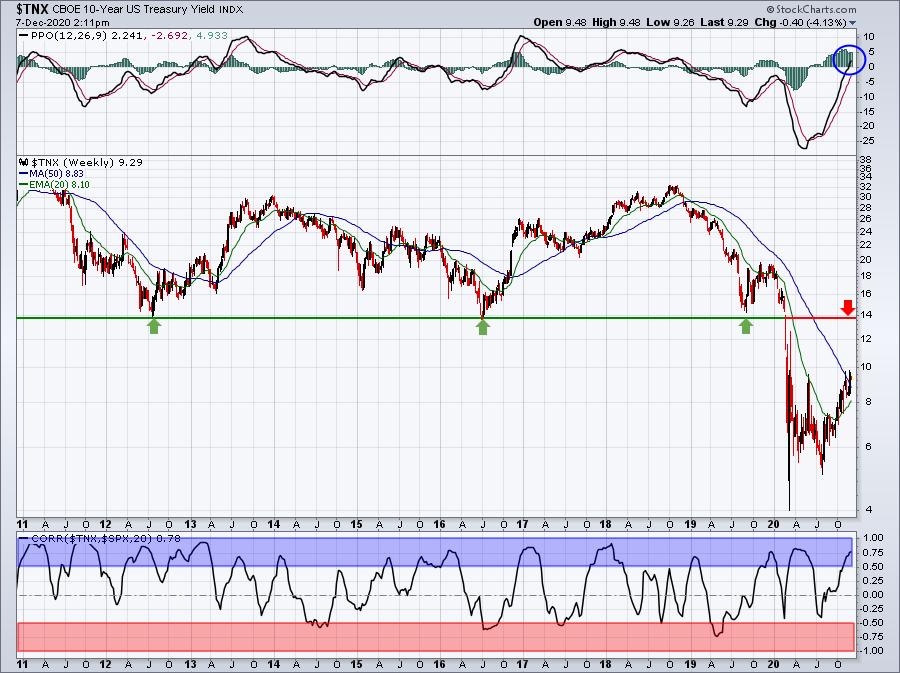
The bottom panel highlights the positive correlation above 0.50 (blue-shaded area) and the negative correlation below -0.50 (red-shaded area). It's obvious from this that the direction of the TNX correlates quite positively with the direction of the S&P 500. So as the TNX sees its weekly PPO drive through centerline resistance and into positive territory for the first time in over 2 years, how am I supposed to draw a bearish conclusion?
Sector/Industry Focus
A big question in 2021 will be......is the pent up demand stronger in the U.S. or other parts of the world? That will go a long way toward determining what areas we should consider investing in and also the likely direction of the U.S. dollar ($USD). We're currently seeing a very strong signal that the dollar will rise in 2021, despite it moving down to nearly test its 2018 low. Check out this chart:
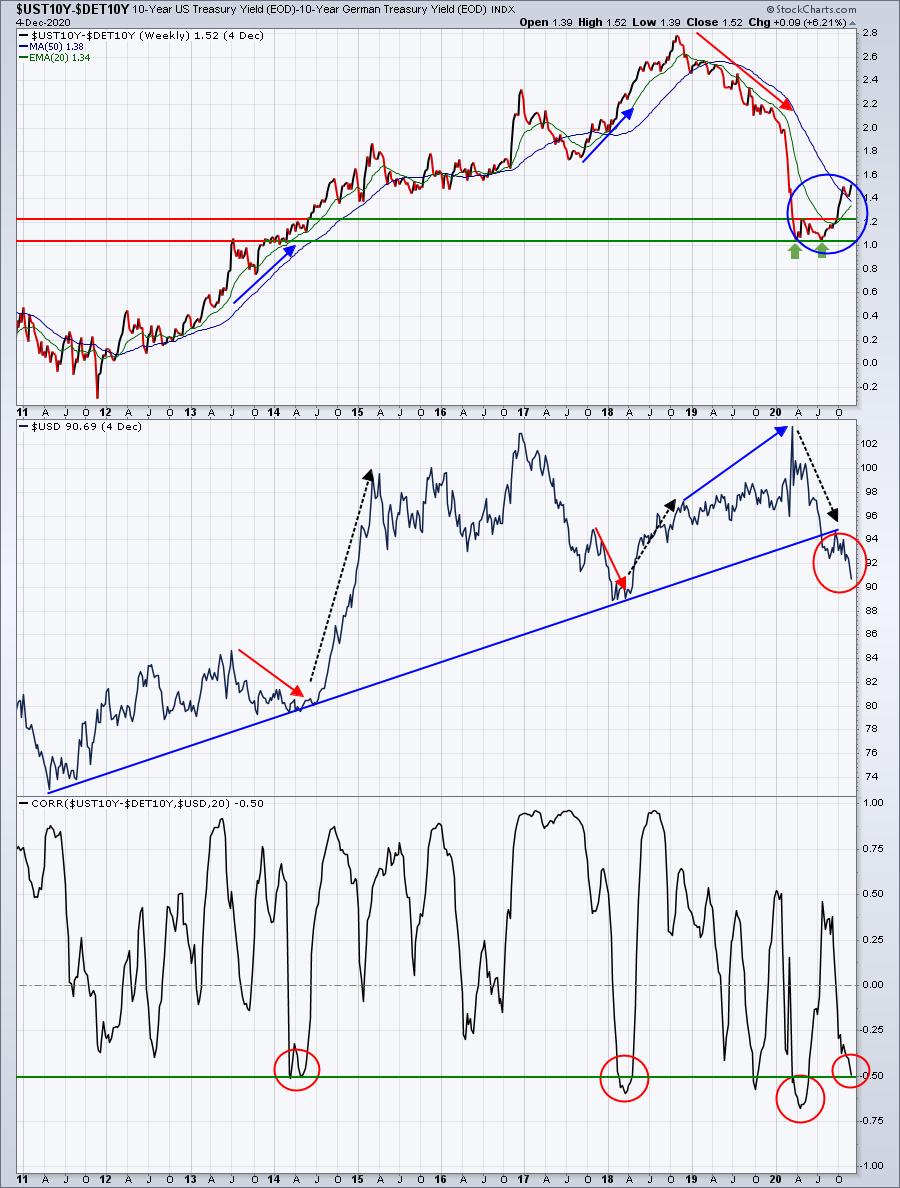
To determine the direction of the dollar, I've never found anything that's been a more successful predictor than comparing the 10-year treasury yield in the U.S. vs. that of Germany. This can be accomplished by using the "$UST10Y-$DET10Y" symbol. It simply subtracts the German 10-year yield from the U.S. 10-year yield. The direction of this "net" rate goes mostly hand-in-hand with the direction of the U.S. Dollar Index ($USD). The exceptions are those 4 red circles, which marked major warning signals about an impending reversal in the dollar. In the 3 previous cases, the dollar quickly reversed course to follow the yield signal. Currently, the dollar is falling, while the $UST10Y-$DET10Y is rising rather briskly. I believe 2021 will see another surge in the USD and that will put a lid on any relative rally in energy and materials.
ChartLists/Strategies
Here were two interesting charts that I saw as I perused the additions to our Strong Earnings ChartList:
DOMO:
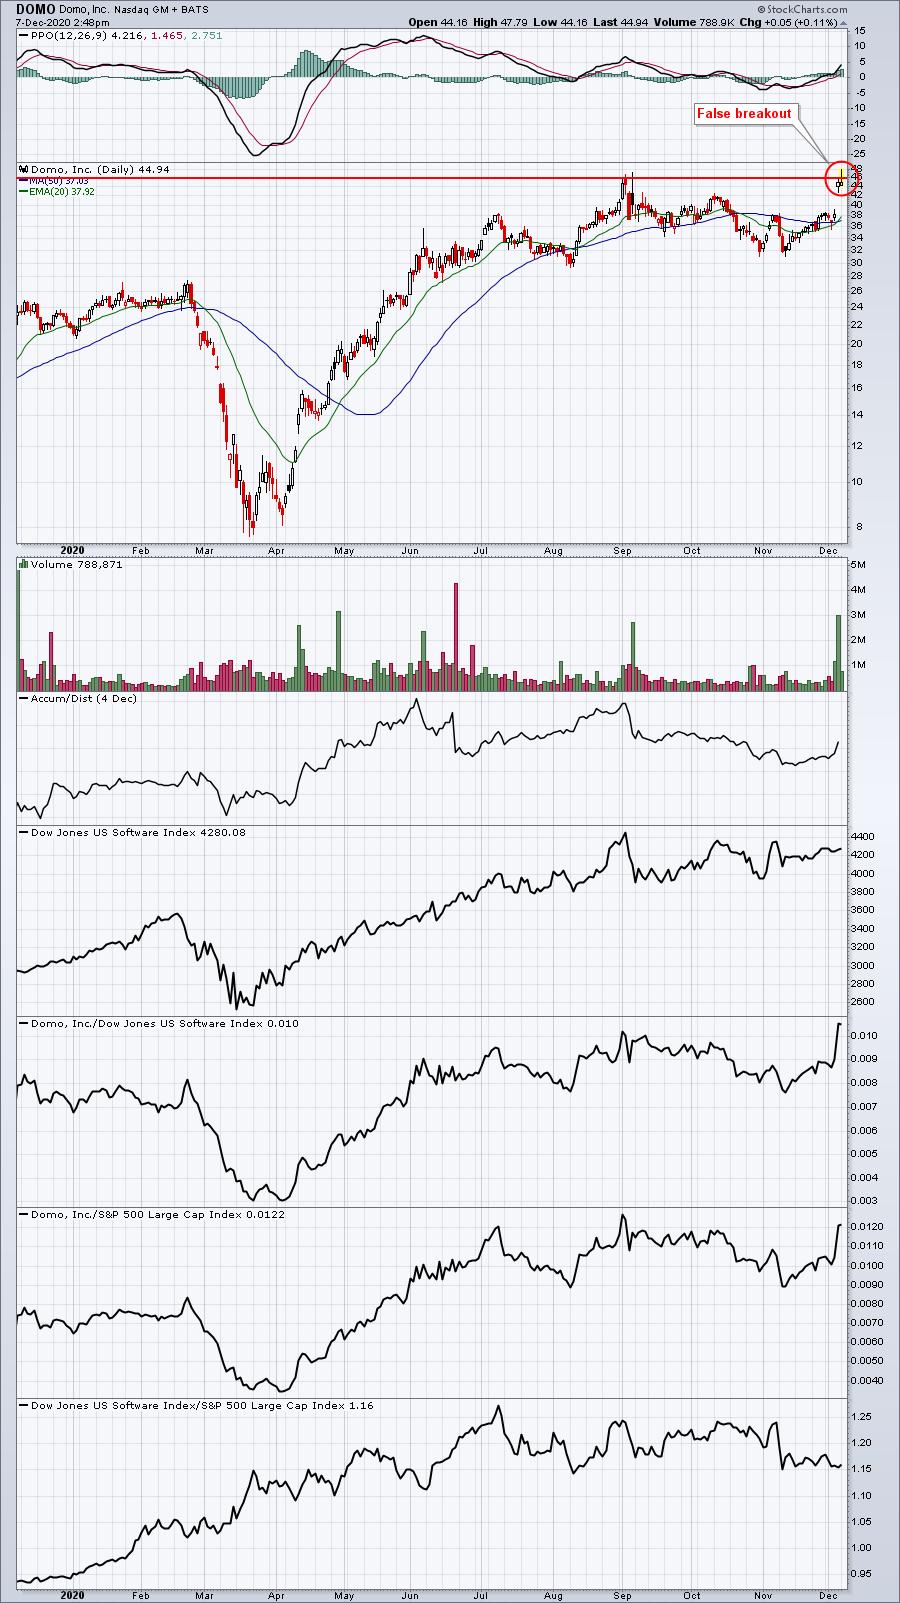
DOMO gapped up with earnings, but was unable to clear resistance at the open. Now we're seeing the false breakout. I like DOMO, but it's likely to see more downside before ultimately breaking out. Be careful until you see a definitive close above 45.60.
CLDR:
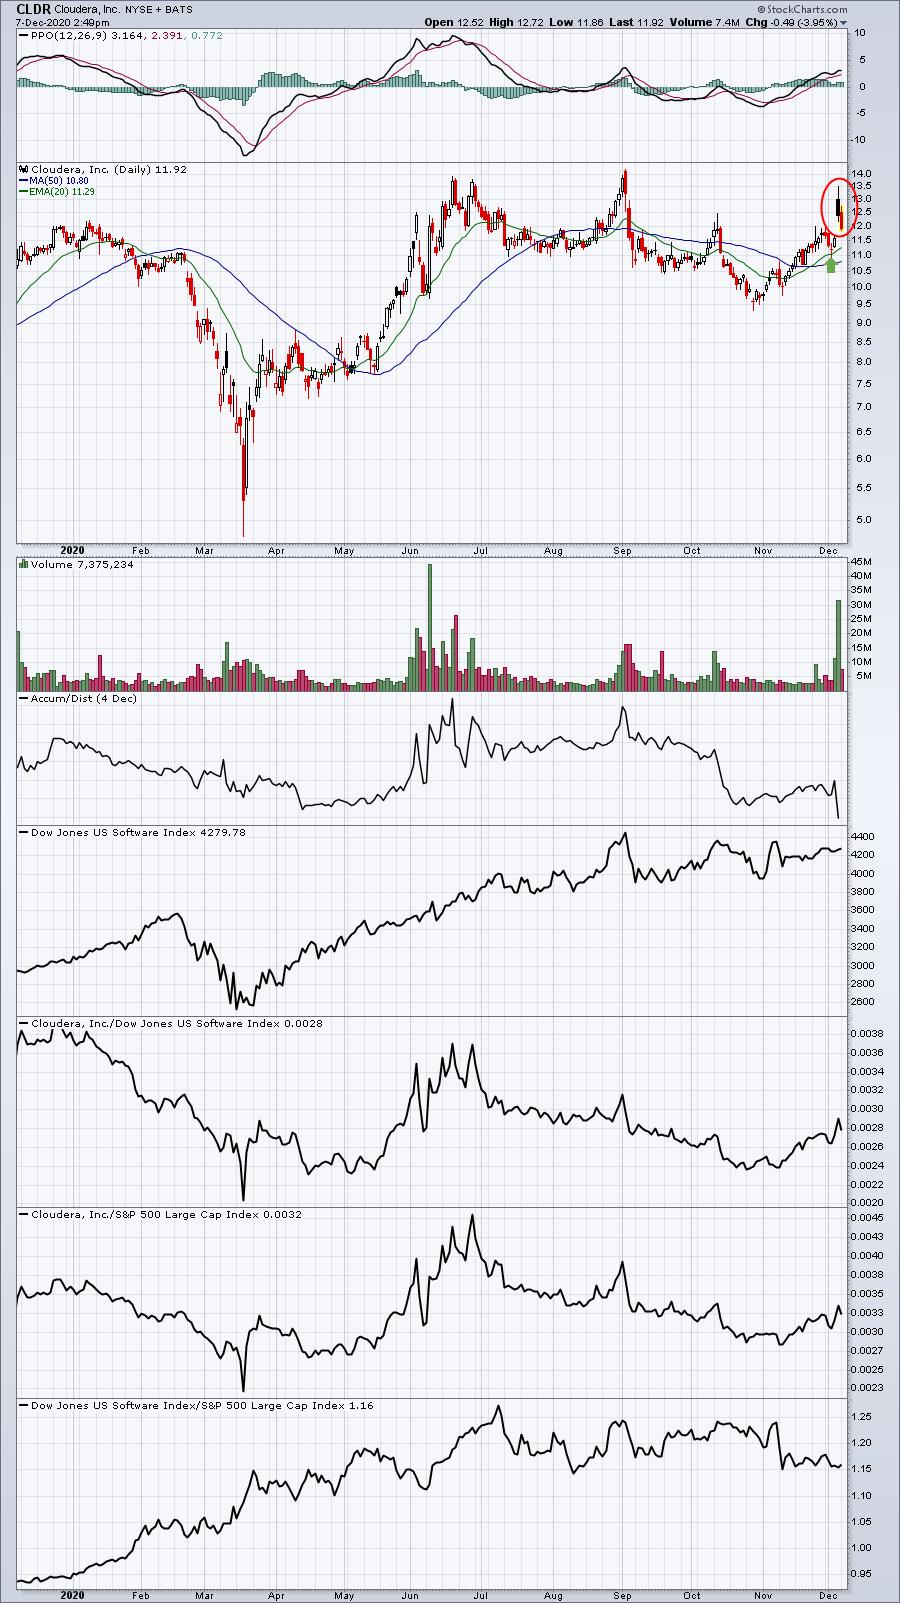
There was a TON of volume last week after CLDR's gap higher with earnings. It traded as high at 13.50 and then market makers took over on the short side. They're making a fortune as traders that chased on that opening gap are now beginning to feel pain. I like CLDR to reverse higher again as I believe it's in a confirmed uptrend. The further it drops, the more I like it. The 20 day EMA (11.29 currently) and gap support at 11.58 are best entries, in my opinion. I believe CLDR will eventually reverse and challenge the early September high just above 14.
Earnings Reports
Here are the key earnings reports for the next two days, featuring stocks with market caps of more than $10 billion. I also include a few select companies with market caps below $10 billion. Finally, any portfolio stocks that will be reporting results are highlighted in BOLD. If you decide to hold a stock into earnings, please understand the significant short-term risk that you are taking. Please be sure to check for earnings dates for any companies you own or are considering owning.
Monday, December 7:
COUP, CASY, SMAR, TOL, HQY, SFIX, JKS
Tuesday, December 8:
BF/B, CHWY, AZO, MDB, GWRE, THO, HRB, CMD, AVAV, PHR, GIII, GME
Economic Reports
None
Happy trading!
Tom