
EB Daily Market Report - Tuesday, December 8, 2020
Save The Date!
Event: MarketVision 2021
Date: Saturday, December 19, 2020
Time: 9:00am - 2:00pm ET
I will be speaking and I'll have two other distinguished speakers joining me. More details will be coming soon!
Executive Market Summary
- Futures were lower, but have rallied over the past few hours as our major indices set new all-time highs
- The 10-year treasury yield ($TNX) is relatively flat with little economic news out
- The U.S. Dollar (UUP) is up for the 3rd consecutive session, but that hasn't slowed down energy (XLE, +1.56%) and materials (XLB, +0.70%), our two top performing sectors
- Consumer discretionary (XLY, -0.22%) is leading four sectors lower, however
- Home construction ($DJUSHB, -4.33%), typically a strong December performer, is weighing on discretionary stocks
- Toll Brothers (TOL, -8.25%) is down after reporting better-than-expected quarterly revenues and earnings
- Stitch Fix (SFIX, +41.95%) is soaring after reporting a surprise profit and announcing its hired its CFO from Amazon.com (AMZN, +0.15%)
Market Outlook
The S&P 500 is attempting to close above 3700 for the first time ever. There is a slight negative divergence on the 60 minute chart, but the recent uptrend has been so mild that even a PPO centerline retest and/or a 50 hour SMA test would only result in a pullback of perhaps 1% or so:
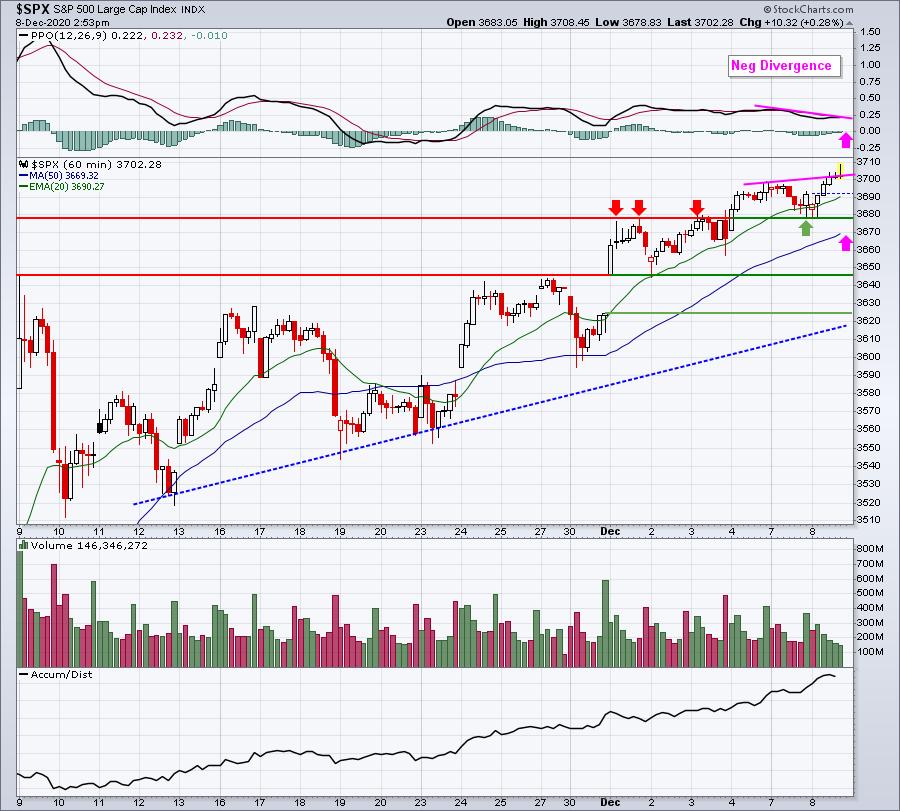
The pink arrows highlight the potential PPO centerline and/or 50 hour SMA tests. In terms of price support, I see a breakout and subsequent retest of that breakout level around 3680 so that would be the initial support I'd look for on any selling. Then there's top and bottom of gap support close to 3645 and 3625, respectively. I don't see the S&P 500 falling any further than that in the near-term, which is only 2% (or slightly more). Just beneath those levels is the 20 day EMA, currently at 3614 and rising. I'm just not seeing much downside risk.
Sector/Industry Focus
I'm watching technology (XLK) very closely. It's been consolidating, so it's lagged on a relative basis. However, it's now challenging a breakout level. If it does break out, I'll want to see if the XLK begins to lead the S&P 500 again on a relative basis. Here's the current look at both XLK's absolute and relative strength:
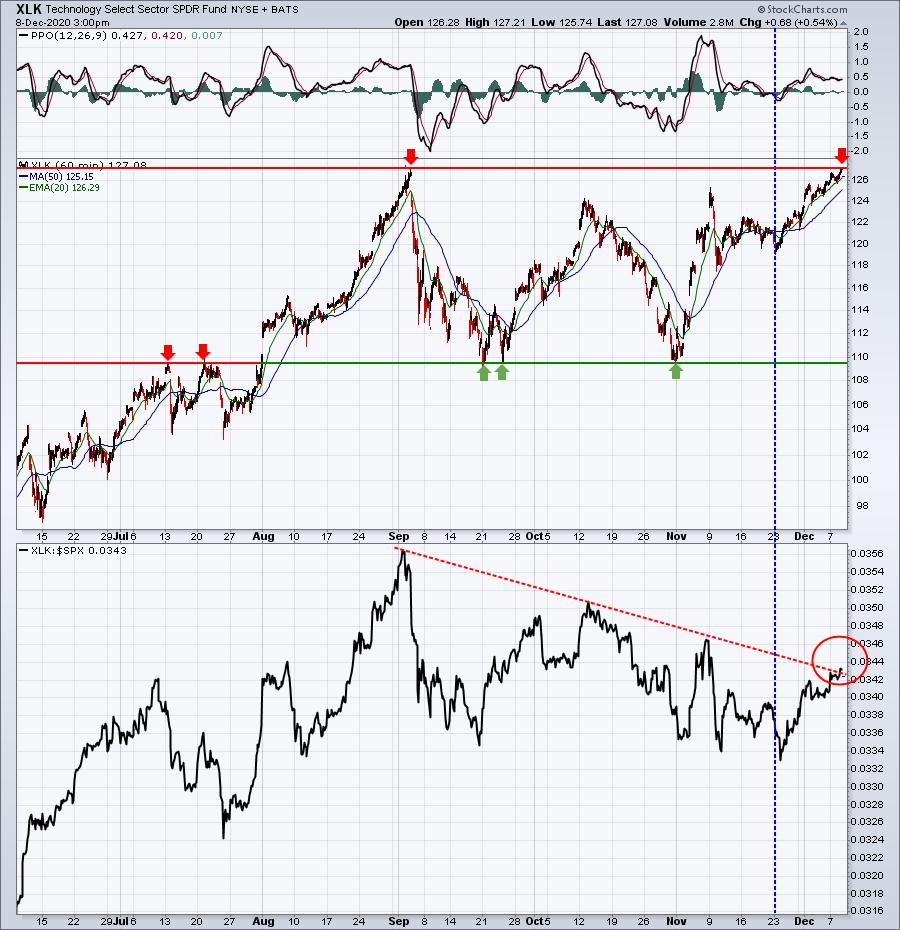
Keep an eye on that red circle. Does the relative downtrend line get broken on an XLK price breakout? If so, that would add to the bullishness of the advance.
ChartLists/Strategies
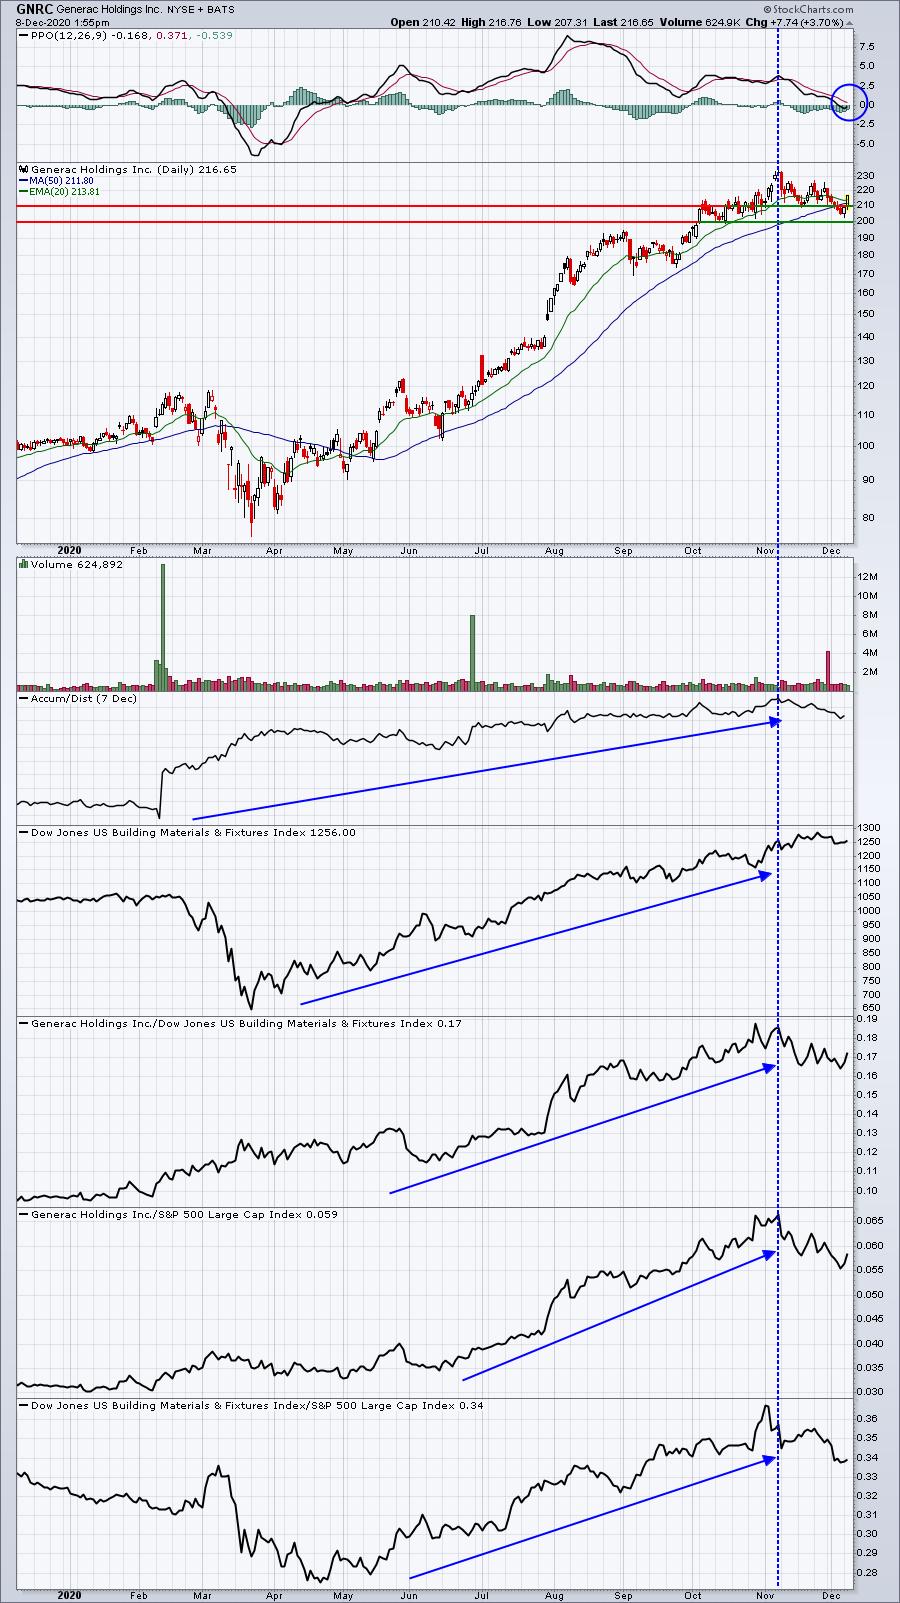
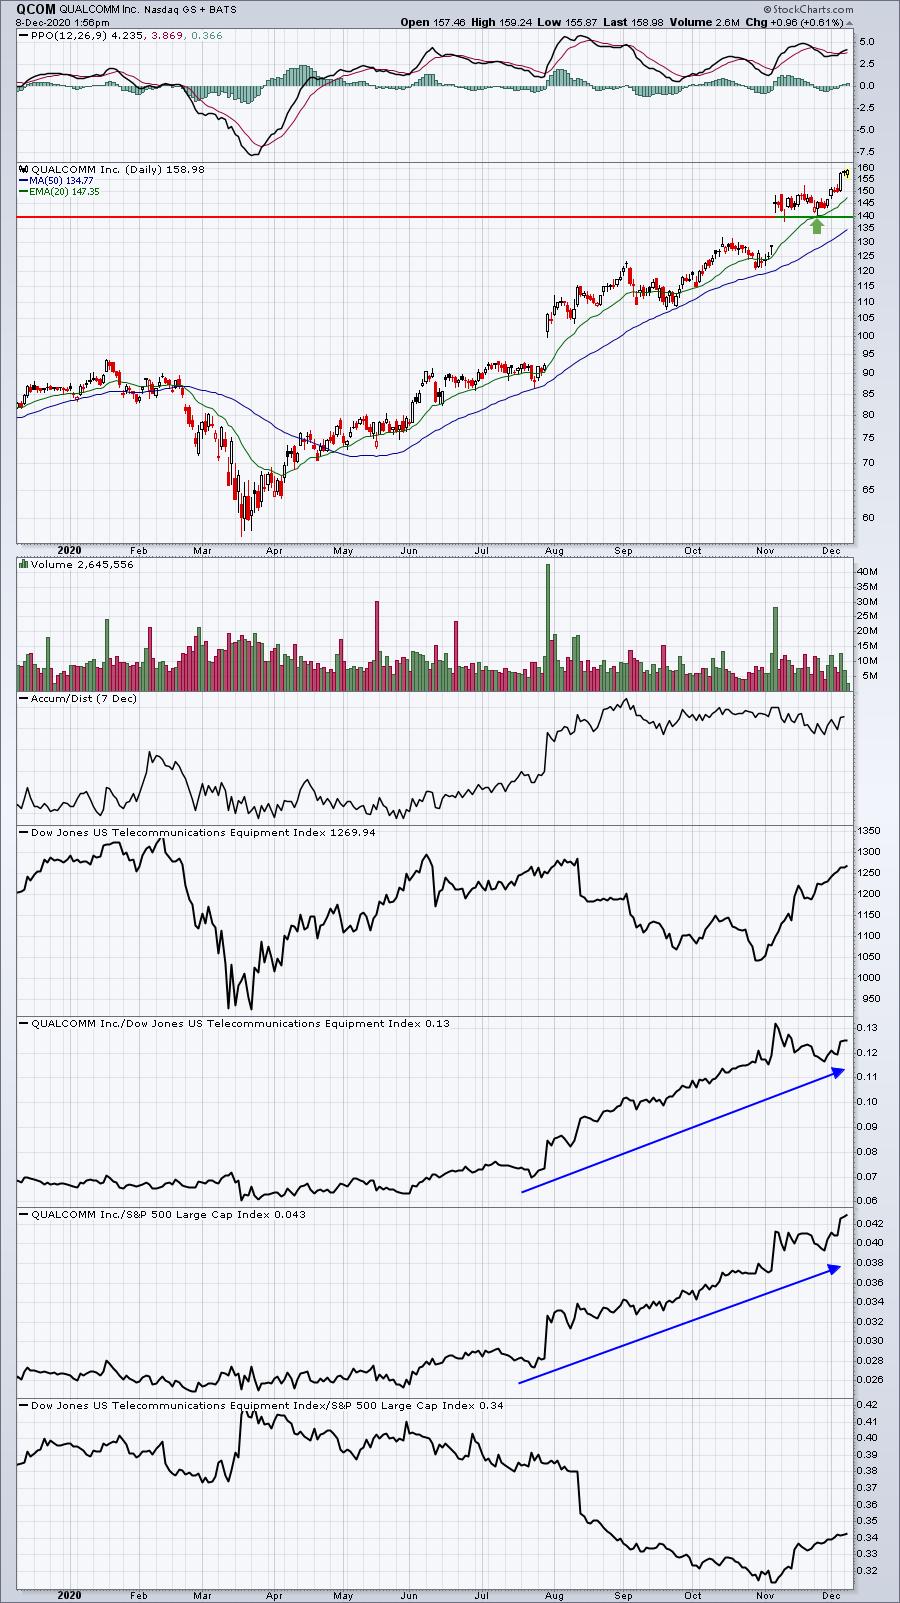
I love our portfolio stocks, all of them. Generally speaking, I'd say my favorite 10 stocks on our Strong Earnings ChartList (SECL) make it to our Model Portfolio. But I'm a fan of all 40 of them. In fact, there are many stocks on our SECL that don't make our portfolios simply because we run out of room after all 40 spots (10 stocks in each of our 4 portfolios) are filled. But I'm a short-term trader at heart. As well as these portfolios have performed over the past couple years, my strategy and style resonates best with a short-term trading approach. So I love it when portfolio stocks run into some short-term turbulence. That's certainly not to say they provide any sort of guarantee for success. But I like the reward to risk presented by short-term pullbacks. Here are 3 recent examples of what to look for:
GNRC:
QCOM:
ENPH:
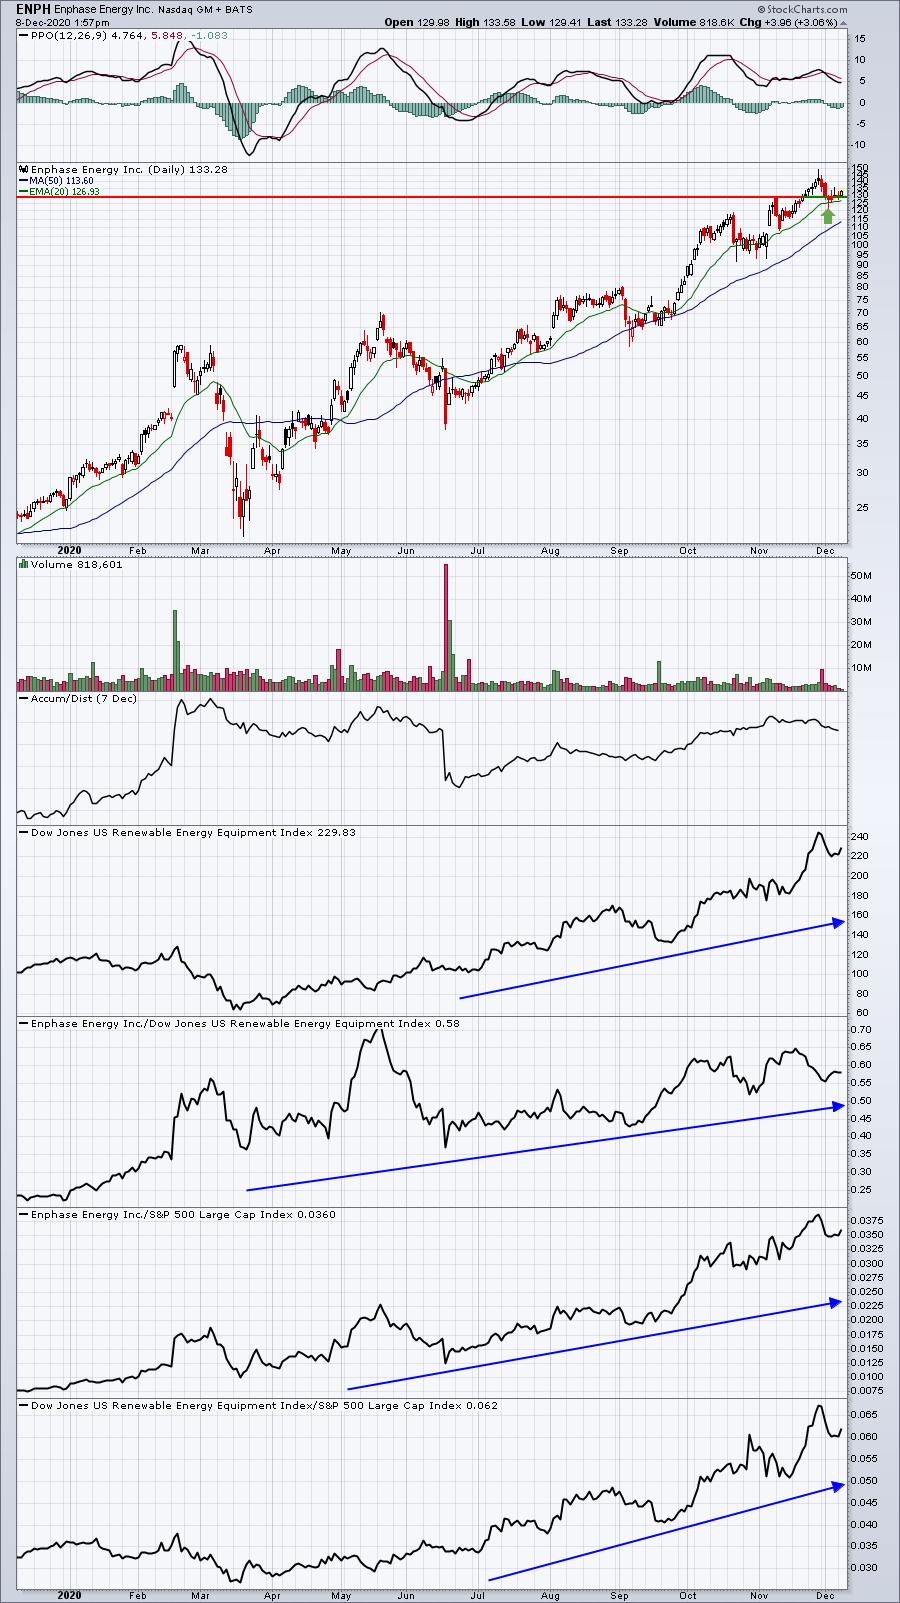
Price support and 20 day EMA tests are my two favorite entry points. Buying leading stocks gives me more confidence to give these stocks a bit more room to the downside and perhaps even establish a second entry point if they do continue to fall in the short-term.
If you don't want to watch the market day-by-day, hour-by-hour, that's fine. There are plenty of investing choices among our various ChartLists and you can use predefined scans on our website (or your own favorite scan) to identify solid reward to risk trades of medium-term length. I generally love 20 day EMA tests for a rising stock and you'll be able to find those every single day using our 20 day EMA scan.
But if you like to trade short-term, look at those 3 charts that I've provided above. They are HUGE relative strength winners. Wall Street LOVES these stocks. Perhaps they'll all of a sudden stop loving them, but I believe they'll continue to buy them on weakness, which is why I do the same. Just make sure you keep stops in place based on how much of a loss you're comfortable with on any given trade.
Earnings Reports
Here are the key earnings reports for the next two days, featuring stocks with market caps of more than $10 billion. I also include a few select companies with market caps below $10 billion. Finally, any portfolio stocks that will be reporting results are highlighted in BOLD. If you decide to hold a stock into earnings, please understand the significant short-term risk that you are taking. Please be sure to check for earnings dates for any companies you own or are considering owning.
Tuesday, December 8:
BF/B, CHWY, AZO, MDB, GWRE, THO, HRB, CMD, AVAV, PHR, GIII, GME
Wednesday, December 9:
CPB, RH, VRNT, UNFI
Economic Reports
Q3 productivity (2nd estimate): +4.6% (actual) vs. +4.9% (estimate)
Happy trading!
Tom