
EB Daily Market Report - Monday, December 14, 2020
Holiday Special
Happy holidays from EarningsBeats.com! We've begun our BEST DEAL of the year that will last through Saturday, December 19th. When you sign up for an annual membership for $697, you'll get two months free! If you're already an annual member, you can use this special to extend your membership another 14 months. One HUGE benefit of this deal is that annual members WILL NOT have to pay for our ETF service that will be charged separately at a rate of $77 per month, effective January 1, 2021. There will be no charge for the ETF service until your next renewal date, whether that's in March 2021, October 2021, or December 2022. We're doing our best to provide great benefits in exchange for your long-term commitment to EarningsBeats.com. It's our way of saying THANK YOU for your support and loyalty in 2020.
For more information on our Holiday Special, CLICK HERE.
Market Vision 2021
Event: MarketVision 2021
Date: Saturday, December 19, 2020
Time: 9:00am - 2:00pm ET
I will be speaking and I'll have two other distinguished speakers joining me - David Keller, Chief Market Strategist, and Grayson Roze, VP of Operations, both from StockCharts.com. For more information, CLICK HERE!
Executive Market Summary
- Futures opened solidly higher, but the Dow Jones and S&P 500 have sold off and are near their flat lines
- The NASDAQ showed a bit of relative weakness at the open, but held its gains as relative strength emerged
- There's been a huge rotation from value to growth throughout today's session as the IWF:IWD is at 1.74; the current range is 1.69-1.75, so I'm watching to see if we get a breakout
- The 10-year treasury yield ($TNX) is relatively flat after being up 3 basis points at the open
- Gold ($GOLD, -0.61%) slips, remaining in the downtrend that began at the early-August high
- Walt Disney (DIS, -2.58%) is today's worst Dow Jones performer, as profit taking kicks in from Friday's surge
- Netflix (NFLX, +3.50%) among the top S&P 500 performers, attempting to close above 520 for the first time in nearly two months
Market Outlook
It's easy to overreact to any short-term movement in the U.S. stock market. Emotion plays perfectly into the hands of market makers. They move stocks around in the very near-term, sometimes making them look like they're breaking out, other times making them look like they're breaking down. Bottom line, however, is that we need to step back and review the bigger picture. The long-term weekly chart (100 years) tells me we remain in a secular bull market - even in the midst of the worst of the pandemic selling in March this chart said secular bull market. In the near-term (hourly chart), the channel I provided last week is one to watch. I'll reprint it for illustrative purposes:
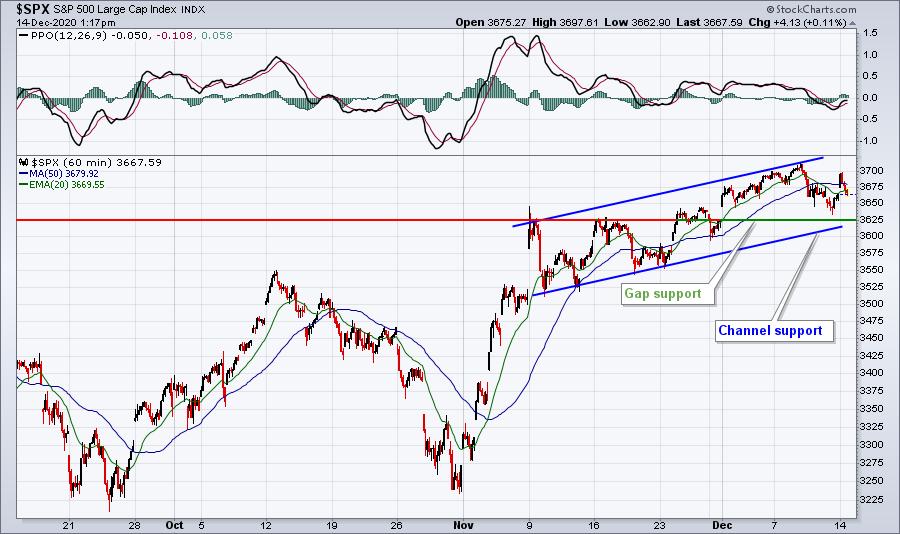
On Friday, we had afternoon strength, followed up with a gap higher this morning. Then we've seen selling since the first half hour. But all of this fits neatly within the channel that was identified last week. Still, emotionally the downtrends take an emotional toll on a short-term trader. I'd keep an eye on 3625 on the S&P 500. Unless that level is lost, my opinion is one of bullishness and I expect our major indices to rise into year end.
Sector/Industry Focus
Right now, technology is being led by electronic equipment stocks ($DJUSAI). Rather than just tell you, let me show you. The following is a 3 year relative chart - the DJUSAI vs. the S&P 500. On StockCharts.com, you type in the symbol "$DJUSAI:$SPX":
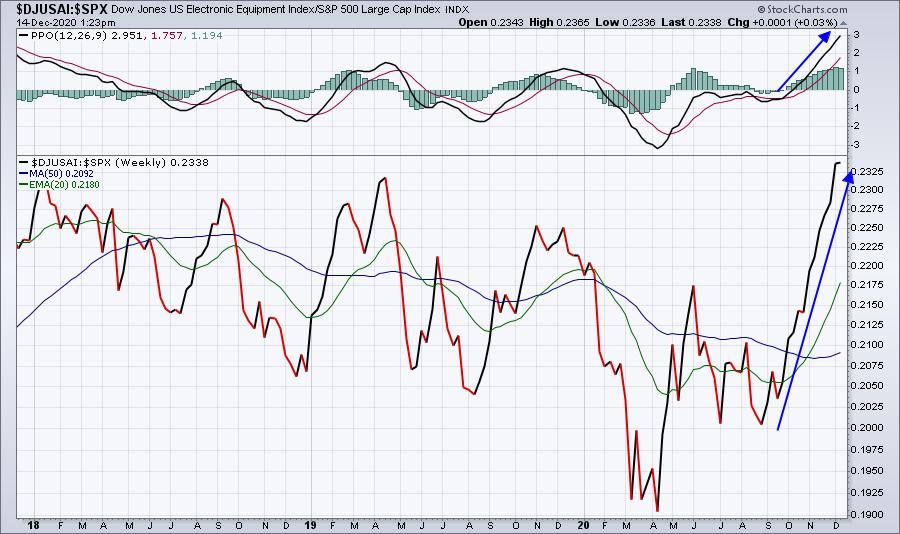
It's so important to follow those industry group relative strength charts, because it tells us exactly where Wall Street is putting its money. Trading stocks in that area of the market has a much higher chance of success simply because money is rotating there. On our Strong Earnings ChartList, when you review it in Summary form, you can type in an industry group like "electronic equipment" and the SECL stocks will be filtered by that so you can quickly zero in on stocks within this industry group that ALSO beat revenue and EPS estimates in their latest quarterly reports. I did that and this is what was returned:
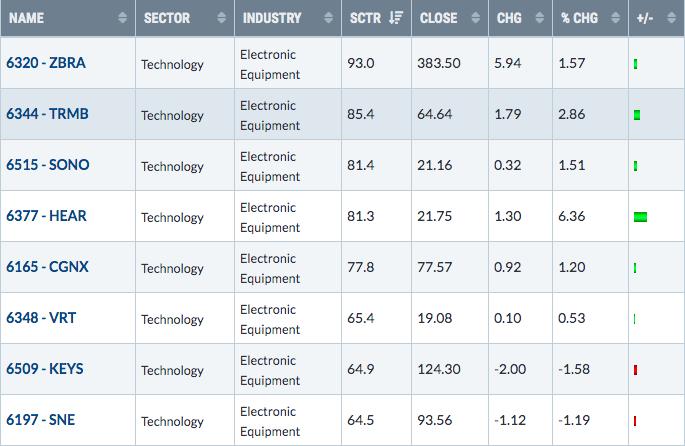
I further sorted this by SCTR score, so this gives us 3 important characteristics all at once. First, all these stocks are in one of the best industry groups RIGHT NOW. Second, they all beat their revenue & EPS estimates in their latest quarter. Third, they're ordered in terms of their StockCharts Technical Rank, which is a relative strength calculation. This is just one example of how to use our research platform to find stock trading candidates and have more confidence owning them.
ZBRA is a component stock of our Strong AD Portfolio and this analysis should help to explain why.
ChartLists/Strategies
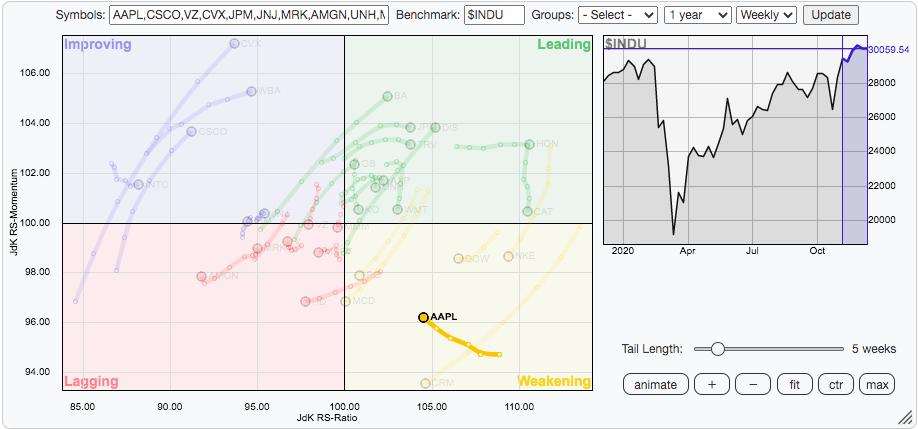
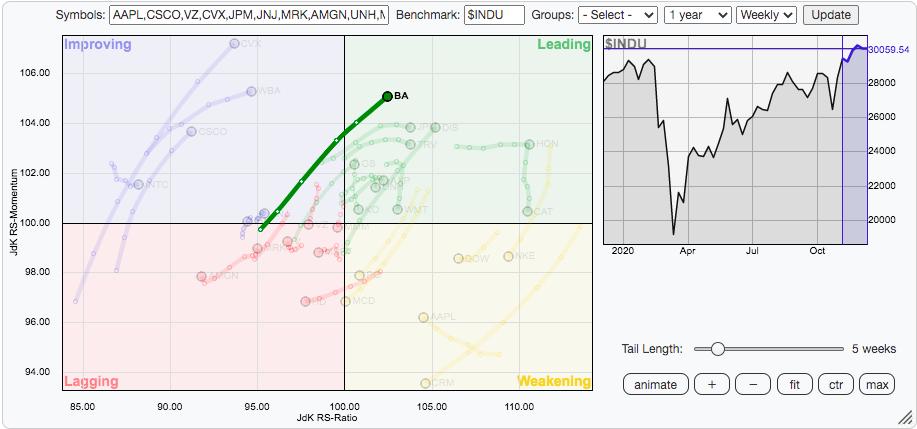
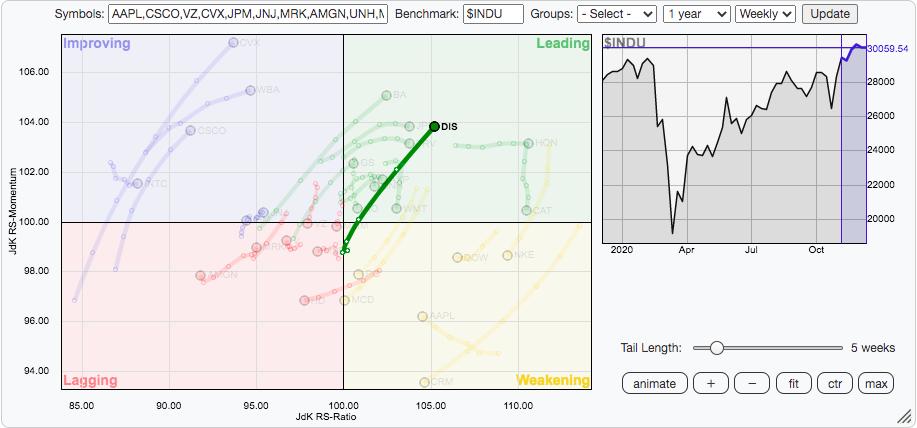
We've still got a bit of historical bearishness to deal with, but gapping higher after the weekend helped to alleviate some of my short-term concerns. Since today's opening gap higher, though, we've seen a bit of selling, especially on the Dow Jones and S&P 500. I thought I'd look at a Dow Jones RRG (relative rotation graph) to point out what I believe are the 3 best trading candidates right now. Before I do that, I'll tell you what I like to see. I either want to see a stock rapidly gaining strength and moving in a northeast direction in the leading quadrant OR a stock that has shown tremendous relative strength in the past that's beginning to curl back up in the lagging quadrant. Here are the 3 that I like the best without even looking at a price chart:
AAPL:
BA:
DIS:
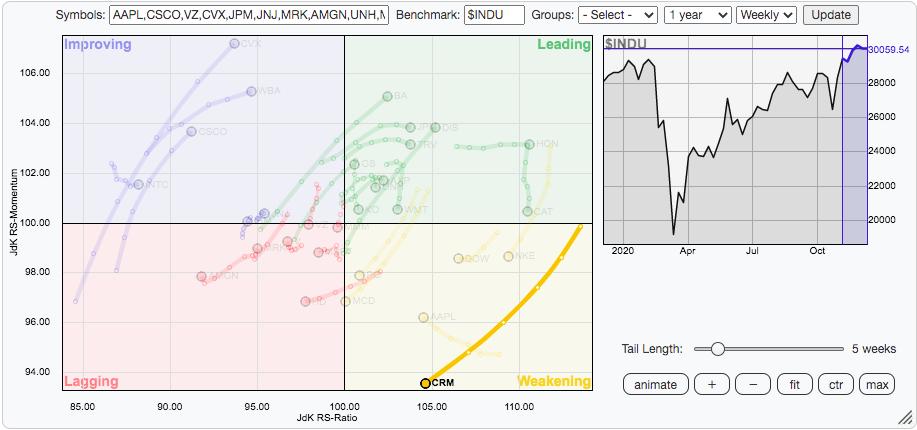
As a bonus RRG chart within the Dow Jones, I'd say a dark horse to emerge as a new leader very soon is CRM. It was a tremendous relative leader within the past 2-3 months and it's been weakening on a relative basis. Watch for it to start curling back up within the lagging quadrant. That would be an early bullish signal for me.
CRM:
Earnings Reports
Here are the key earnings reports for the next two days, featuring stocks with market caps of more than $10 billion. I also include a few select companies with market caps below $10 billion. Finally, any portfolio stocks that will be reporting results are highlighted in BOLD. If you decide to hold a stock into earnings, please understand the significant short-term risk that you are taking. Please be sure to check for earnings dates for any companies you own or are considering owning.
Monday, December 14:
None
Tuesday, December 15:
NDSN
Economic Reports
None
Happy trading!
Tom