
EB Daily Market Report - Thursday, December 17, 2020
ChartList Update
The Short Squeeze ChartList (SSCL) has been updated on the website. You can use the link and password on our ChartLists page to download (or review) this ChartList into your StockCharts.com account. Please note that you'll need an Extra or Pro membership at StockCharts.com to be able to save our ChartLists in your account.
Announcements
Holiday Special
For more information, CLICK HERE.
Market Vision 2021
For more information, CLICK HERE!
Executive Market Summary
- Futures were strong at the open and our major indices have been in positive territory throughout the day
- Volatility ($VIX, -3.51%) sinks and is once again moving towards a key level at 20
- Initial jobless claims spiked as COVID-19 restrictions seem to be inflating this weekly number
- Housing starts and building permits were solid and above expectations
- Lennar (LEN, +6.33%) added to the bullish bias in homebuilders by easily topping earnings expectations
- Real estate (XLRE, +1.09%) and materials (XLB, +1.08%) are the top performing sectors, as energy (XLE, -0.62%) lags
- Home construction ($DJUSHB, +4.51%) is the top performing industry group
- Commodities are strong today with gold ($GOLD, +) and crude oil ($WTIC, +1.13%) both higher by more than 1% on the session; the dollar's (UUP, -0.64%) plunge is aiding commodities
- The 10-year treasury yield ($TNX) is up 2 basis points after moving lower earlier on the weak economic news
Market Outlook
After a brief pause, transportation stocks ($TRAN) are bouncing nicely off their 20 day EMA, and are also trading well above key short-term price support in the 12000 area:
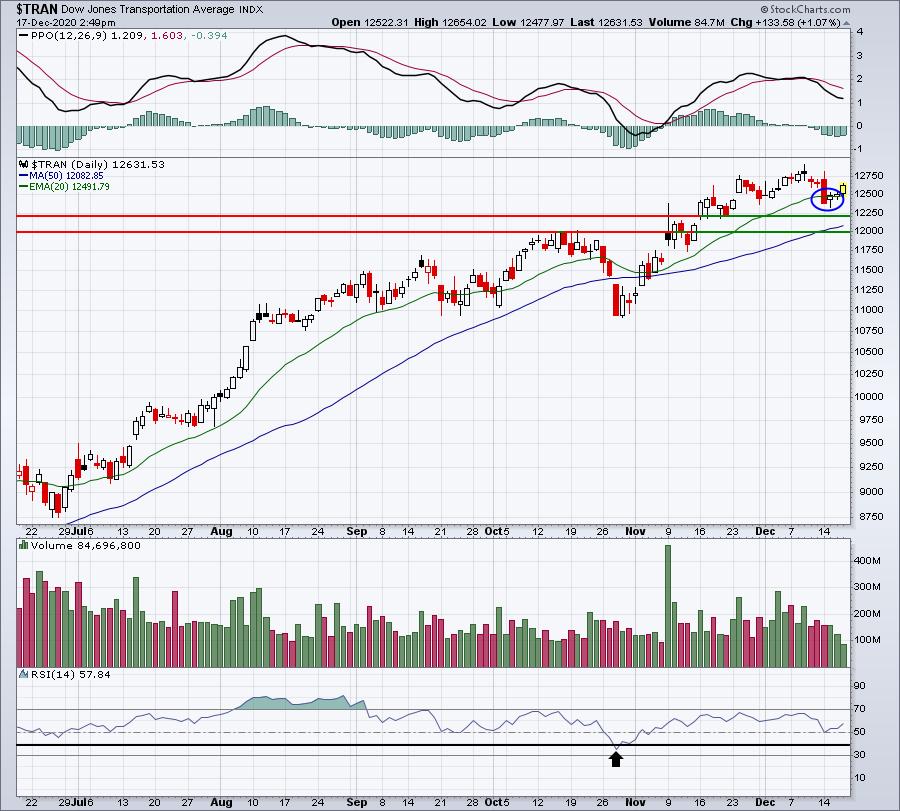
It's always important to have a strong and advancing transportation group and we can see from the above chart that's exactly what we have here. The black arrow shows the one minor breach of RSI 40 support. During uptrends, RSI trips down to the 40-50 range are generally buyable. Transports still look quite bullish to me, though further consolidation can never be ruled out.
Sector/Industry Focus
Over the past week, I want you to look at the worst performing sector. Here are all the sectors over this past week in performance order - best to worst:
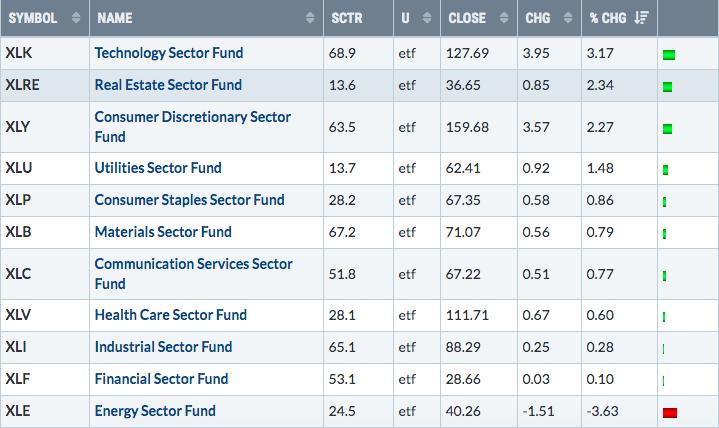
Energy (XLE) is the worst performing sector this week. Before I explain why I pulled this up, look at the best performing sector over the past month:
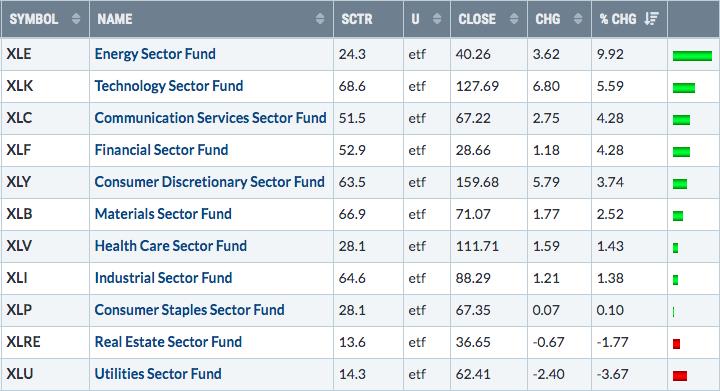
Despite the selling over the last week, the XLE is still, BY FAR, the best performing sector over the past month. I wish I was in a live webinar right now and could ask everyone what reason might there be for the XLE to turn lower this week. But since we're not in a webinar, I'll just tell you.
It's options expiration Friday tomorrow. All that strength in energy stocks over the past month has created TONS of net in-the-money call premium that market makers are likely "stealing" with this bout of selling. Occidental Petroleum (OXY), one of our Max Pain stocks that we discussed on Tuesday night, has fallen from a close of 21.31 last Thursday to today's price of 19.31, a two dollar drop. Based on my calculations of just this one stock, every 10 cents lower on OXY saves roughly $500 million in net call premium.
We always must remain vigilant around options expiration Friday.
ChartLists/Strategies
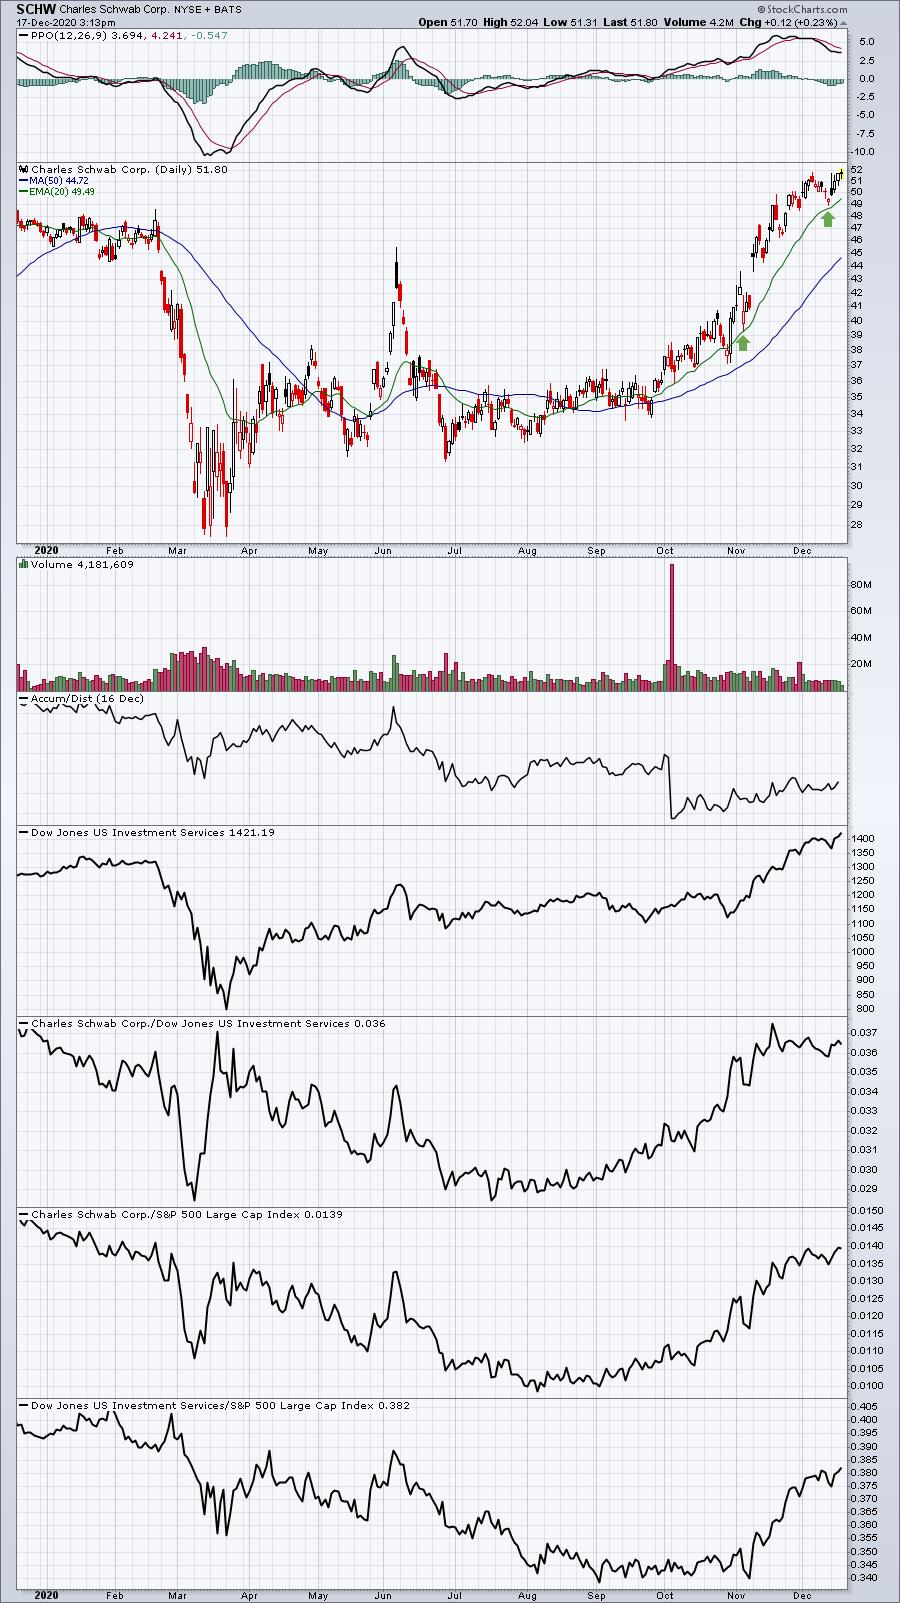
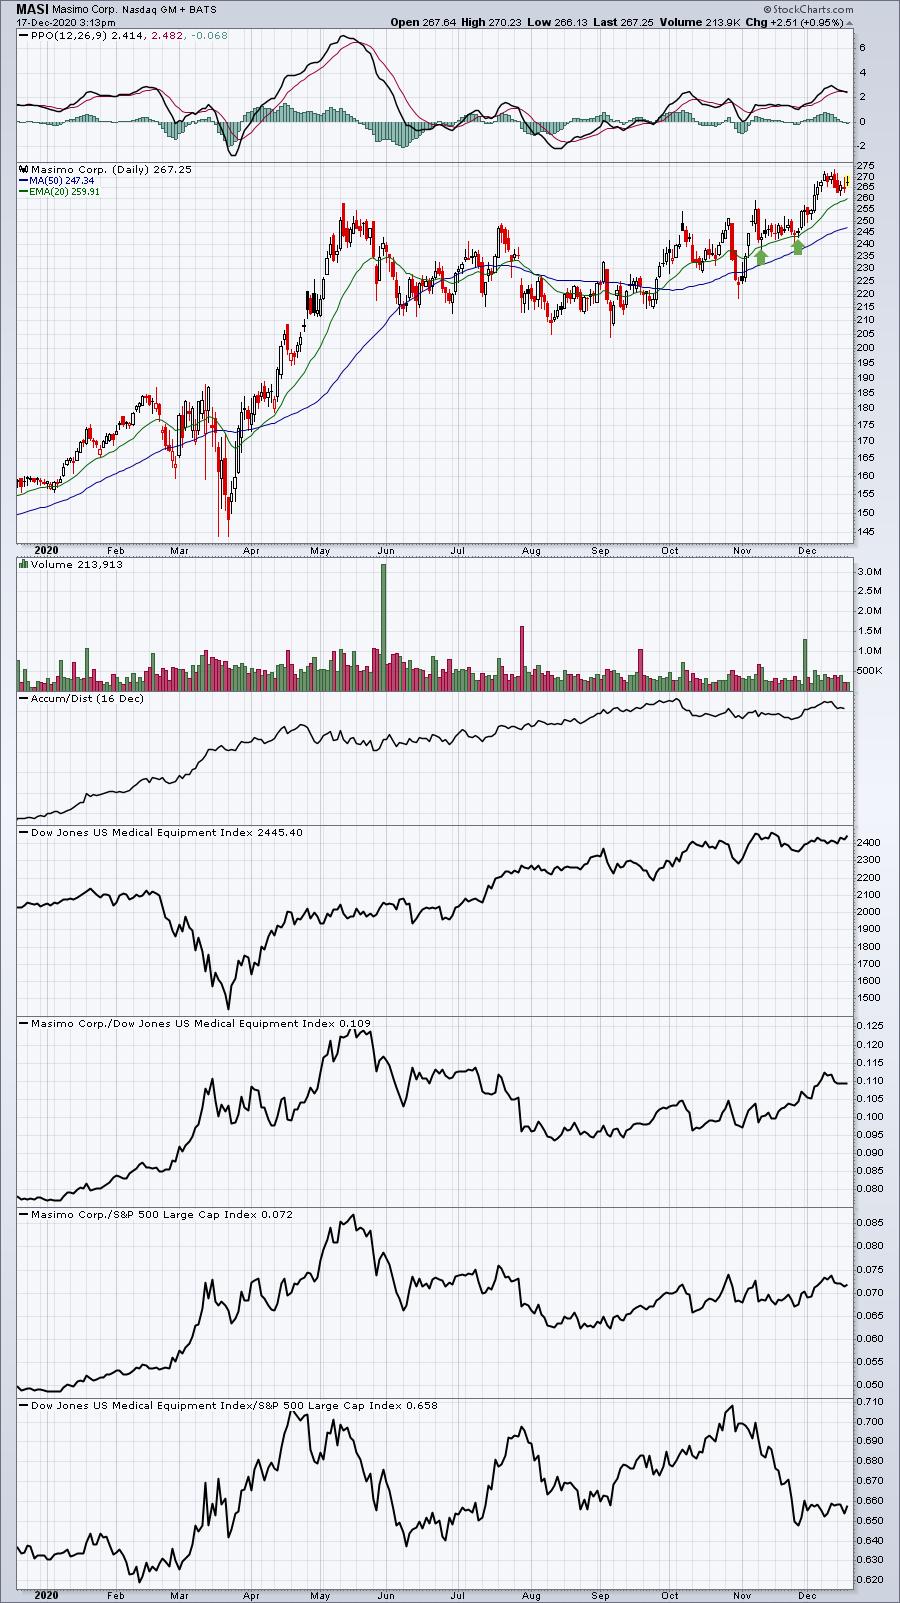
Many stocks are now clearly trending higher and bouncing off 20 day EMA tests. Here are just a few examples of stocks off our Strong Earnings ChartList that have done just that:
SCHW:
MASI:
TENB:
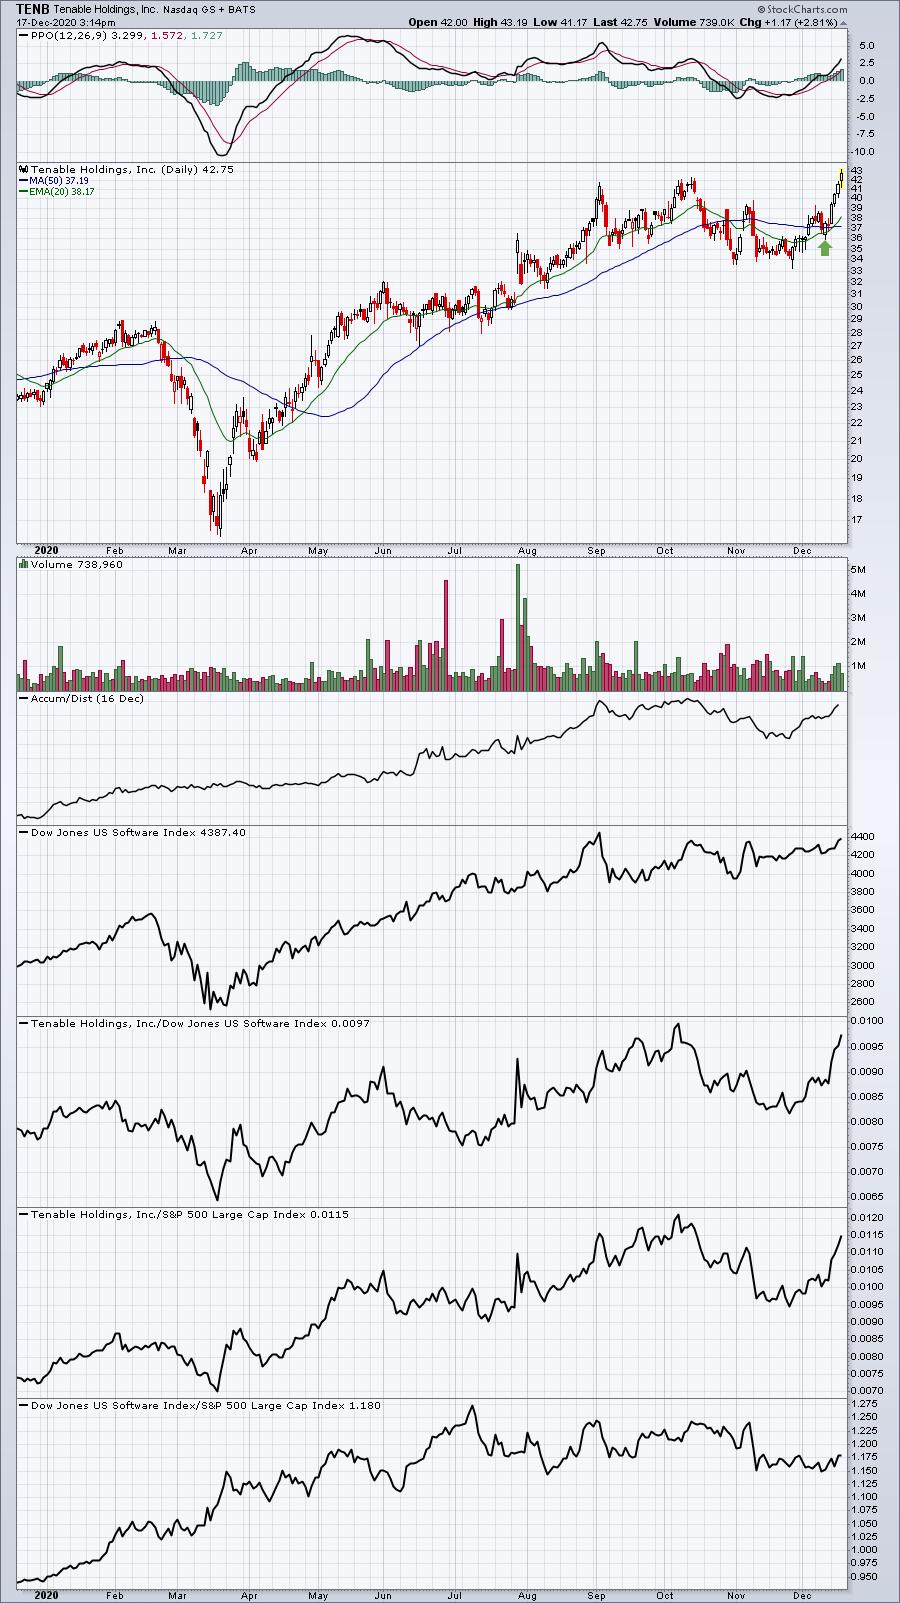
These are not necessarily stocks that I'd rush out and buy today. Instead, they are examples of what we should be looking for as stocks break out from basing patterns. An initial signal of a new uptrend underway is seeing successful 20 day EMA tests.
Earnings Reports
Here are the key earnings reports for the next two days, featuring stocks with market caps of more than $10 billion. I also include a few select companies with market caps below $10 billion. Finally, any portfolio stocks that will be reporting results are highlighted in BOLD. If you decide to hold a stock into earnings, please understand the significant short-term risk that you are taking. Please be sure to check for earnings dates for any companies you own or are considering owning.
Thursday, December 17:
ACN, FDX, GIS, JBL, BB, NAV, AIR, RAD
Friday, December 18:
NKE, DRI, WGO
Economic Reports
November housing starts: 1,547,000 (actual) vs. 1,530,000 (estimate)
November building permits: 1,639,000 (actual) vs. 1,544,000 (estimate)
Initial jobless claims: 885,000 (actual) vs. 806,000 (estimate)
December Philadelphia Fed Manufacturing Index: 11.1 (actual) vs. 21.1 (estimate)
Happy trading!
Tom