
EB Daily Market Report - Monday, January 4, 2021
ChartList Updates
There have been two recent updates to our ChartLists. The Short Squeeze ChartList (SSCL) and the Raised Guidance ChartList (RGCL) both were updated over the holidays. You can now download these updated ChartLists into your StockCharts.com account, if you're an Extra or Pro member. Otherwise, you can view the charts on these ChartLists one-by-one if you are not at least an Extra member at StockCharts.com.
Executive Market Summary
- Futures were solid, but unfortunately, that's where the bullishness seems to have ended
- All of our major indices have been selling all day long and it's been mostly indiscriminate selling
- At last check - just before 1pm ET - our major indices were lower by roughly 2.00%-2.25%
- All 11 sectors are lower, so it's clearly a bearish start to 2021
- Energy (XLE, -0.37%) and materials (XLB, -1.23%) have held up best with the dollar under pressure early
- The dollar (UUP, +0.00%) has since rebounded and is flat, but the relative strength in the XLE and XLB remain
- Gold ($GOLD) and silver ($SILVER) are both up more than 2%, while crude oil ($WTIC) is lower by a bit more than 2%
- The 10-year treasury yield ($TNX) is down slightly as money has rotated towards defensive treasuries since the opening bell
- One thing that's up significantly is volatility as the VIX has spiked more than 23% to 28; that would mark the highest VIX close since early November, just prior to the positive COVID-19 vaccine news
Market Outlook
We haven't had to deal with too many days like today the past several weeks, but it's an ugly day for sure. One indicator that I now follow closely is the accumulation/distribution line (AD line), as many of you know. Volume is heavy today and the key multiplier in the AD line's calculation is where you finish relative to the day's trading range. Therefore, I'll be watching to see how we trade in the final couple hours today. Do we rally and mitigate some of today's bearishness? If not, then today's open becomes a very important resistance level moving forward. Here's the daily chart of the S&P 500:
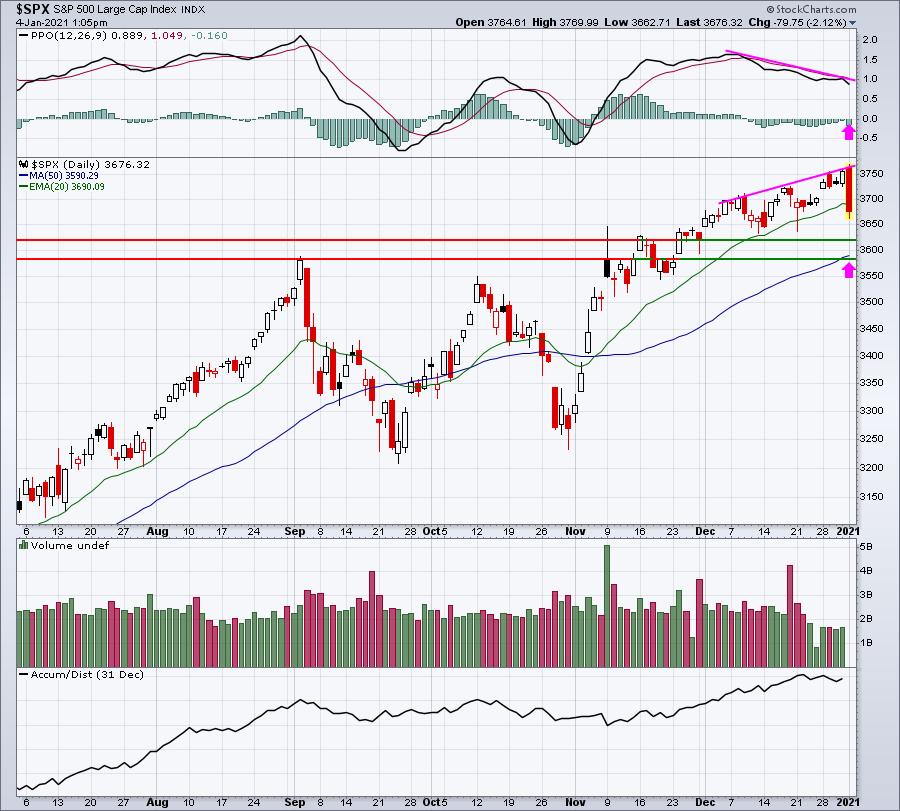
Negative divergences can lead to 50 day SMA tests and/or PPO centerline tests (pink arrows). Generally speaking, reversing candles with a negative divergence turns me more cautious near-term. Unless we see a massive rally in the final couple hours, there's likely to be a bearish engulfing candle at day's end. Key support on the daily chart is in the 3580-3620 range, which coincides with the 50 day SMA, currently at 3590. So this is an area to watch if the selling accelerates.
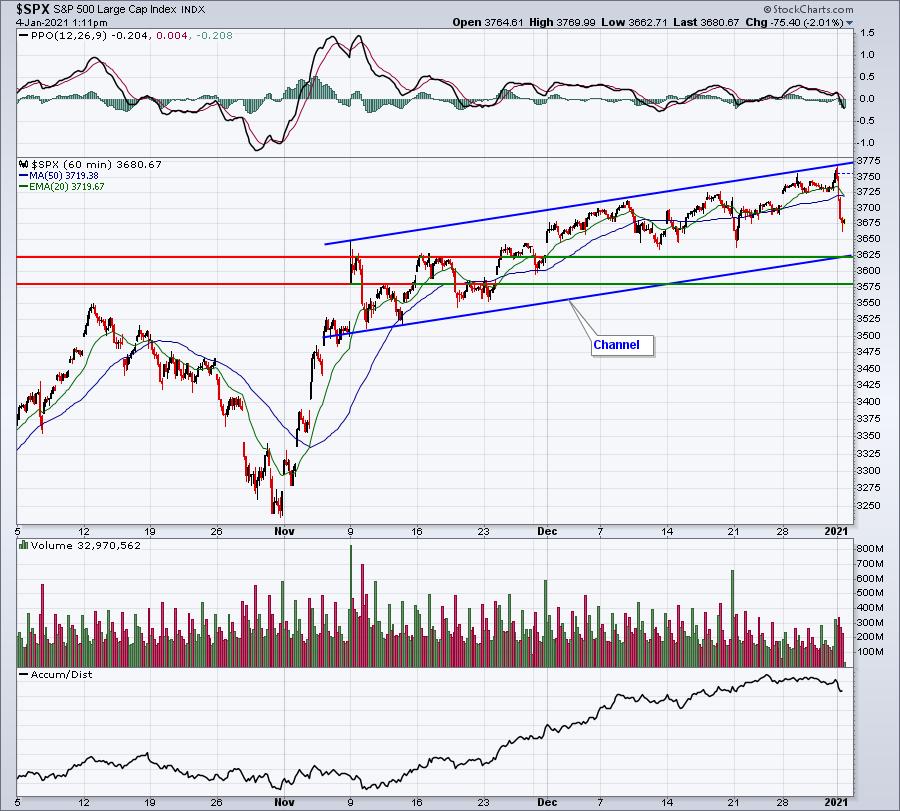
If we move to a 60 minute chart, there was also a negative divergence, but that has played out after we blew through 50 hour SMA support. More importantly, let's watch the channel support, which confirms the daily support illustrated above:
Sector/Industry Focus
One industry group that's really become attractive on a relative basis is broadcasting & entertainment ($DJUSBC). First, let's look at its weekly relative strength, which has been soaring the past two months:
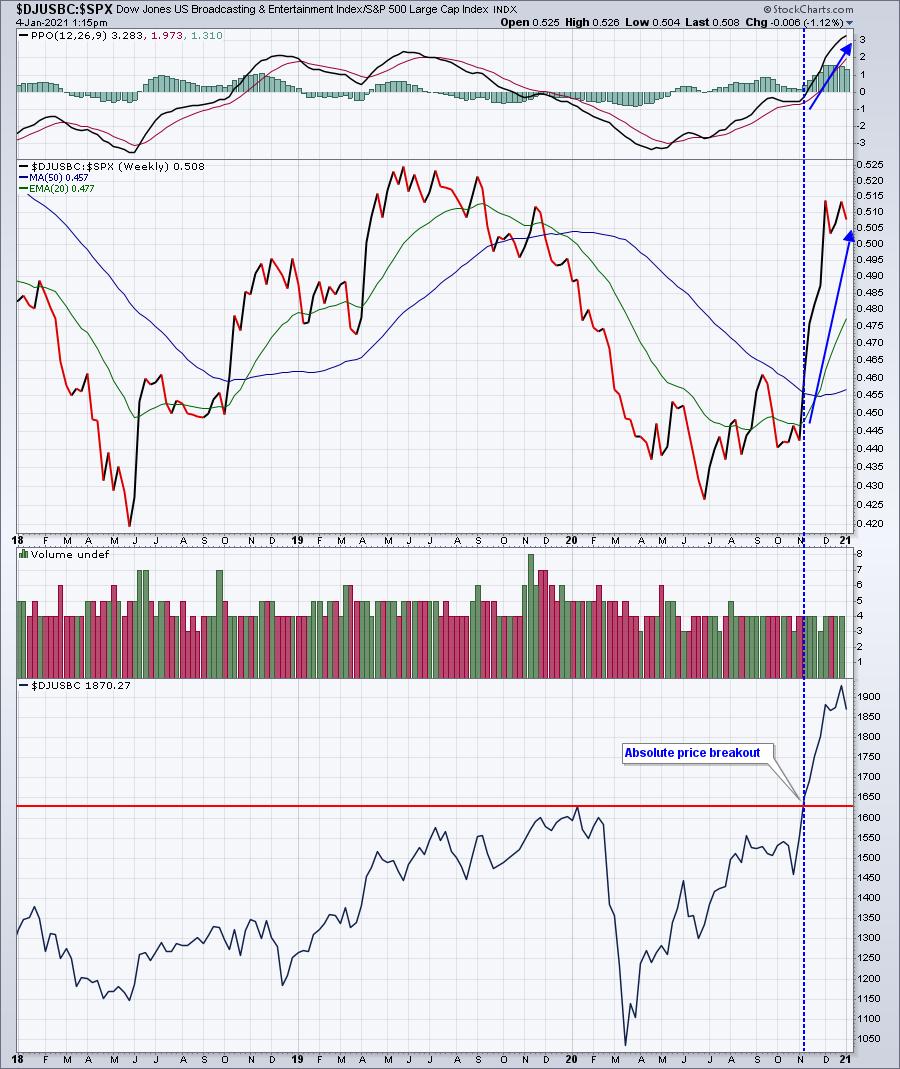
In the bottom panel, you can see the absolute price breakout that occurred at about the time the positive vaccine news was released in November. The relative strength began soaring at that point as well. The look of this chart tells me that we want to be considering trades within this industry. Today's overall market selling might be providing us an opportunity to enter cheaper.
ChartLists/Strategies
I ran a scan across our ChartLists to see which stocks within the broadcasting & entertainment group might be appealing technically, given today's selling. I looked for any stocks within this industry group with SCTR scores above 90. Here are the stocks that were returned:
QRTEA, DIS, FUBO, VIAC, AVID
The two I like best are:
DIS:
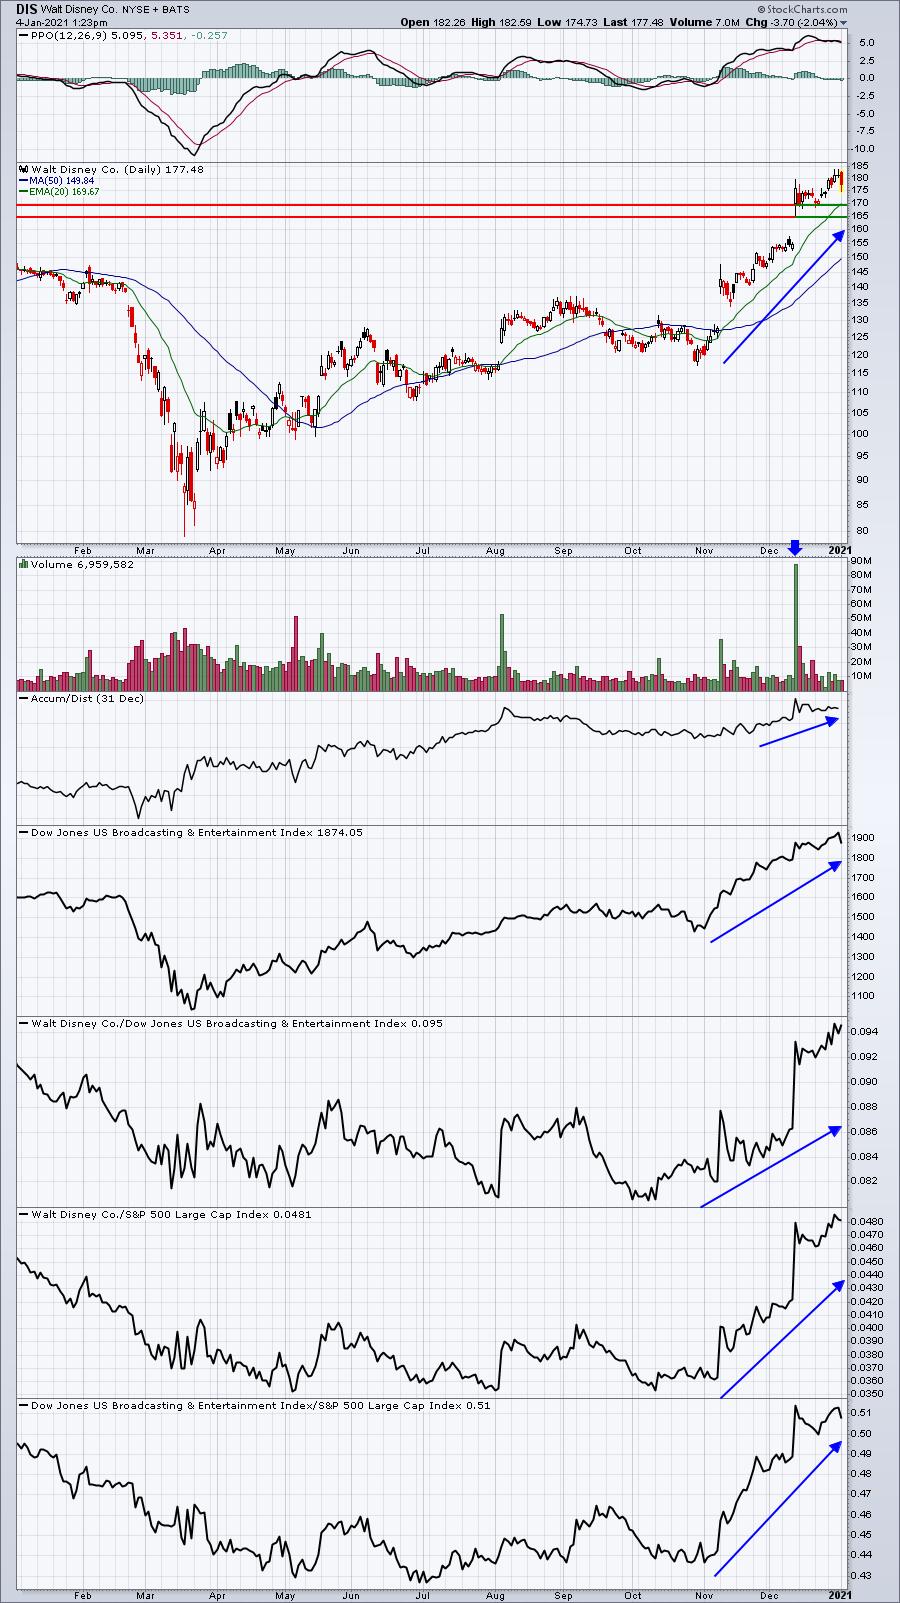
I don't shy away from uptrending stocks, I embrace it. I believe Wall Street is accumulating DIS shares in anticipation of much better numbers in 2021 and beyond. The best short-term support area is between 165-170, which really isn't too far away from DIS' current price.
(Disclosure: I own DIS shares)
AVID:
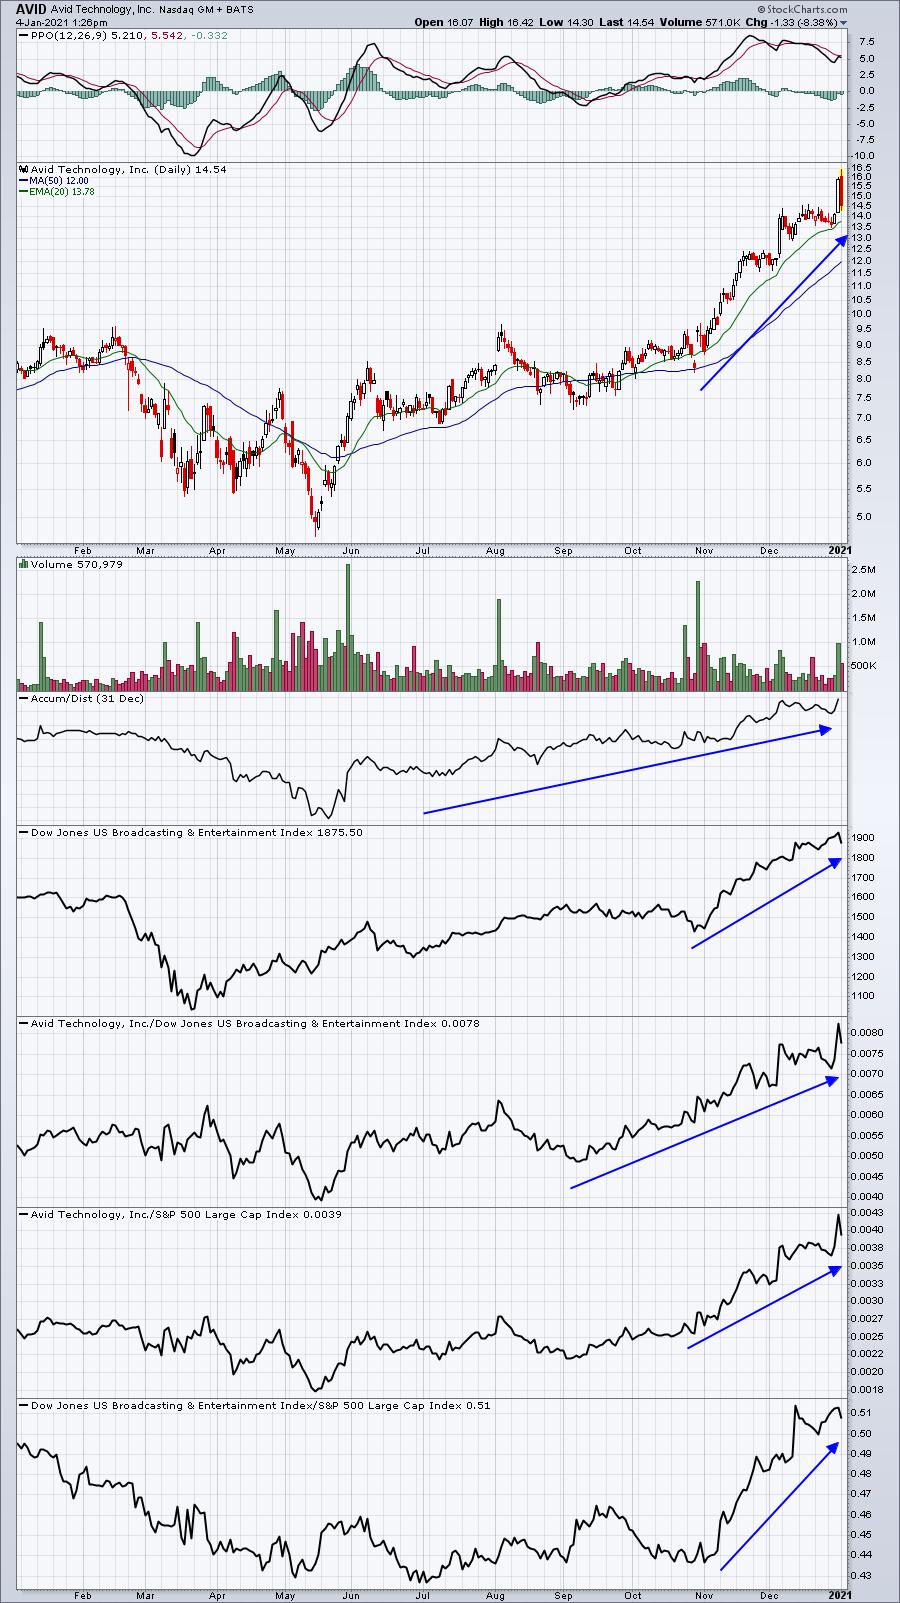
Quite honestly, AVID might be "best of breed". It has a tremendous relative strength line, a bullish AD line, and today's weakness is giving back all of last Thursday's impressive gains. Thursday's volume, by the way, was huge given that it was New Years Eve, which typically has very light volume.
Earnings Reports
Here are the key earnings reports for the next two days, featuring stocks with market caps of more than $10 billion. I also include a few select companies with market caps below $10 billion. Finally, any portfolio stocks that will be reporting results are highlighted in BOLD. If you decide to hold a stock into earnings, please understand the significant short-term risk that you are taking. Please be sure to check for earnings dates for any companies you own or are considering owning.
Monday, January 4:
None
Tuesday, January 5:
None
Economic Reports
December PMI manufacturing: 57.1 (actual) vs. 56.5 (estimate)
November construction spending: +0.9% (actual) vs. +1.0% (estimate)
Happy trading!
Tom