
EB Daily Market Report - Tuesday, January 26, 2021
Saturday Event
We've added a ton of new products and services over the past 18 months. We also have a large number of new members. Given that, we believe it would be a great idea to have a webinar on Saturday and do a thorough walk-through of our website, discussing our entire platform. It should be a great refresher for our longer-term members, while of tremendous value for new members to shorten their learning curve. In addition to the website walk-through, I also plan to discuss the "January Effect". You need to see the impact that solid Januarys have on the performance of the balance of the year. I think you'll be impressed if you haven't seen it before.
My daughter Erin Webber will also participate and share the most frequently asked questions (FAQs) so as to hopefully minimize questions in those areas in the future. Here are the webinar details:
Date: Saturday, January 30, 2021
Event: "A Day in the Life of EarningsBeats.com"
Time: 11:00am ET
Room instructions will be sent out later this week and I'm sure will be posted on our website as well. The event will be recorded for those unable to attend live. We hope to see you there!
ChartLists Added/Updated
The following updates have been made:
- Raised Guidance ChartList (RGCL) through Monday, January 25th's guidance (350 charts now)
- Q4 Earnings ChartList (stocks discussed during Monday event) has been added to our ChartLists page. Scroll down under "Webinar ChartLists" and you'll see it
- Upcoming Earnings ChartLists (5) - this is a new feature where we'll provide all of the companies reporting earnings each day in a separate ChartList. You can download these into your StockCharts.com account, assuming that you're an Extra or a Pro member there. (Otherwise, you can view them, but not download them.) I've provided an example of how you might use this new ChartList in conjunction with others we provide.
Executive Market Summary
- Futures were slightly higher this morning and we've mostly remained in positive territory, though gains have been small
- Short squeezes remain in play as 4 of the top 8 stocks in the S&P 600 Small Cap Index are on our Short Squeeze ChartList (SSCL)
- Gamestop (GME) is soaring 89% one day after I believed yesterday's high was likely the final top for GME
- GME has the highest short % of float in the stock market; the second highest is Virgin Galactic (SPCE, +17.92%), which is breaking out as well
- The 10-year treasury yield ($TNX) is relative flat, despite solid economic reports this morning
- The Federal Reserve has begun its latest meeting with its policy statement due out Wednesday at 2pm ET
- Renewable energy ($DWCREE, +7.96%) is today's top performing industry group, while nonferrous metals ($DJUSNF, -6.02%) falls after FCX reported EPS that fell short of estimates
Market Outlook
One thing that's definitely improved has been the growth vs. value ratio (IWF:IWD). Here's the latest as it tries to break above 1.80 relative resistance:
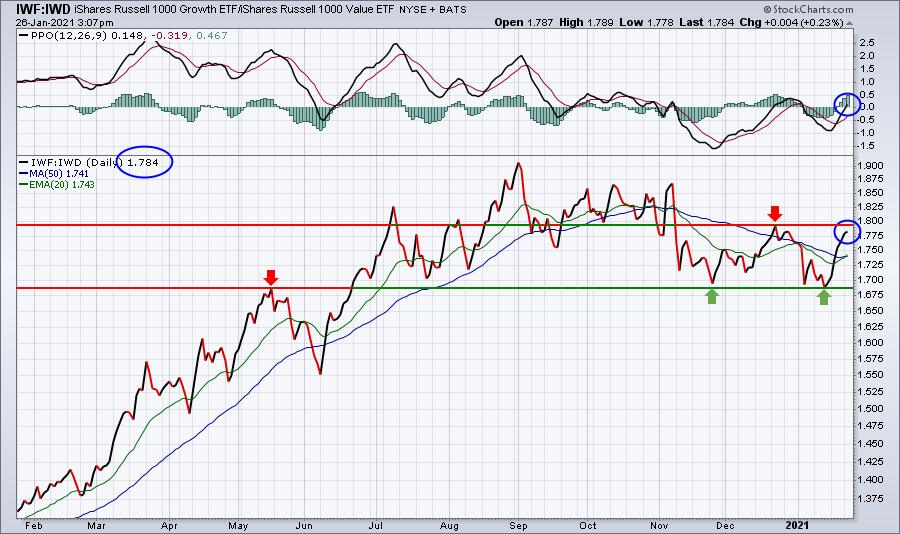
We bounced solidly off that 1.69 relative support level (green arrows) once again - a bullish development. Now the question is can we clear the 1.80 relative resistance established in December. If so, we could make another run at that early-September high just above 1.90.
Sector/Industry Focus
Communication services (XLC) is strong today. Otherwise, it's more of the same as defensive groups rule the roost in the very near-term. This isn't a bad thing as the market consolidates the past couple sessions, but it's something that we'll watch every day as we move forward. Here's today's summary:
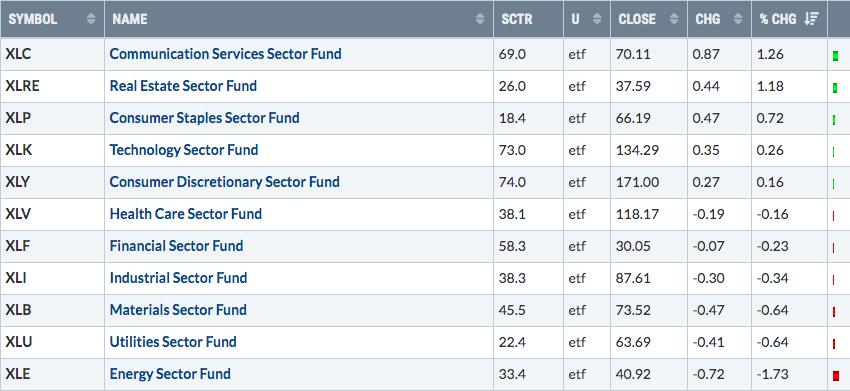
Energy (XLE) is lagging again, by the way. It could result in a close beneath its 20 day EMA, a short-term bearish development.
ChartLists/Strategies
Tomorrow after the close, AAPL and TSLA report earnings. They're included in one of our new "Upcoming Earnings" ChartLists. One interesting scan that you'll be able to run once you've downloaded these latest ChartLists into your StockCharts.com account is the following:
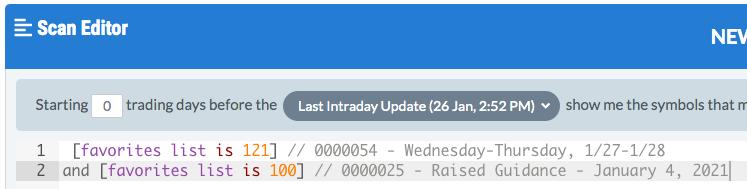
You'll have to add your own ChartLists from YOUR StockCharts.com account. If you try to run the above scan in your account, it won't work. The favorites lists of 100 and 121 are UNIQUE to my account. You MUST select the ChartLists that you've downloaded into your account. I'm pointing this out because this question comes up a lot. Members type in the exact wording shown above, but StockCharts won't recognize those favorites lists in your account.
The results tell us which stocks report either Wednesday after the market close or Thursday before the market open that are also on our Raised Guidance ChartList (RGCL). There are 101 companies reporting earnings on that ChartList and 12 have raised guidance in the past few months. Here are the companies:
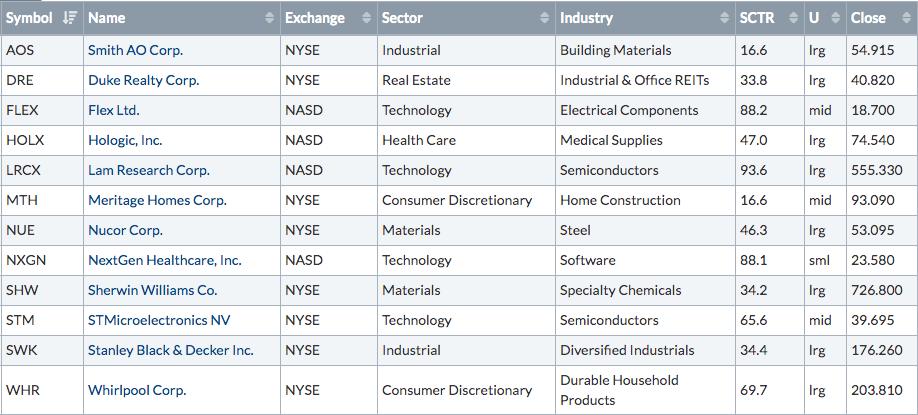
A stock like FLEX could be interesting. It's a leader in a very strong industry group and it's down 6-7% since Monday's opening bell. Here's the chart:
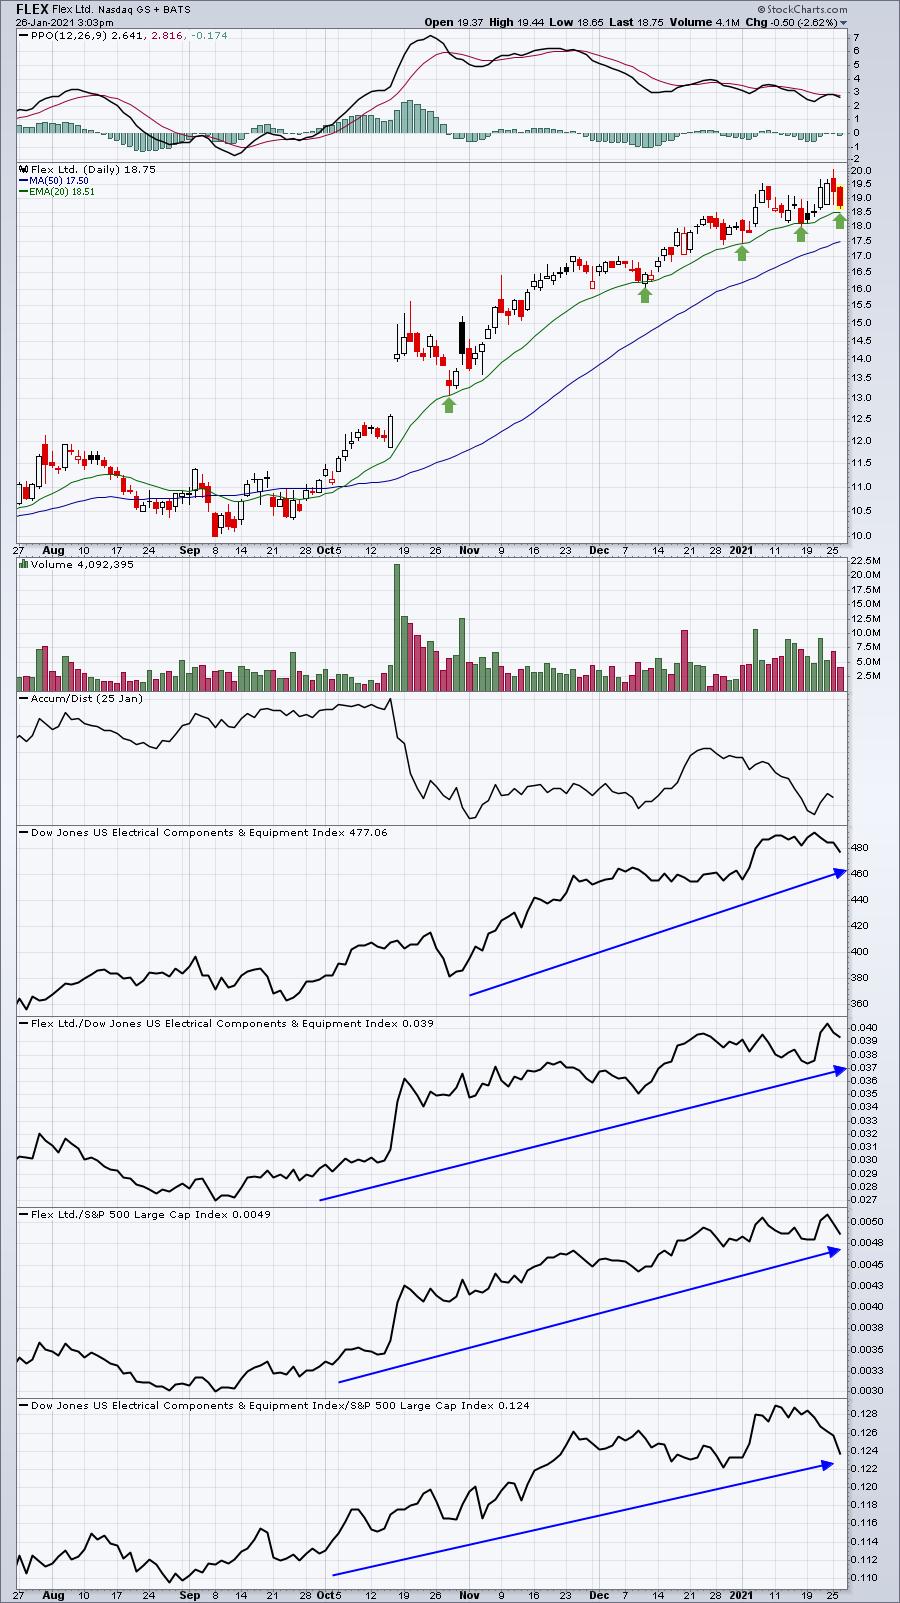
Everyone has to make their own decision about whether to buy a stock just before earnings. It may work out or it may not. I do expect a very solid earnings report, beating expectations, but that doesn't always translate into an opening gap higher after earnings. I can say, however, that if FLEX reports excellent numbers and drops, I'd be a buyer all the way down to a 50 day SMA test (current negative divergences suggests 50 day SMA test is possible). If FLEX doesn't breakout with earnings, there would be an increased chance of such a test.
Earnings Reports
Here are the key earnings reports for the next two days, featuring stocks with market caps of more than $10 billion. I also include a few select companies with market caps below $10 billion. Finally, any portfolio stocks that will be reporting results are highlighted in BOLD. If you decide to hold a stock into earnings, please understand the significant short-term risk that you are taking. Please be sure to check for earnings dates for any companies you own or are considering owning.
Tuesday, January 26:
MSFT, JNJ, VZ, NVS, NEE, TXN, SBUX, AMD, RTX, AXP, MMM, GE, LMT, CNI, PLD, UBS, COF, FCX, PCAR, ROK, ADM, DHI, MXIM, VAR, BXP, CHRW, FFIV, WRB, IVZ, EHC, ALV, PII, ALK, XRX, SLGN, AUDC, LRN
Wednesday, January 27:
AAPL, TSLA, FB, T, ABT, BA, NOW, SYK, LRCX, ANTM, ADP, CCI, NSC, PGR, EW, CP, GD, BX, TEL, LVS, APH, VFC, GLW, AMP, NDAQ, TER, GIB, HOLX, MKTX, URI, HES, ROL, PTC, DRE, TDY, RJF, PKG, CREE, WHR, TXT, MKSI, AZPN, SEIC, LEVI, TTEK, KNX, PB, OSK, SLM, SLG, MTH, EAT, NXGN
Economic Reports
FOMC meeting begins
November Case-Shiller HPI: +1.4% (actual) vs. +0.8% (estimate)
November FHFA house price index: +1.0% (actual) vs. +1.0% (estimate)
January consumer confidence: 89.3 (actual) vs. 88.5 (estimate)
Happy trading!
Tom