
EB Daily Market Report - Thursday, January 28, 2021
Reminder: Saturday Event
Here's a quick reminder of our event this weekend:
Date: Saturday, January 30, 2021
Event: "A Day in the Life of EarningsBeats.com"
Time: 11:00am ET
We will send out a room link to all of our members later in the week and I'm sure there'll also be a link on our website Saturday morning. The event will be recorded for those unable to attend live. We hope to see you there!
Executive Market Summary
- Futures were down overnight, but reversed higher this morning
- Our major indices trade much higher, reversing much of Wednesday's losses
- The 10-year treasury yield ($TNX) is bouncing off 1.00% yield support, as expected
- The rising TNX has sent both financials (XLF, +2.79%) and industrials (XLI, +2.39%) to the top of the sector leaderboard
- Consumer sectors - discretionary (XLY, +0.99%) and staples (XLP, +0.95%) trail the other sectors
- Apple (AAPL, -1.98%) and Tesla (TSLA, -2.68%) are both trading lower after reporting quarterly results yesterday after the close
- Square (SQ, +8.75%) and PayPal Holdings (PYPL, +4.20%) are both having strong days
- Economic reports came in mixed, but Q4 GDP nearly hitting its 4.1% estimate, plus the unexpected drop in initial jobless claims convinced traders to jump back in today
Market Outlook
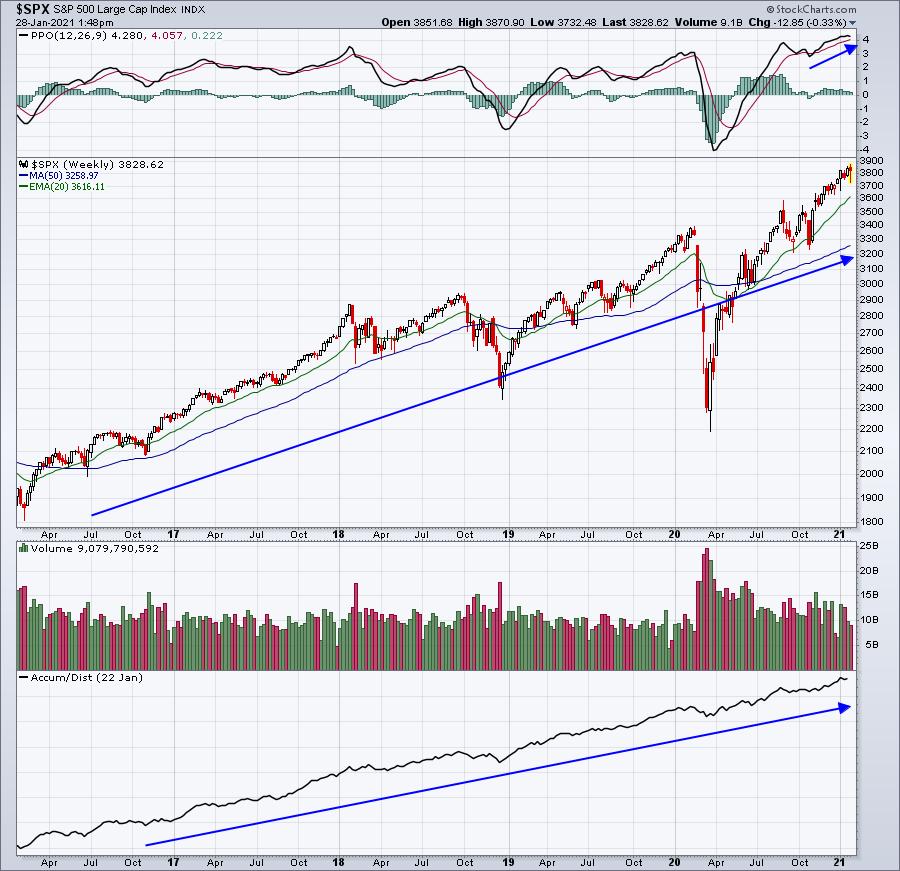
Let's step today and take a Big Picture look at the S&P 500 ($SPX) and NASDAQ 100 ($NDX). The following charts are 5 year weekly charts and help to drown out the short-term day-to-day or even week-to-week noise:
SPX:
NDX:
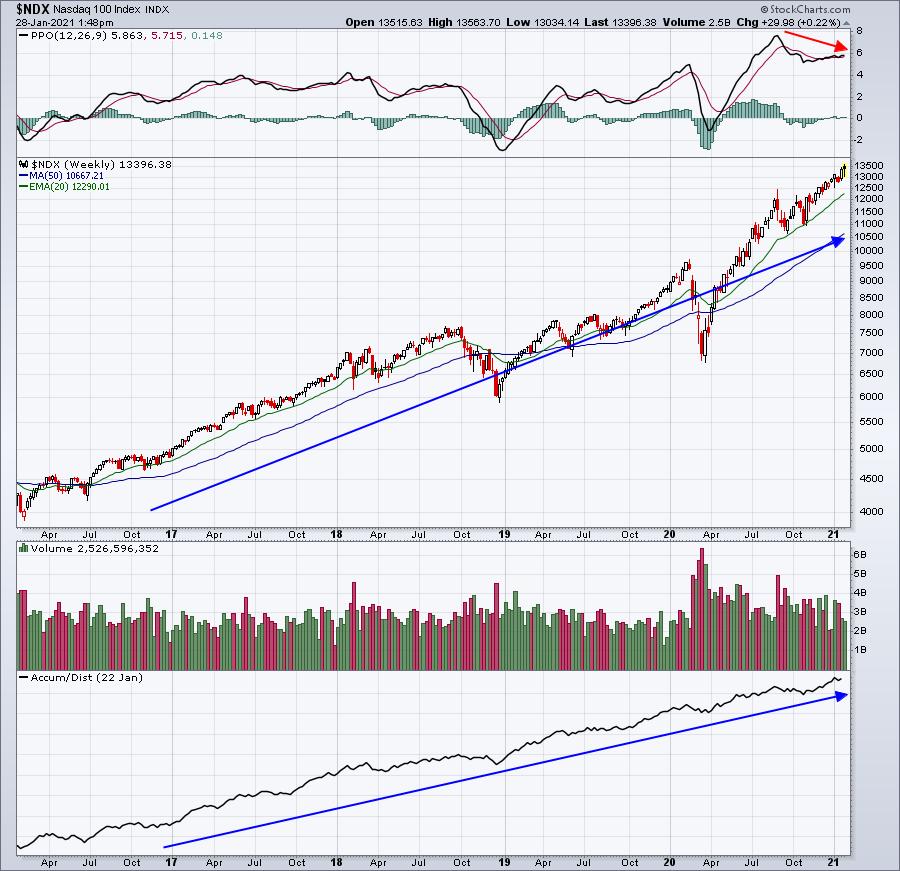
The rising 20 week EMA, when tested, should provide excellent support. The AD lines have been moving higher throughout the past 5 years, barely budging to the downside and supporting my theory that institutions have been accumulating during the trade war and pandemic turmoil.
The one negative on these charts is the lower PPO on this current price high on the NASDAQ. But you also have to understand how these negative divergences occur. The NASDAQ, after being pummeled during the pandemic, rose quickly and we now know why. Profits surged in many of these NASDAQ companies, despite the pandemic. The NASDAQ 100's weekly PPO hit 8 after the huge rally off the March low. It was the highest the weekly PPO has been on the NASDAQ 100 this century. The ascent was so rapid and the PPO so high that it's nearly impossible to print a higher PPO, because it's extremely doubtful we can duplicate the type of trajectory that we saw over the summer. The only other times we've seen NASDAQ 100 PPOs move above 5 was in 2003 and 2009, both times coming out of periods of deep selling. That's just about the only way it can happen.
Based on this, I wouldn't interpret the current negative divergence to be anything terrible. It's simply telling us that the momentum we saw over the summer is impossible to duplicate. We're overbought so a 20 week EMA test could occur at any time, but I wouldn't be a big seller of stocks simply because of the PPO negative divergence.
Sector/Industry Focus
After printing higher lows for 6 straight days, the growth vs. value ratio (IWF:IWD) today printed a lower low. Why is this important? Well, it's suggesting the recent short-term push higher in growth stocks, on a relative basis, could be over. The good news it that the latest rally in this ratio has taken it well above the critical 1.69 relative support level that it kept testing. The bad news is that we failed at short-term overhead relative resistance at 1.80. Here's a reprint of the chart I included in yesterday's DMR:
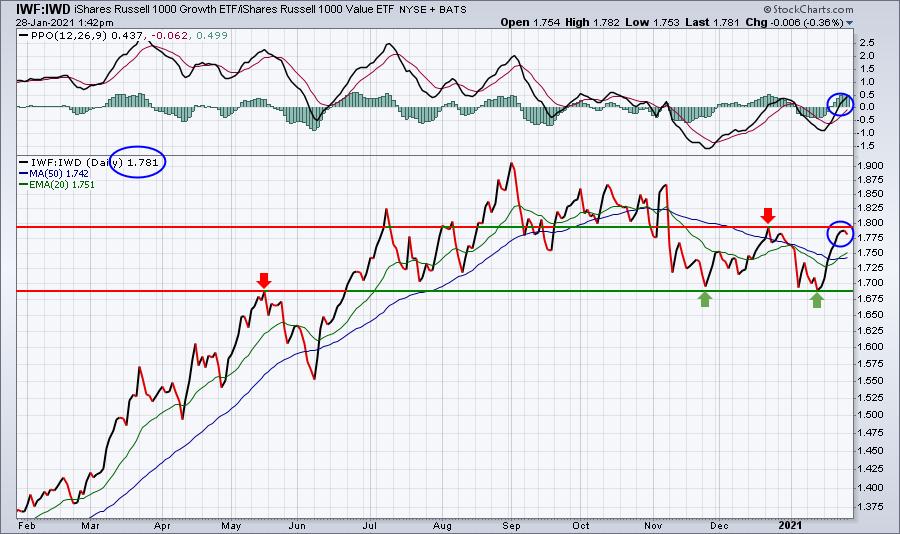
The odds currently favor the value area of the market, including both financials (XLF) and industrials (XLI). However, I'd continue to watch this ratio closely, because a break above 1.80 relative resistance would put growth stocks back in charge.
ChartLists/Strategies
Given the renewed strength in financials (XLF) and industrials (XLI), and the apparent reversal towards value stocks, as discussed above, it probably makes sense to look at a couple of these stocks that are bouncing off key support:
EVRI:
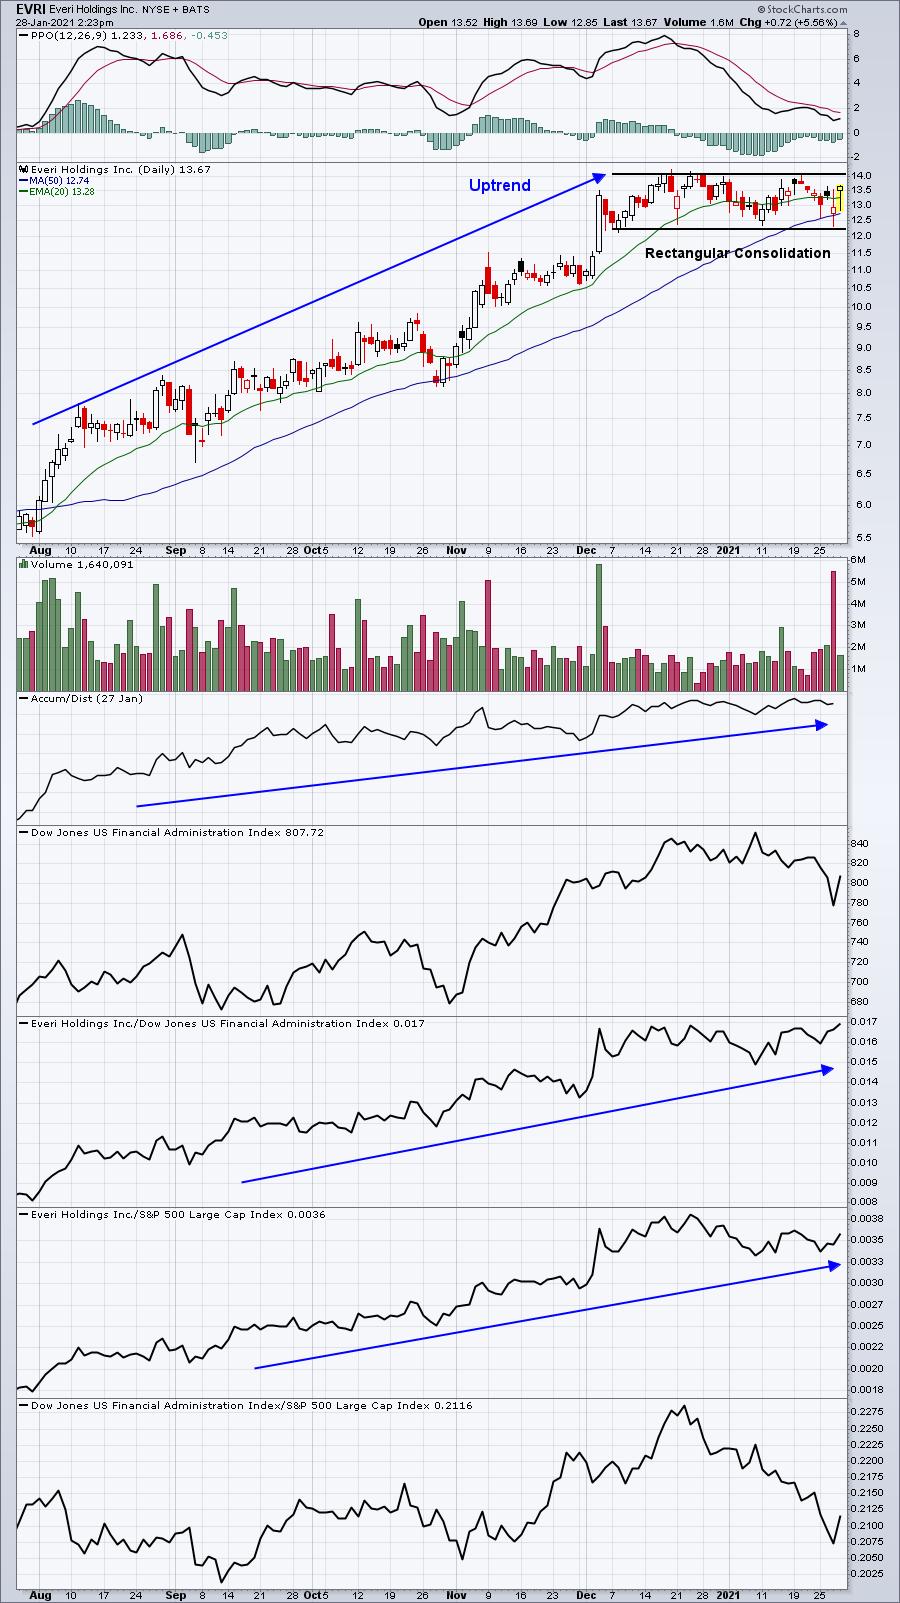
While EVRI has already made a significant bounce, I really like the set up of this chart. A beautiful uptrend, followed by a period of consolidation that's seen the PPO pull back to near centerline support. A breakout of this sideways consolidation would be extremely bullish. EVRI has been a financial administration ($DJUSFA) leader and the this group is the best performing group in financials today.
TDG:
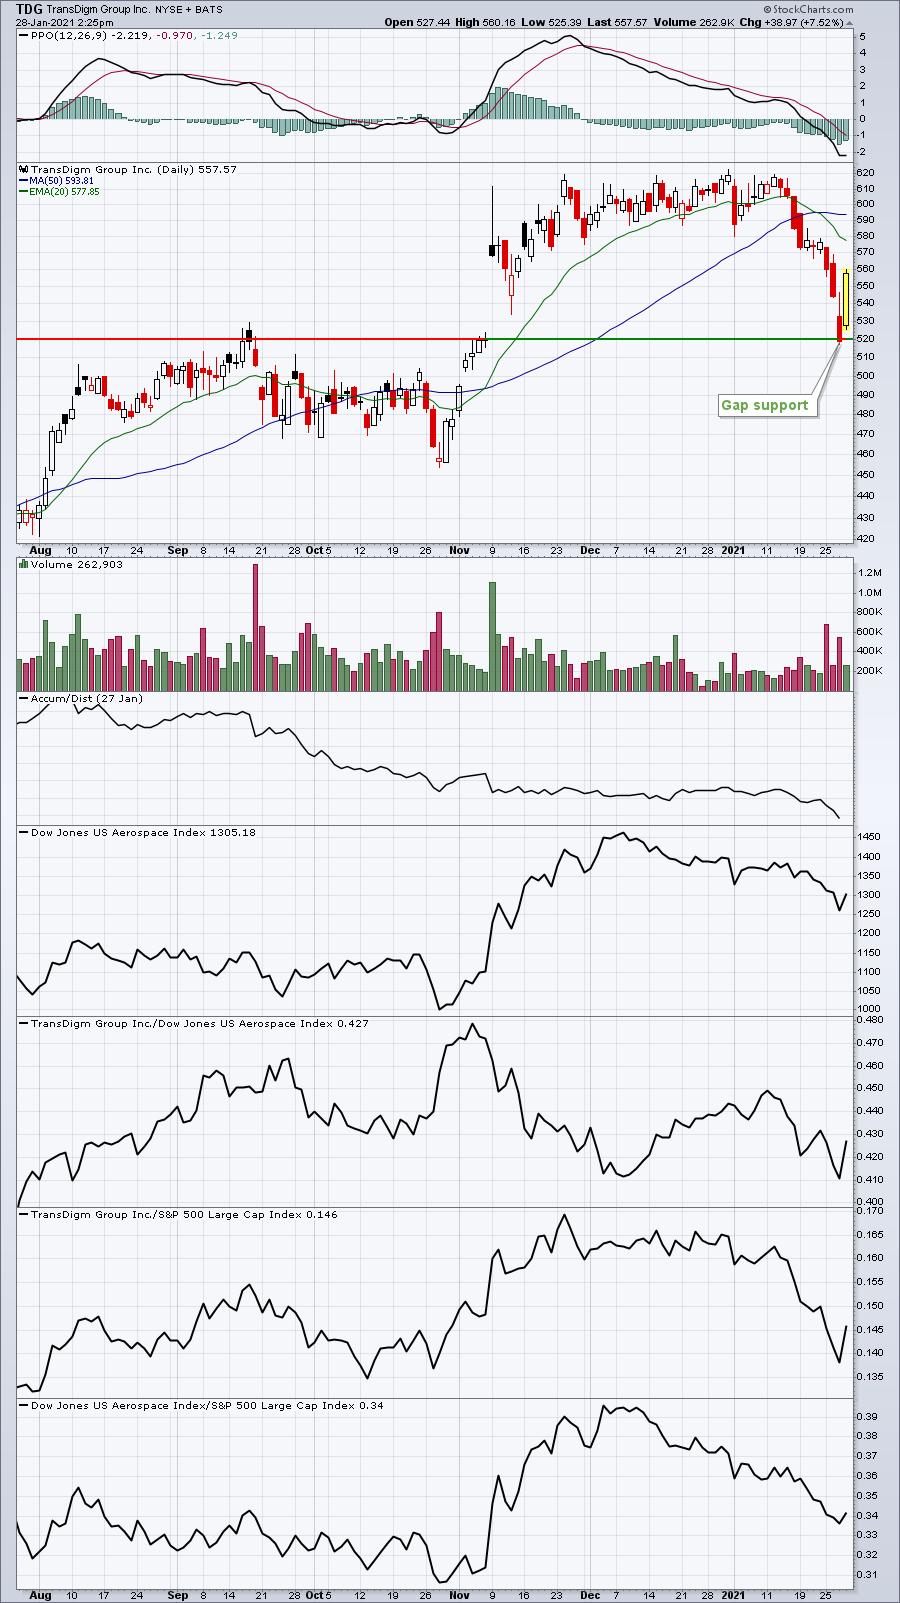
I'm using TDG as an illustration of how gap support can provide a nice trading opportunity. Both EVRI and TDG are on our Strong Earnings ChartList (SECL), which can and should be used for short-term trading opportunities. The big problem with TDG now is that its recent volume trends have turned weak, the AD line is very suspicious and TDG belongs to the aerospace group ($DJUSAS), which has been one of the worst performing industry groups since the pandemic began. I would expect short-term failure at the 20 day EMA, so we might see this one trade back down again, continuing to build a possible base after its earlier uptrend.
Earnings Reports
Here are the key earnings reports for the next two days, featuring stocks with market caps of more than $10 billion. I also include a few select companies with market caps below $10 billion. Finally, any portfolio stocks that will be reporting results are highlighted in BOLD. If you decide to hold a stock into earnings, please understand the significant short-term risk that you are taking. Please be sure to check for earnings dates for any companies you own or are considering owning.
Thursday, January 28:
V, MA, CMCSA, DHR, MCD, MDLZ, MO, SHW, MMC, NOC, DOW, STM, TROW, XEL, MSCI, RMD, TEAM, SWK, SWKS, LUV, MKC, VLO, AJG, RCI, TSCO, DOV, NUE, ABMD, WDC, CE, FICO, PFG, EMN, PHM, WRK, FLEX, PNR, DLB, AAL, JNPR, RHI, BC, HLI, JBLU, X, MTSI, EGHT, ADS, GATX, KEX, FCFS, NTCT, FLWS, OSIS, BZH
Friday, January 29:
LLY, CVX, SAP, HON, CHTR, CAT, CL, ROP, ERIC, LHX, JCI, PSX, LYB, WY, CHD, SYF, BAH, GNTX, DSKE
Economic Reports
Q4 GDP: +4.0% (actual) vs. +4.1% (estimate)
Initial jobless claims: 847,000 (actual) vs. 875,000 (estimate)
December new home sales: 842,000 (actual) vs. 871,000 (estimate)
December leading indicators: +0.3% (actual) vs. +0.3% (estimate)
Happy trading!
Tom