
EB Daily Market Report - SPECIAL REPORT - Monday, February 1, 2021
I am going to scrap the usual DMR today for a SPECIAL report. Given the incredible volatility the past week or so, and huge amount of media coverage of GME, AMC, BBBY, and a host of other very heavily-shorted stocks, I want to concentrate on the HUGE number of questions that I'm receiving from EarningsBeats.com members regarding short squeeze stocks.
Brief Market Update
Let me first take a pause and give you a quick update on the market: Volume is strong and we're seeing our major indices, especially the aggressive NASDAQ 100 ($NDX), clear important short-term technical hurdles. I don't believe we're completely out of the woods and that a major bottom is in, but I do find it comforting to see one of our most aggressive indexes bounce back through its 20 hour EMA on increasing volume. That's a very good response to what we saw last week. Also, the IWF:IWD ratio (growth vs. value) is moving higher again - 1.79 at last check - as money rotates back towards growth. These are very positive signs.
I wrote an article over the weekend regarding the Volatility Index ($VIX) and the fact that readings in the 30s and 40s usually coincide with very significant bottoms. The VIX is a contrarian indicator and when the VIX reaches the 30s and 40s, it means that the pricing of options is at an extreme. Such extremes typically coincide with market bottoms. That's not my opinion. That's a fact. The only question is "how much fear is enough?" Well, again, a VIX in the 30s or 40s normally does the trick. Friday's high on the VIX was close to 37. That could have been it.
Reddit traders are pausing from trading stocks and have moved, at least temporarily, to silver, which is higher by roughly 9% today. Other commodities, including crude oil ($WTIC, +2.36%), is higher on the session as well.
The money fueling today's rebound in U.S. stocks is rotating into the three aggressive pillars - technology (XLK, +2.86%), communication services (XLC, +2.29%), and consumer discretionary (XLY, +2.05%). Only real estate (XLRE, +1.36%) is up more than 1% among the remaining sectors.
Now to the Short Squeeze Questions
I have probably received 30 questions since Saturday's webinar regarding a number of issues, but many are related to what we've been seeing in the stock market surrounding Reddit traders, short squeeze stocks and appropriate trading strategies, short squeeze sources, how often short squeeze %s are released, etc. I simply don't have the time to answer all questions individually, so I felt it was important to address as many as possible in this special report.
Question: Should we be concerned about Reddit traders forcing hedge funds to liquidate high quality names in order to cover their short positions? If so, could we be setting up for another market plunge?
My Answer: I can only answer for myself, giving you my opinion. I don't have a crystal ball. However, many TRILLIONS of dollars are exchanged every day in the U.S. financial markets. A few hedge funds overexposed on the short side to a few small companies will not have nearly the impact that media outlets would have you believe with all their dramatization. For them, it's about viewers and clicks. Your personal financial well-being is of limited concern to them. Look at the rotation today into the XLK, XLC, and XLY. Armed with all of this information, Wall Street is buying all the aggressive names that were being sold hand over fist last week. What changed?
Question: How do I set a target on a short squeeze stock?
My answer: Honestly, I have no idea. Make sure you take profits along the way if you're fortunate enough to catch a big short squeeze like GME, AMC, BBBY, and others. This is not a technical analysis (TA) question. TA requires rational price action and behavior. Short squeezes are anti-rational. It's all about supply and demand. I've had members ask me if they should short GME now? NO WAYYYYYYYYYYYY! Buying triggers more buying in short squeezes. I have no idea when the music will stop. But if you want a history lesson on a previous stock that was somewhat similar to GME, let's go back to 2018 and look at Tilray (TLRY). When TLRY went public, investors loaded up their short coffers, believing TLRY was way overvalued. But when a breakout occurred, check out the resulting rocket action to the upside:
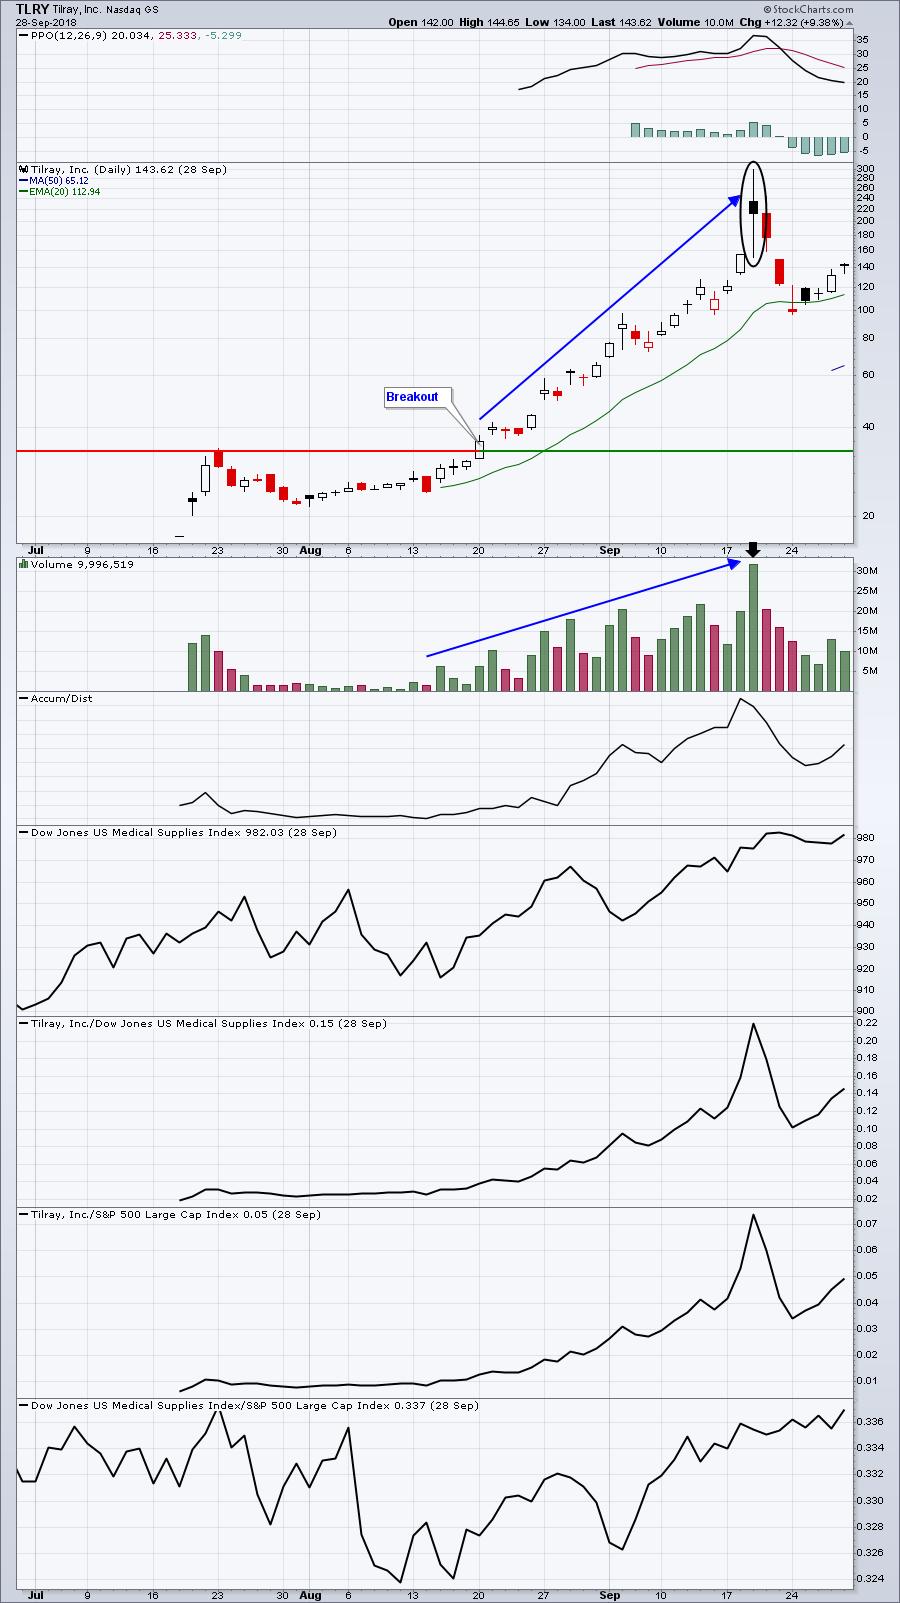
The breakout occurred, then the volume and price surged. The ultimate high was hit as volatility reached a pinnacle and filled candles began to print. In other words, there wasn't enough demand after the opening bell to carry prices higher throughout the day. So what happened to TLRY after that:
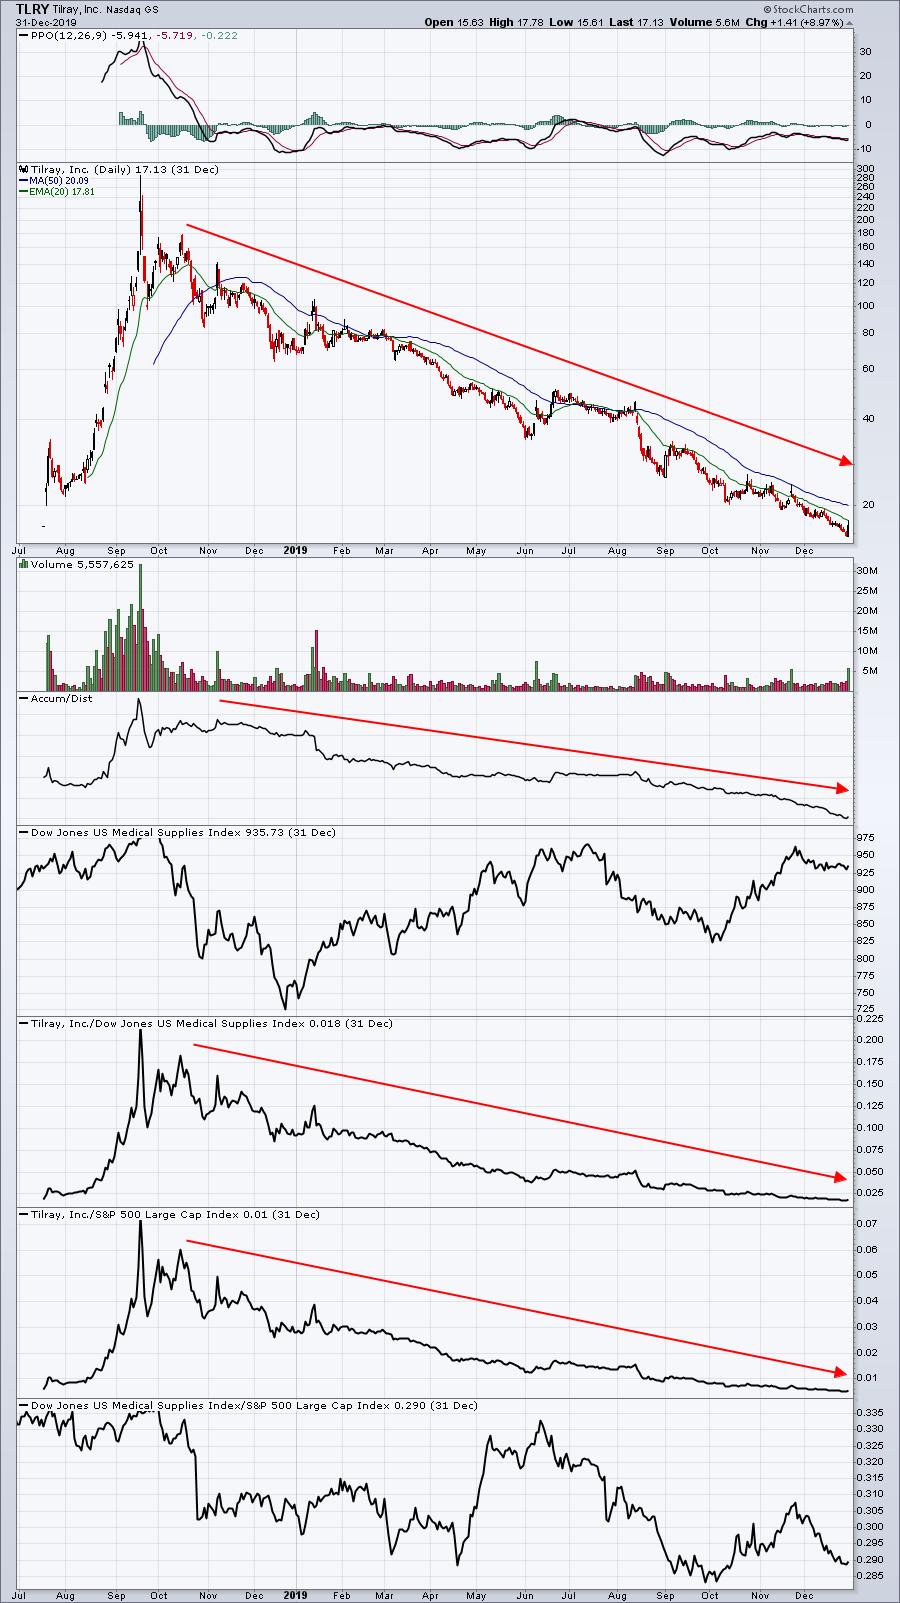
Short squeezes are a supply and demand issue. There was a TON more demand on TLRY than there was supply. And prices soared with buyers trampling one another. But it did reach a point. Would you have wanted to have been the last one buying at $300 per share?
LESSON #1 - Take your profits and do NOT be greedy. Also, if you're wondering right now whether to buy or sell GME, I'd say go golfing and forget about GME. This is now a gamblers market. That's not what we do at EarningsBeats.com. We're smarter than that - hopefully. The time to consider short squeeze stocks is when they first begin to turn the corner and trend higher. Watch the volume. Catch it early on breakouts. That's why provide the Short Squeeze ChartList and the short % of float. We provide you the research and knowledge to trade smarter than everyone else. If you want to take a chance, buy a few small positions. If one breaks out, it'll likely be strong enough to cover any losses on the other two.
Question: What are the best strategies to capture short squeezes before they happen?
My answer: I think I answered that a bit in the previous answer, but also do your homework and be prepared. We provide a Short Squeeze ChartList and we also provide the combination of Strong Earnings and Strong Future Earnings ChartLists. Know which Short Squeeze ChartList stocks reside on either of those two ChartLists. Here's the scan syntax:
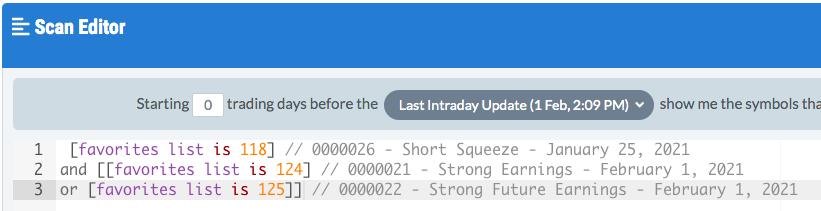
29 stocks were returned. That's nearly half the Short Squeeze ChartList. Remember how the Strong Future Earnings ChartList is derived. Any stock NOT on the Strong Earnings ChartList, but with a SCTR score over 80 (or 95 in a weak industry group) is on the Strong Future Earnings ChartList. Well, these SSCL short squeezes have sent many of the stocks soaring, making them eligible for the SFECL. Keep that in mind.
Now that we're providing you the Upcoming Earnings ChartLists by day, you can also run the SSCL vs. these ChartLists to see which SSCL stocks will be reporting earnings this week. Here's the scan syntax for that:
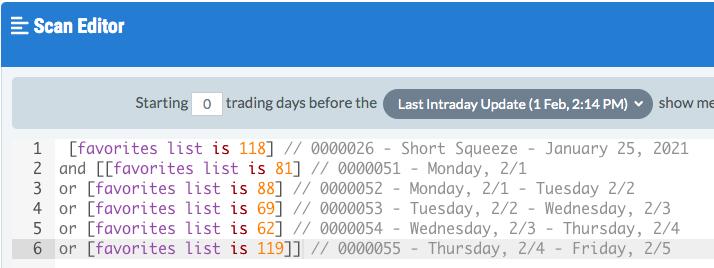
One stock was returned - LCI, which reports its earnings on Wednesday, 2/3 after the market closes. The Upcoming Earnings ChartLists only contain those companies with market caps of greater than $1 billion. Many of the Short Squeeze ChartList stocks have market caps below $1 billion, so you should still check Zacks.com for additional companies reporting.
WARNING: If you look at both my scan syntax descriptions above, you'll see "favorite list is..." These are lists that are specific to MY StockCharts.com account. If you type into your account exactly the scan syntax provided above, it is NOT going to work. You MUST select the ChartLists in YOUR StockCharts.com account.
Question: Where do you find short squeeze information? Who publishes it?
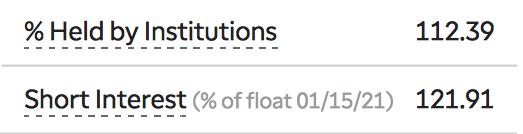
My answer: Brokers must report shares short to the various exchanges. These exchanges then publish this data twice a month. The exchanges charge a fee to gain access and data of any kind is typically quite expensive, usually price-prohibitive for an individual to purchase it. Brokers and major financial websites purchase this information and then allow their customers to view it. I have seen varying numbers, however, from different reputable sources. Let's take GME as an example. This is what I see at TD Ameritrade:
....then there's Yahoo Finance.....
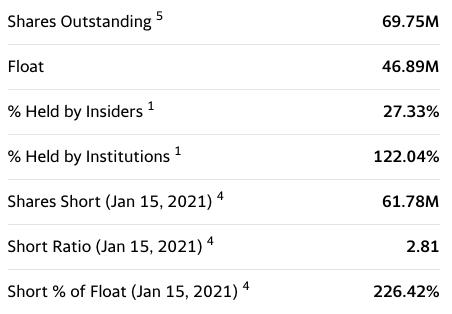
Yahoo says short % of float is 226.42%, while TD Ameritrade says 121.91%. But dig a little deeper at Yahoo. It says that shares short are 61.78 million. It says that float is 46.89 million. Do the math. It's not 226.42%!
The bottom line is this. I don't need to know if the short % of float is 25%, 55%, or 140%. I just need to know if it's heavily shorted. Yes, 140% is better than 25%, but a high short % of float is good enough for me. It tells me that there's a clear potential imbalance in supply and demand, especially if we see a breakout and volume accelerate.
If you prefer to get the data directly, here it is (but you'll have to pay A LOT for it):
That's enough for today. I may do these SPECIAL REPORTS more often as the questions dictate. Just please know that I don't intentionally ignore anyone's questions. I simply have a lot to do and answering 30 different technically-oriented questions could literally take up my entire day.
Happy trading!
Tom