
EB Daily Market Report - Friday, February 5, 2021
Executive Market Summary
- Futures were strong again with all of our major indices moving higher
- We've traded mostly sideways since the opening bell, however
- January nonfarm payrolls were released and they were positive, though slight (and as expected)
- The 10-year treasury yield ($TNX) initially moved higher, breaking above the January high, but it has retreated some and is currently up just 1 basis point to 1.15%
- Earnings continue to outpace expectations, but that isn't always resulting in positive initial reactions
- Peloton (PTON, -7.91%) beat revenue and EPS expectations, raised guidance on both, but is struggling nonetheless
- Snap, Inc. (SNAP, +5.25%) and Pinterest, Inc. (PINS, +5.25%) - 2 portfolio stocks - also posted solid reports and are currently being rewarded
- News Corp (NWSA, +6.45%), an Income Portfolio stock, also is trading higher after reporting better-than-expected results
Market Outlook
Let me first emphasize that I remain extremely bullish and believe prices are heading higher in 2021. If my strategy was long-term, I'd absolutely stick to my plan and not allow the frequent "noise" (from the media) and various periods of profit taking and consolidation unnerve me. However, short-term traders should beware the historical tendencies in February. We generally perform very well to open the month (February 1-3) and then rally again heading into mid-month (February 11-15), but the difference between the first half of the month's performance vs. the 2nd half is worth noting:
February 1-15: +8.09%
February 16-28 (29th in leap years): -7.30%
These are the annualized returns of the S&P 500 since 1950. There's not a huge disparity, but as we wrap up most of the earnings reports over the next 1-2 weeks, just remember that the history of the stock market favors further consolidation, possibly even a bit of selling. That does NOT mean I'd be raising 100% cash, but it does tell me to not be afraid to take profits and reinvest them later in other opportunities.
Sector/Industry Focus
It's a bit strange today in terms of sector leadership. We're setting fresh all-time highs across a few key indices, yet technology (XLK, -0.28%) is the only sector that's currently in negative territory. Materials (XLB, +1.77%) and energy (XLE, +1.18%) are leading. But let's point out the renewed recent strength in communication services (XLC, +0.84%). Here's the latest one week performance summary of our various sectors:
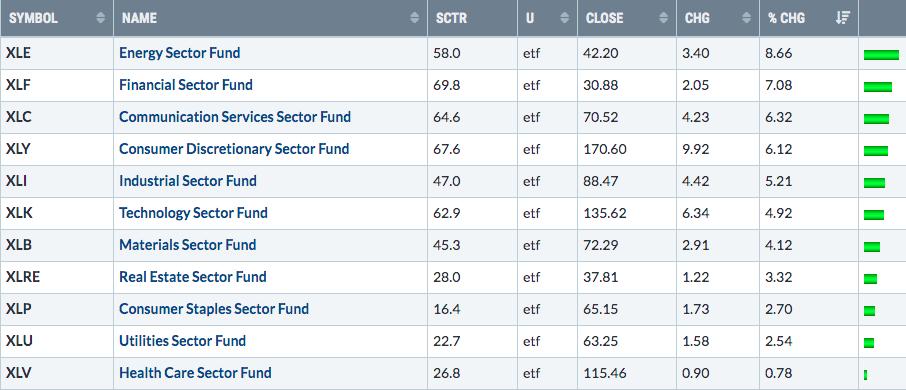
It is nice to see in that third spot and also breaking out again on an absolute basis:
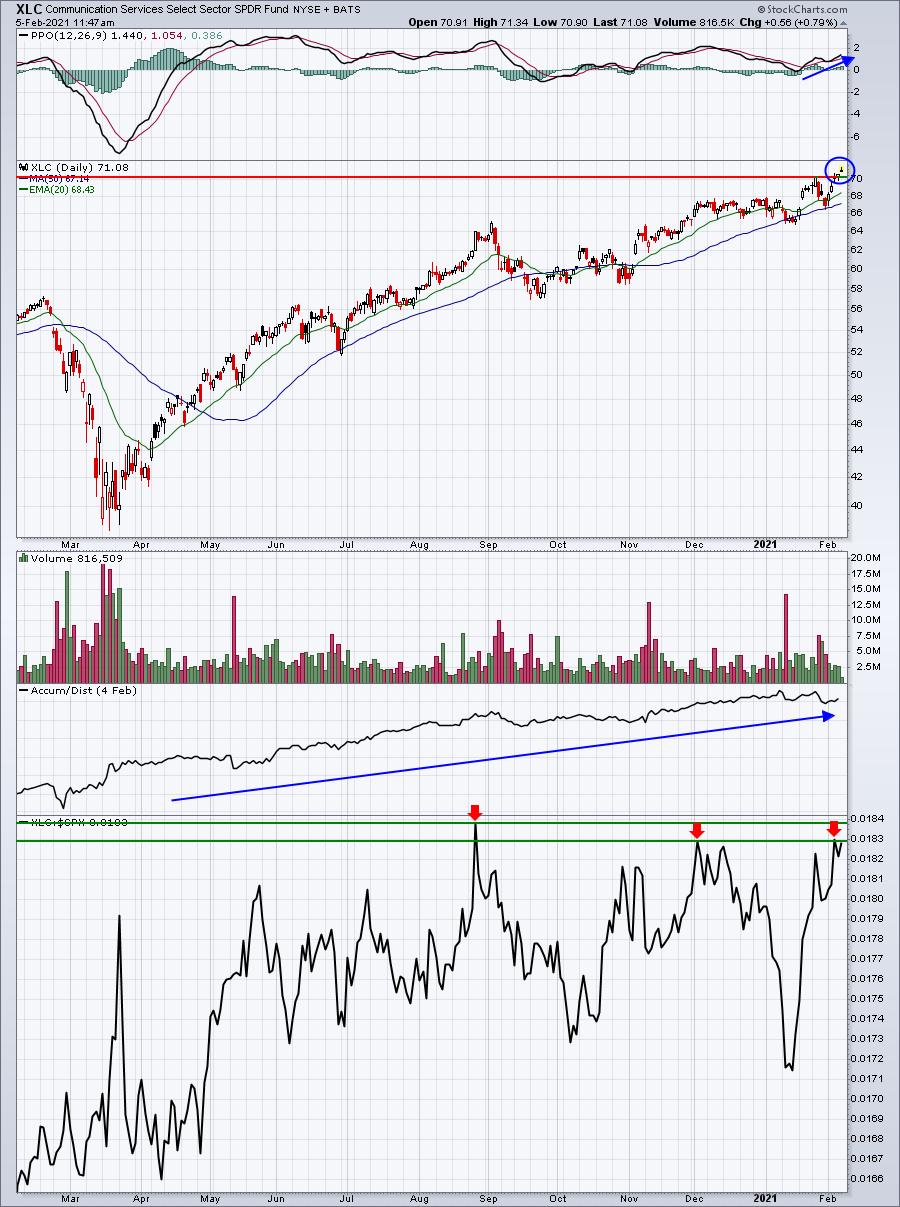
The breakout is accompanied by renewed momentum as the PPO begins to accelerate after a recent centerline test. The AD line has remained very strong. And we're nearing a couple critical relative resistance levels. Breaking above those would be extremely bullish for the group.
ChartLists/Strategies
I'll go over two real-time trades of mine.
The first, Zoom Video Communications (ZM), is a position that I've been building for quite awhile. It's in our Model Portfolio and it's required a TON of patience, something I don't have a whole lot of as a trader, to be quite honest. I had one buy order in at 325 that was never filled. I've been seeing positives build recently. The last price low in January coincided with a higher AD line. So while ZM was pulling back, there didn't appear to be significant institutional distribution. Then in mid-January, we finally saw ZM break above its 20 day EMA and mostly hold above it. It printed a higher price low and today is breaking above its recent price high. Volume is clearly accelerating as well. ZM also is strengthening on a relative basis since bottoming to open the year. Here's the chart:
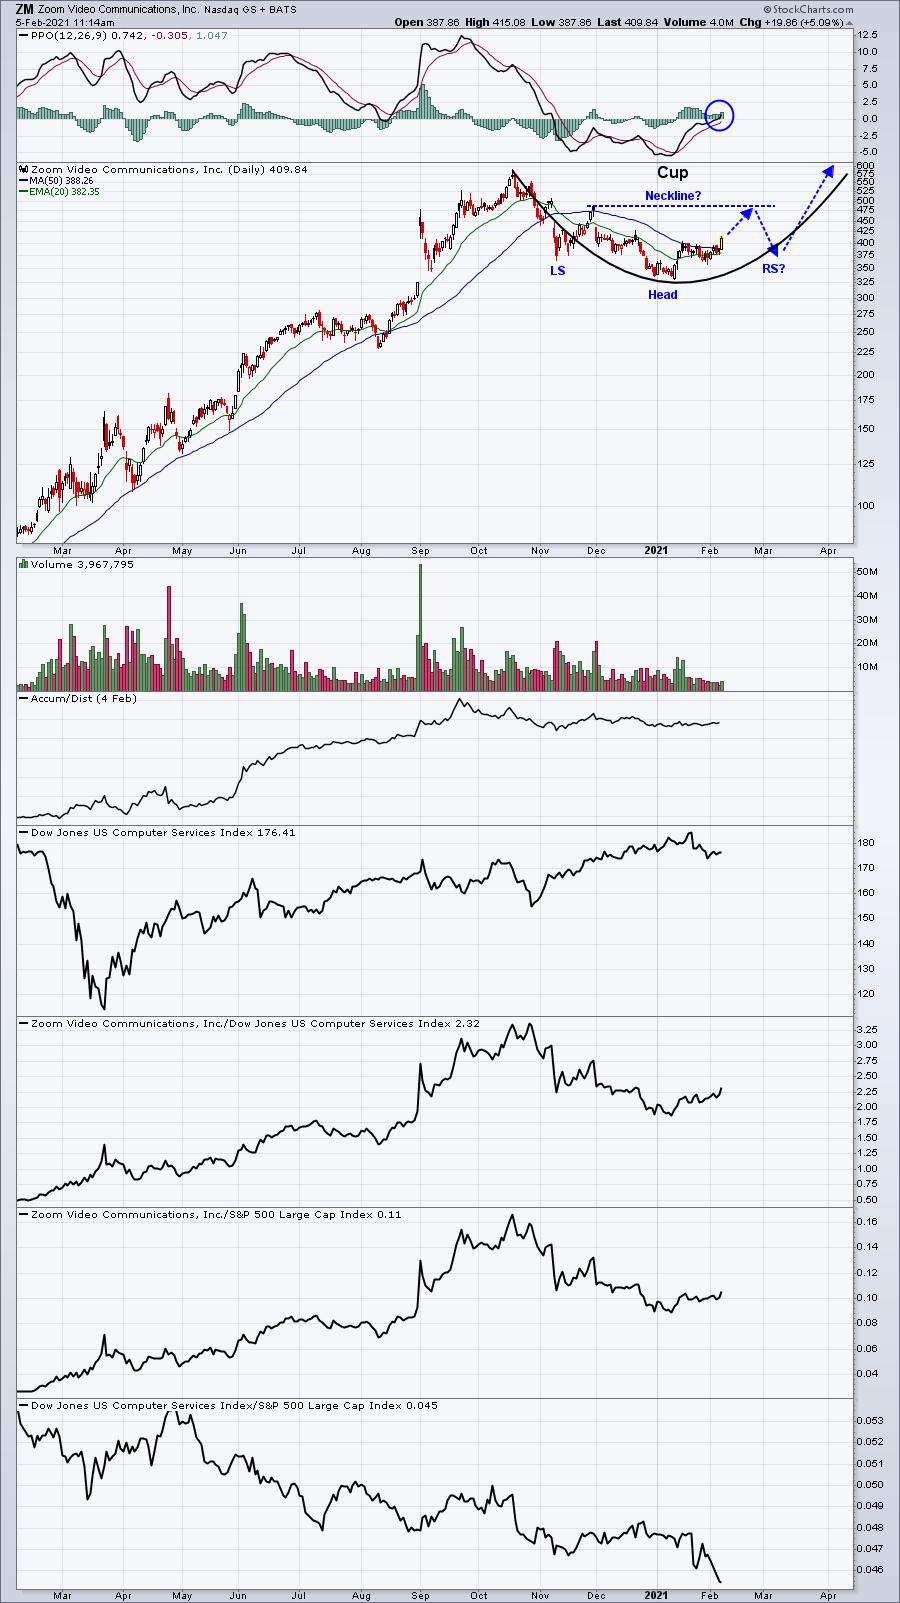
The biggest piece of this technical puzzle is whether we actually see a closing breakout today. A failure with a long tail to the top and a close back near today's open would be much more bearish. If we do see a breakout, I'd expect Wall Street firms to begin pounding the table on ZM next week - issuing strong buys, raising forecasts, etc. It's simply the way the market works. The big firms accumulate and then tell us to buy after they're done buying. The supply of shares is reduced and then retail trades bid up the remaining shares.
If the breakout is established at today's close, then I'd now view ZM as an uptrending stock rather than a consolidating one. That means that 20 day EMA tests become buyable. Also, begin to look more for weak mornings followed by strength in the afternoon. Finally, looking ahead, I could see two potential patterns developing. The blue pattern is an inverse head and shoulders, while the black pattern is a cup. Both are bullish continuation patterns.
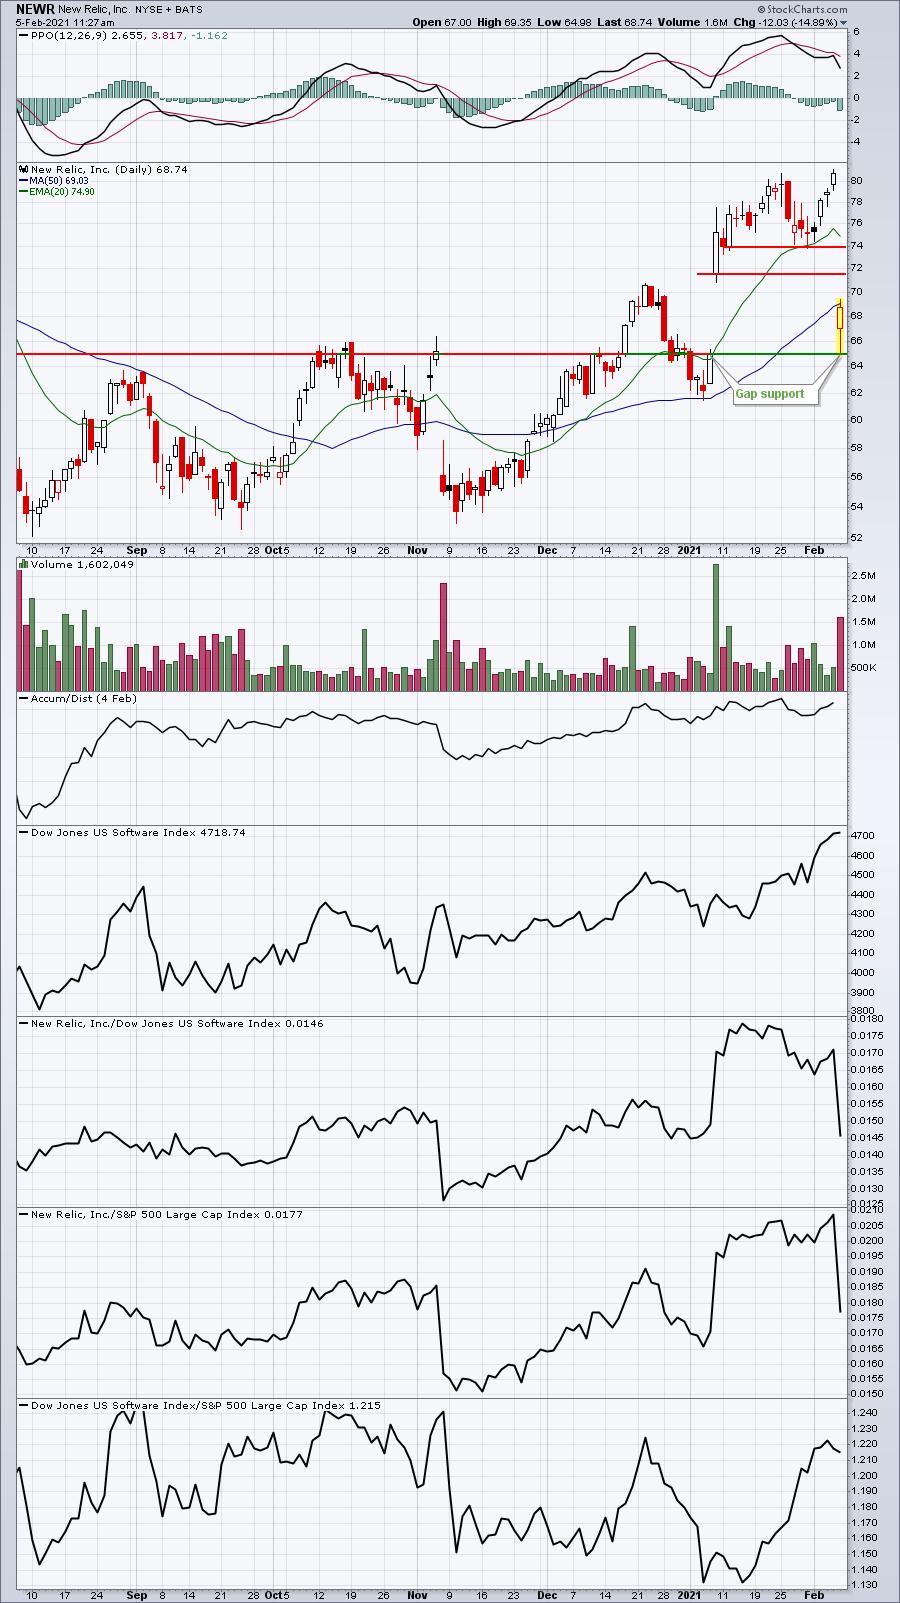
Another trade that I just made this morning came from our Upcoming Earnings ChartList, which is a new feature that I've been discussing lately. I noticed at the open this morning that NEWR was the worst performing stock 2 minutes into today's trading action, down approximately 20%. Keep in mind that when stocks gap lower, there's a ton of sellers, so market makers provide liquidity by going long. More often than not, those market makers will make money. I also noted that NEWR fell back to a key gap support level, so I took a chance and am trying to ride the coattails of the market makers. I place a stop market order on any trade below 64. I entered near 66, so I'm risking 3% on this trade. I'll show you the daily chart and gap support first....and then the hourly chart where I'd look to exit quickly if it hits:
NEWR - daily chart:
NEWR - hourly chart:
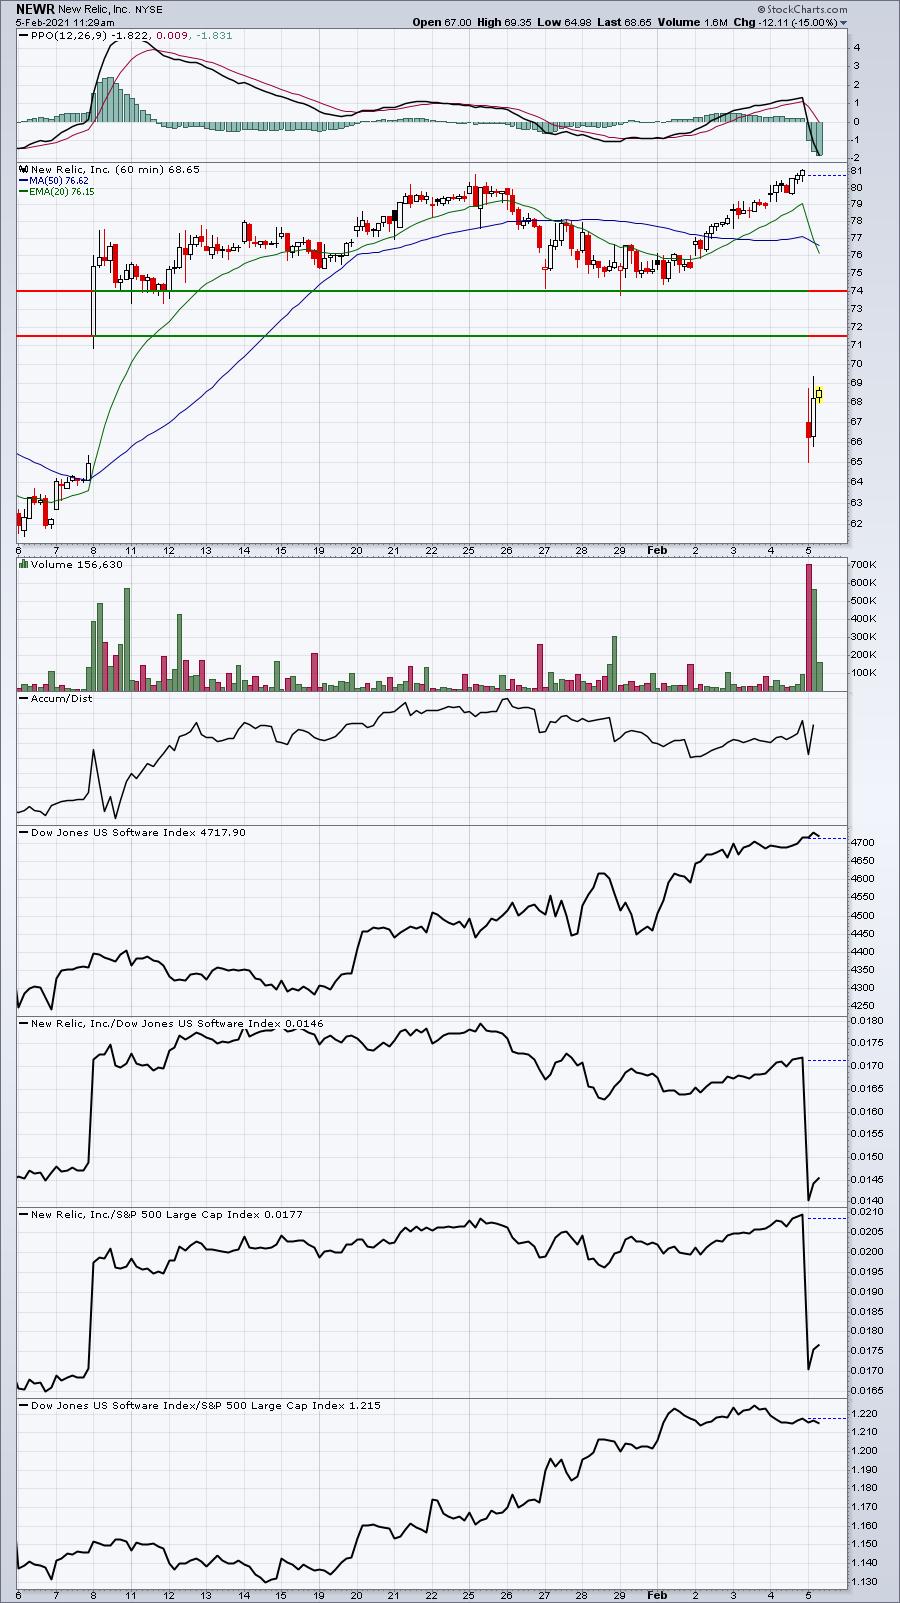
NEWR is a completely different type of trade for me. In this case, I'm simply banking on the fact that market makers have it in their best interest to take the stock higher. Also, I have no long-term allegiance to NEWR. I will almost certainly be out of this stock one way or the other by 4pm ET. I won't hold overnight. There could be downgrades coming, reduced price targets, whatever. I will either take my profits today or be stopped out. Because I now am up on the trade, I might consider raising my stop to my entry price or perhaps a bit higher to guarantee that I walk away with at least my original capital intact.
If you like to short-term trade, the Upcoming Earnings ChartList might be a very valuable resource for you. I absolutely love it.
Earnings Reports
Here are the key earnings reports for the next two days, featuring stocks with market caps of more than $10 billion. I also include a few select companies with market caps below $10 billion. Finally, any portfolio stocks that will be reporting results are highlighted in BOLD. If you decide to hold a stock into earnings, please understand the significant short-term risk that you are taking. Please be sure to check for earnings dates for any companies you own or are considering owning.
Friday, February 5:
LIN, SNY, EL, ITW, REGN, AON, TT, ZBH, CAH, CBOE, BERY, HRC, LAZ, SPB, ADNT, ROAD
Monday, February 8:
GPN, SPG, KKR, TTWO, NUAN, HAS, CHGG, JKHY, CNA, DNB, RE, ACM, RGA, OMF, CDK, HQY, VRNS, RAMP, AMG, SAIA, CRNC, SSD, AMKR, BECN
Economic Reports
January nonfarm payrolls: 49,000 (actual) vs. 50,000 (estimate)
January private payrolls: 6,000 (actual) vs. 35,000 (estimate)
January unemployment rate: 6.3% (actual) vs. 6.7% (estimate)
January average hourly earnings: +0.2% (actual) vs. +0.3% (estimate)
Happy trading!
Tom