
EB Daily Market Report - Tuesday, February 9, 2021
ChartList Update
I've updated the Strong AD ChartList (SADCL) and this list will be used in selecting our Strong AD Portfolio in less than two weeks. It should be available for viewing/download later today on our website.
Executive Market Summary
- Futures were slightly lower at the open, but we're now close to our highs of the session
- The 10-year treasury yield ($TNX) also began the day lower, but has recovered close to breakeven
- The NASDAQ has cleared 14000 for the first time in its history and the S&P 500 is just 2% away from reaching 4000 for the first time
- Communication services (XLC, +0.59%) and industrials (XLI, +0.48%) are leading today's action
- Energy (XLE, -0.59%) is taking a breather after Monday's big jump
- Renewable energy ($DWCREE, +5.76%) is strong for a second consecutive session
- CarParts, Inc. (PRTS, +6.11%) is a potential short squeeze stock on our Short Squeeze ChartList; you can read an article that I wrote about PRTS in my StockCharts.com Trading Places blog HERE
Market Outlook
One theme that continues to take shape in the U.S. stock market is the excellent relative performance of small cap stocks. They are outperforming again today and it certainly doesn't appear to be any kind of short-term phenomenon. Below are 5 relative ratios comparing small caps to large caps in 5 specific industry groups as follows:
- Health care - PSCH vs. XLV
- Industrials - PSCI vs. XLI
- Technology - PSCT vs. XLK
- Financial services - PSCF vs. XLF
- Consumer discretionary - PSCD vs. XLY
These five industry groups are the top holdings in the IWM, the ETF that tracks the small cap Russell 2000 Index. As you can see from the chart below, all five groups show leadership from small caps (vs. their large cap counterparts):
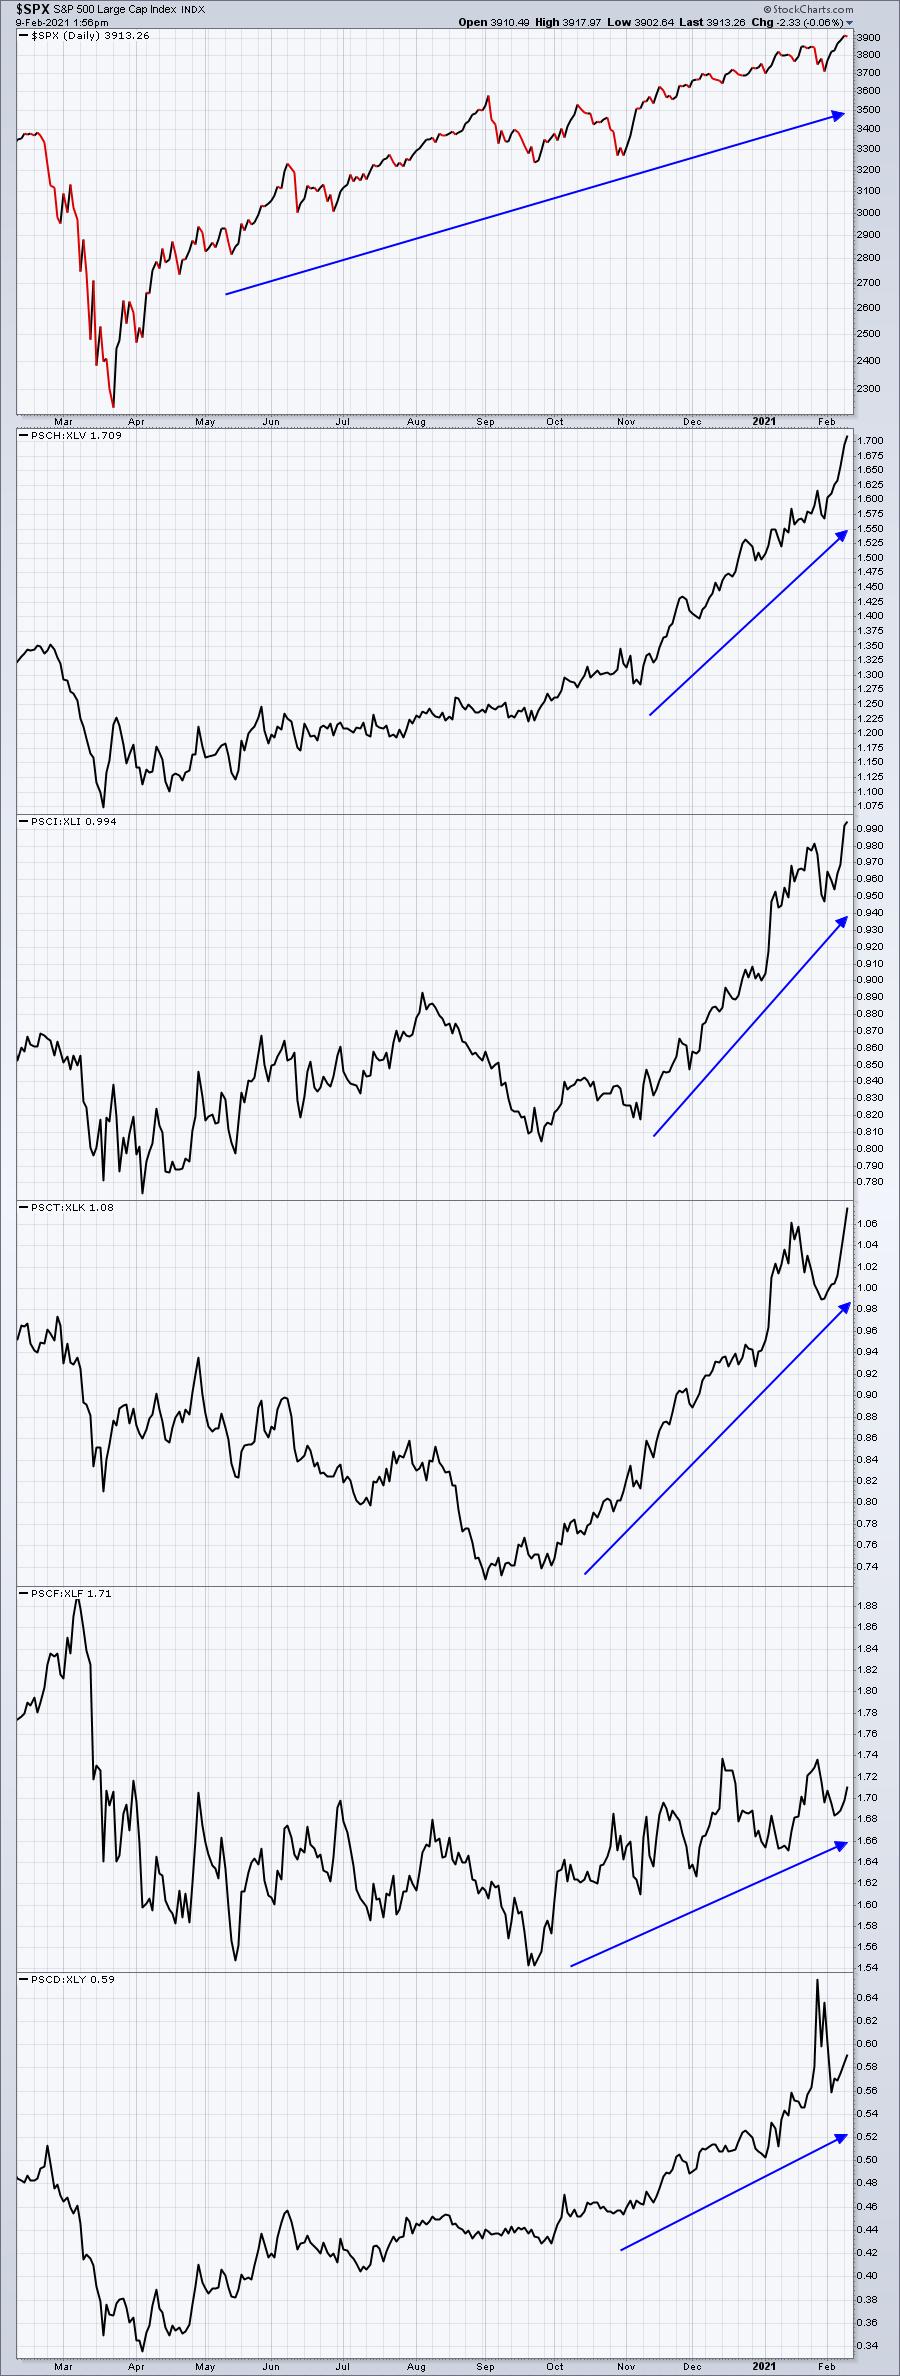
While the S&P 500 has been moving higher, you can see that in the biggest areas of the market, small caps are trouncing large caps. It's a theme that we mentioned when we selected our last portfolio stocks in November and it's continued to be a theme worth following. It also was discussed during the last Model ETF Portfolio announcement in January. If you recall, 2 of our 7 ETFs specifically invested in small cap stocks. It's important to follow the signals of the market in order to outperform.
Sector/Industry Focus
I've discussed recently that industrials (XLI) have been disappointing and that I expect them to perform better on both an absolute and relative basis. We might be seeing the start of that, but we need to get this confirmed breakout:
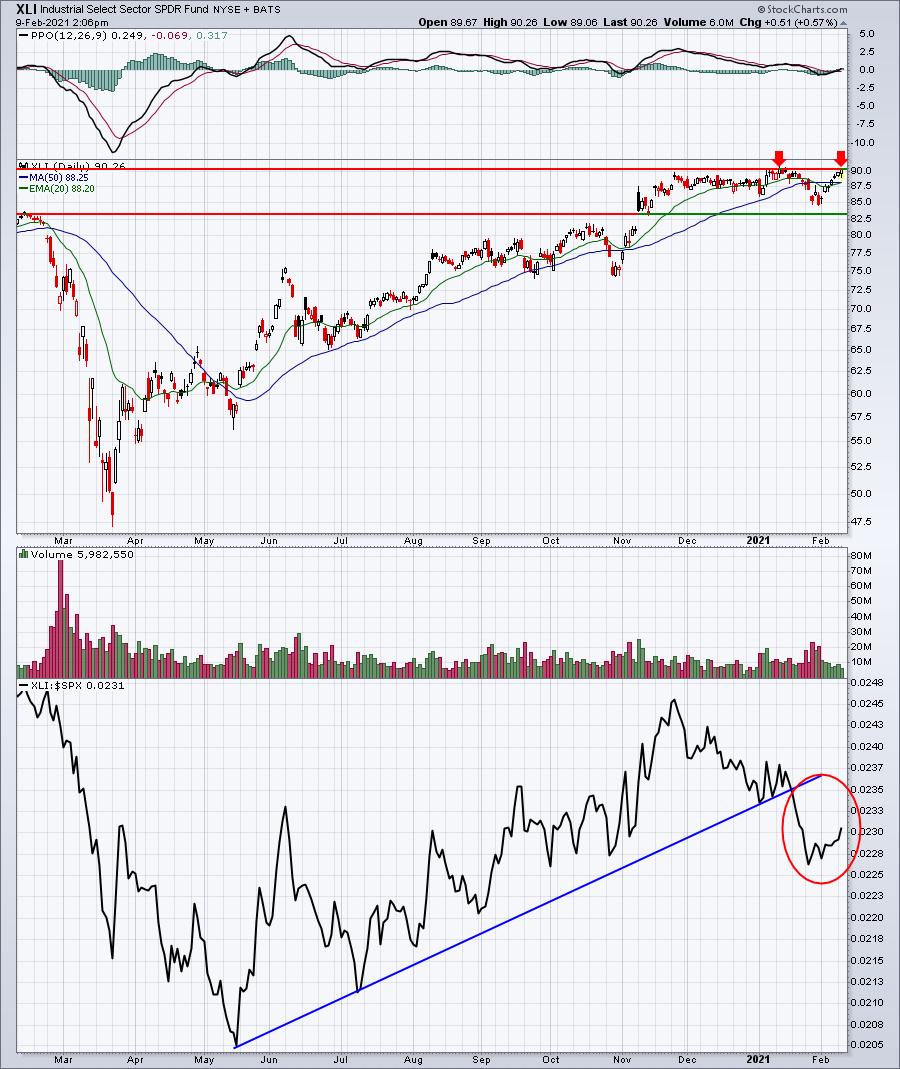
The relative breakdown the past few weeks can at least partly be explained by the consolidation that's taken place since the January absolute price top. But if we make this breakout, we should begin to see the relative strength line move higher. If it can't move higher after a price breakout, that would suggest to me that the XLI will continue to lag.
ChartLists/Strategies
Great news! I finally updated the Strong AD ChartList (SADCL). The newer version should be on our website later today and available for download. I will use this updated ChartList to help with our Strong AD Portfolio selections on Sunday, February 21st. I ran a scan looking for stocks that:
- were on the November SADCL
- are on the new February SADCL
- have a SCTR > 98
Here they are:
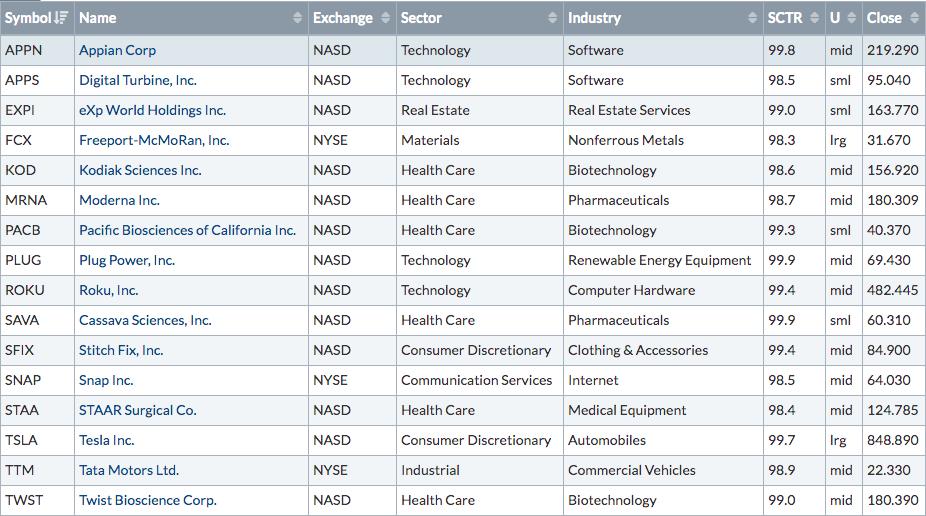
This is kind of a big deal. These stocks all showed strong AD lines in November and still show those same signs of potential accumulation. The SCTR of 98 or higher indicate tremendous relative strength. These are all stocks that should remain high on our list for potential trades and also potential inclusion in our upcoming portfolios. Of these 16, TSLA, SNAP, and ROKU are all on our current Model Portfolio.
Of this list, I'd watch these two quite closely:
KOD:
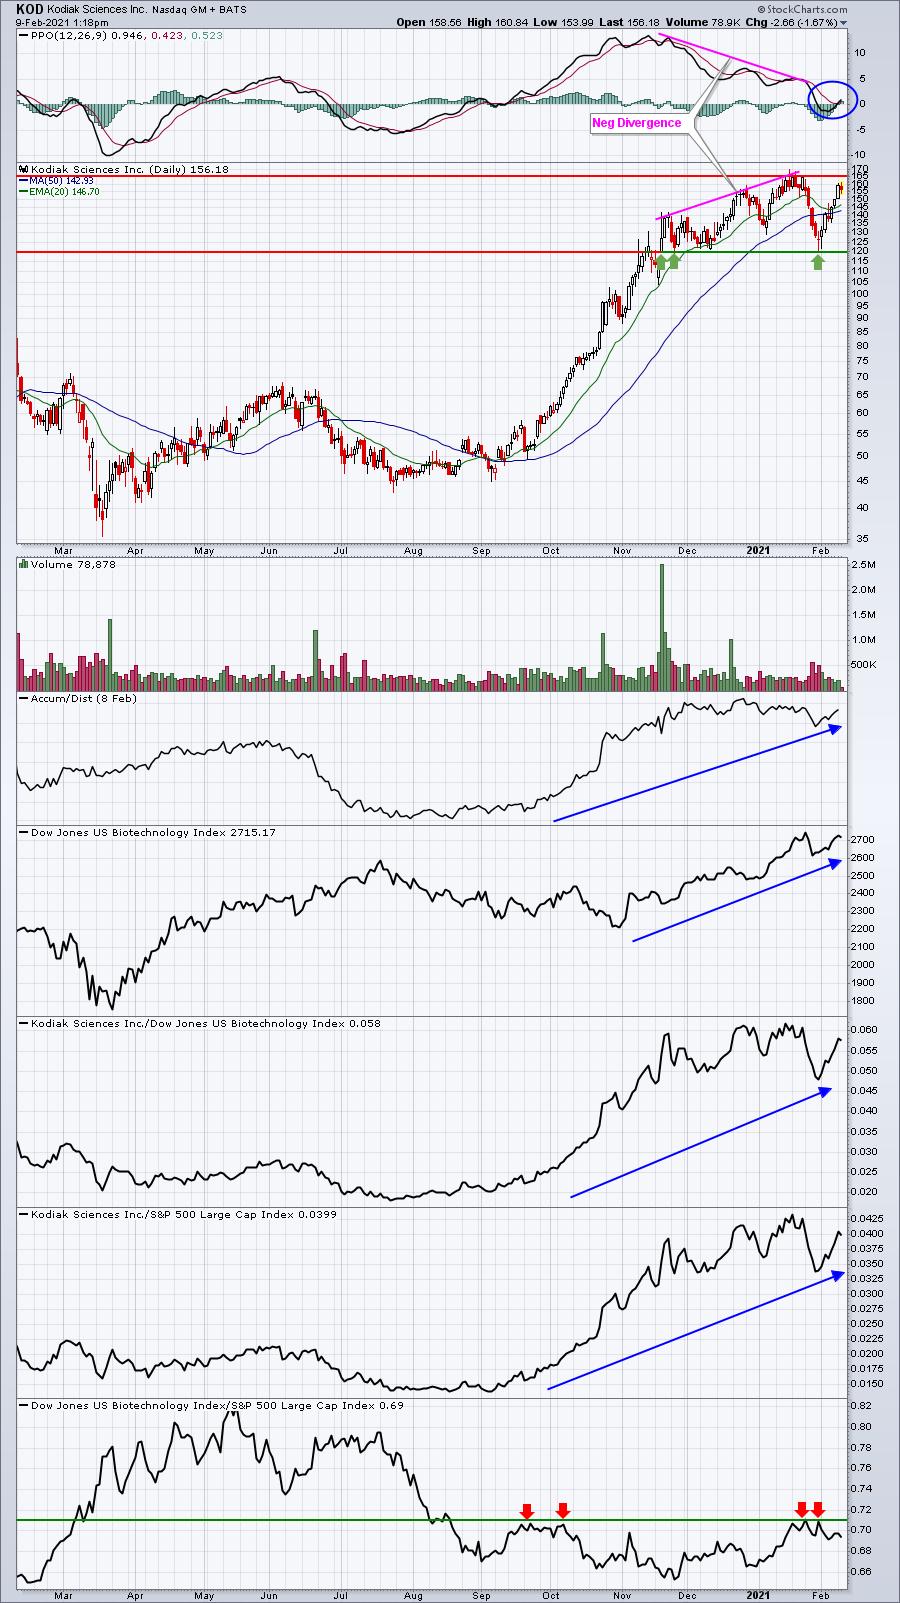
The negative divergence was a clue that KOD could use a period of consolidation. After all, the company had soared, nearly quadrupling in 4-5 months. But now KOD has seen its PPO reset near centerline support. A breakout absolutely should be respected as this stock has shown tremendous leadership. It also would help if the biotechs ($DJUSBT) break out on a relative basis vs. the S&P 500 (red arrows in lower panel).
SFIX:
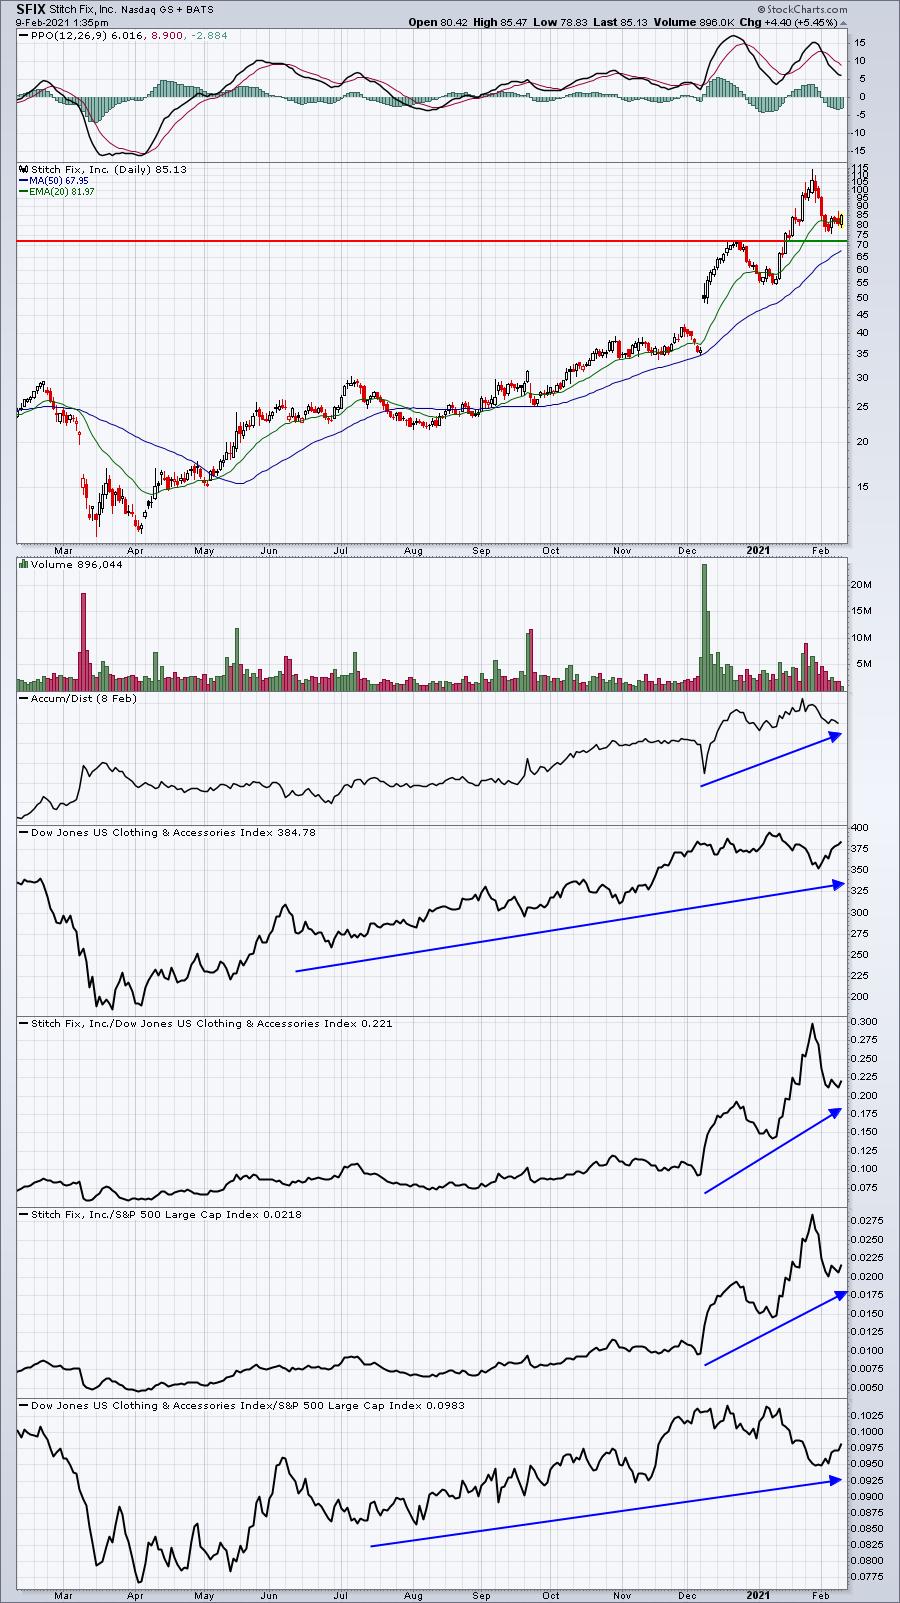
SFIX is now more than 25% off its recent high. It's extremely volatile and has benefited by a high short % of float (33.57%). In addition to being one of the best performers with a very strong AD line, it's also a resident on our Short Squeeze ChartList.
I'm a fan of most of the stocks here, but these two - one because of consolidation and one because of the recent pullback - definitely pique my interest.
Earnings Reports
Here are the key earnings reports for the next two days, featuring stocks with market caps of more than $10 billion. I also include a few select companies with market caps below $10 billion. Finally, any portfolio stocks that will be reporting results are highlighted in BOLD. If you decide to hold a stock into earnings, please understand the significant short-term risk that you are taking. Please be sure to check for earnings dates for any companies you own or are considering owning.
Tuesday, February 9:
CSCO, TOT, FIS, SPGI, FISV, DD, HMC, TWTR, CNC, CARR, TDG, WLTW, WELL, ENPH, INCY, MLM, AKAM, FOXA, CGC, PEAK, LYFT, CDAY, FMC, MAS, IT, J, ACGL, QGEN, CCK, UDR, AYX, AIZ, SEE, MAT, HBI, COTY, THC, RPD, HAIN, VSH, HP, GT, YELP, GLUU, MODN
Wednesday, February 10:
KO, UBER, GM, CME, EQIX, ZG, MFC, IQV, ORLY, SLF, PAYC, CERN, EQR, EFX, CDW, ATUS, TRMB, SSNC, TYL, MGM, AVLR, CINF, IFF, LUMN, TEVA, AIRC, MOH, NLY, ZNGA, XPO, BG, IPG, UAA, BE, EEFT, PACB, CCJ, QLYS, ASGN, TMHC, SONO, IRBT, NGVT, SAVE, ELY, TTGT, INMD, CRTO, PI
Economic Reports
None
Happy trading!
Tom