
EB Daily Market Report - Wednesday, February 10, 2021
ChartList Update
I've updated the Short Squeeze ChartList (SSCL) and it will be available for viewing/downloading later today on our website.
Executive Market Summary
- Futures were higher this morning across the board, but early selling kicked in
- We currently have bifurcated action with the Dow Jones in positive territory, but the other key indices weak
- Crude oil ($WTIC) is up more than 0.50%, as energy (XLE, +1.47%) leads today's action
- The 10-year treasury yield ($TNX) is down 2 basis points to 1.14% as consolidation kicks in from 1.00%-1.19%
- Cisco Systems (CSCO, -4.28%) beat Wall Street EPS estimates, but the stock has dipped back to its 20 day EMA just a few days after a breakout
- Under Armour (UAA) and Twitter (TWTR) lead the S&P 500 today after reporting strong quarterly results
- Meanwhile, Akamai (AKAM) is tumbling 11.49%, despite beating top and bottom line estimates; AKAM did issue weaker-than-expected guidance, however
- Consumer discretionary (XLY, -1.01%) is today's sector laggard, followed by technology (XLK, -0.35%)
Market Outlook
Part of today's struggle is likely connected to slowing momentum on the hourly chart. The following is a current look at the NASDAQ 100's ($NDX) 60-minute chart:
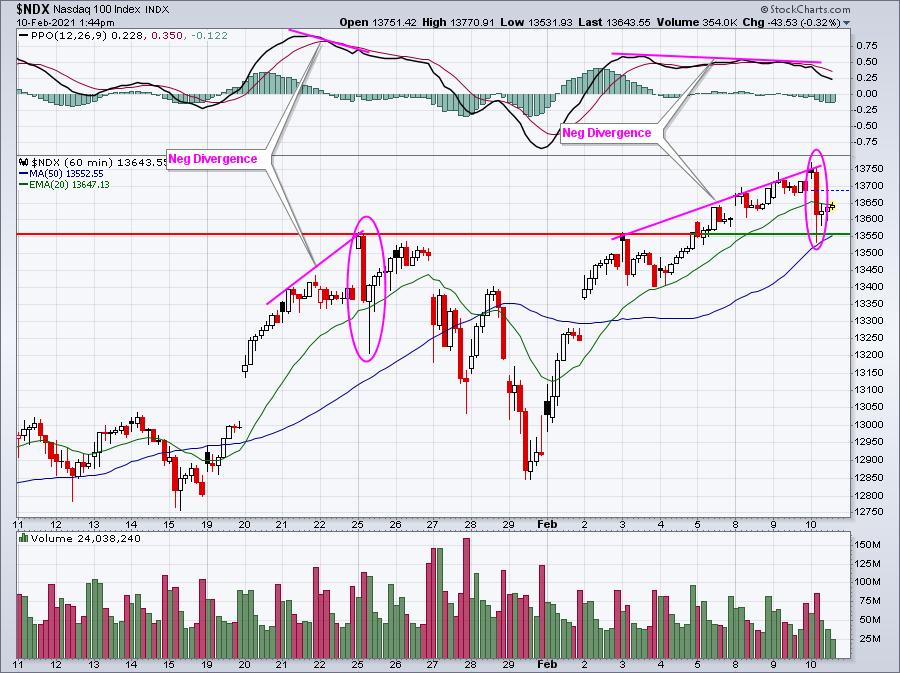
When negative divergences form, it doesn't guarantee us lower prices, but in my opinion, tells us that the risk of a selloff is increasing. At that point, it just depends on how much risk you want to take. The negative divergence in late January led to significant selling. That's not always the case. In fact, the current negative divergence could have already played out with the quick selling this morning. I can say that if we do see another rally later this week and into next week, we'll need to be prudent about taking short-term profits (if you're a trader). Longer-term, I'm not worried at all. But any time we approach options expiration, especially on the heels of a rally, I tend to grow more cautious. Keep more cash in my account and trade fewer shares where compelled to do so.
Sector/Industry Focus
Let's talk health care (XLV) today. Specifically, I'm looking for a short-term run higher in the health care providers ($DJUSHP) area. Over the last one week and one month periods, the XLV has underperformed most other sectors. But a secular bull market leaves no groups behind (or very few). The DJUSHP has been the worst performing area within health care. This leads me to believe that we're overdue for strength in this group. This morning prior to the opening bell, IQVIA (IQV) reported excellent quarterly results, easily surpassing Wall Street's estimates as to both revenues and EPS. In addition, IQV raised guidance for the next quarter and for FY21. After a huge gap higher (with market makers shorting of course), IQV has pulled back significantly. Personally, I've begun accumulating IQV on this weakness. Here's the chart of both the DJUSHP and IQV:
DJUSHP:
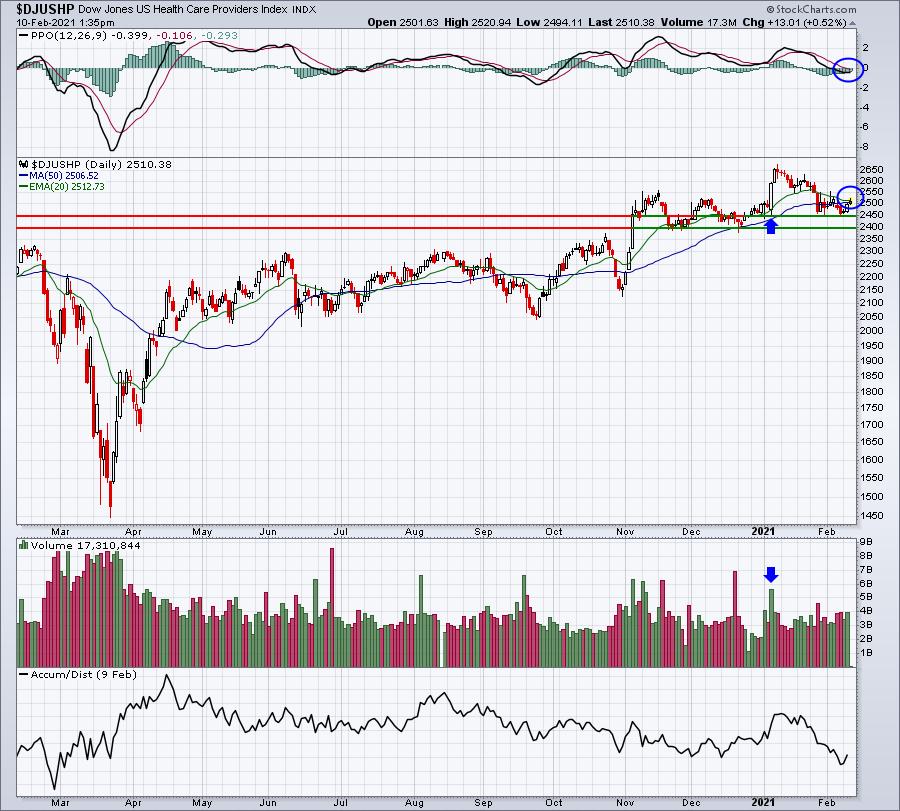
The last breakout occurred on increasing volume in early January. We've just recently pulled back to where that rally began (blue arrows) and are beginning to turn higher again. I'm looking for leadership short-term in this space, especially if we can see a breakout above the moving averages and the PPO centerline (blue circles). If so, I think that would set up really well for leaders in the space that have reported stellar earnings. Enter IQV.
IQV:
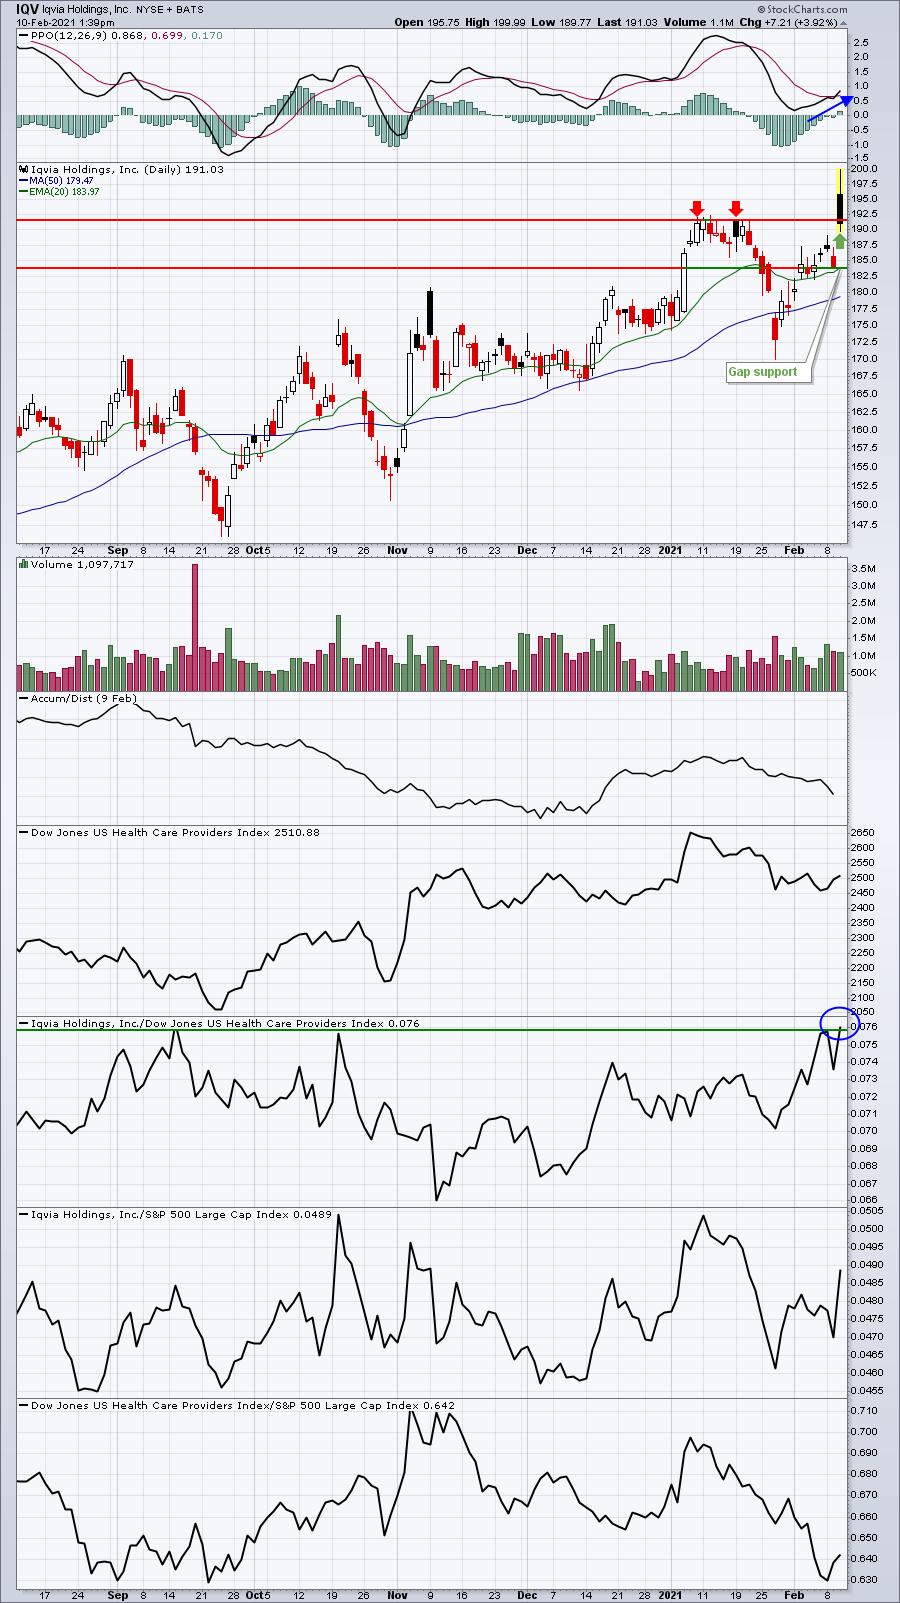
Market makers have cost IQV since the opening bell as most companies revert back toward their opens after earnings gaps. It's just how the market works. Second, IQV's strong results could be overlooked by Wall Street as health care stocks haven't been leaders. Despite this, check out IQV's relative position vs. its health care provider peers. It's breaking out to a new high. In my opinion, this is a stock that should do quite well on the next rally in health care stocks.
ChartLists/Strategies
There have been significant changes in the short % of float of our Short Squeeze ChartList stocks, so I've updated them today. The updated ChartList should be available for viewing/downloading from our website later today. In the meantime, I want to have a discussion about the list and what's transpired recently on the charts and in the news.
Of course, everyone has become an expert on short squeezes now, right? And as the shine fades on many of these stocks including GME, AMC, etc, most are writing off short squeezes as a dying strategy. I have news for all of the current naysayers: Short squeezes are alive and kicking. You're just not going to find them in GME any longer.
Part of the strategy in trading a short squeeze on the long side is you're banking on the fact that many, if not all, short sellers are underwater and the "buying tide" is sweeping them out to sea. A short squeeze relies on panicked and emotionally-charged buying. Without that, there is no short squeeze. GME's latest short % of float is now 41.95%, WAY below the recent 140%. It's still a very high number and one that could be troublesome for shorts, but here's the difference:
Many of the current shorts in GME sold at much higher levels. The prior short sellers that were squeezed out are GONE. Those hedge funds have lost or nearly lost everything and are not the current short sellers. You have a new group, likely institutions, that shorted from MUCH higher levels. If GME goes up 10%, 20%, or even 100% from here, they're not going to panic. They are likely already deep in the money on their short positions. They know GME is not worth $50 per share right now and they'll hold their short positions until the stock retreats to a more normal valuation.
My suggestion? Stay away from GME. The ship has sailed for awhile and it's not worth the risk. It will be volatile and there'll be big moves in both directions, but you'll need to be extremely nimble and anticipate moves. If you're constantly reacting to spikes or selloffs, you'll likely find yourself losing money at the hands of market makers. If I were forced to pick a side at 55 bucks on GME and I had to hold the position for 30 days, I'd short it. But I'm not forced to do anything with GME, so I'm staying away.
There remain a long list of Short Squeeze ChartList stocks, however, that still can put tremendous pressure on short sellers. And while our new SSCL doesn't show any massive short %'s of float like we've seen recently, ANY stock with a short % of float above 10% is still massively shorted. We only include stocks with short %'s of float above 20% on our SSCL. But just remember that even 10-15% is a big number historically. I want to focus on 4 potential short squeezes that I believe could be triggered at any moment, or might even be underway:
WKHS:
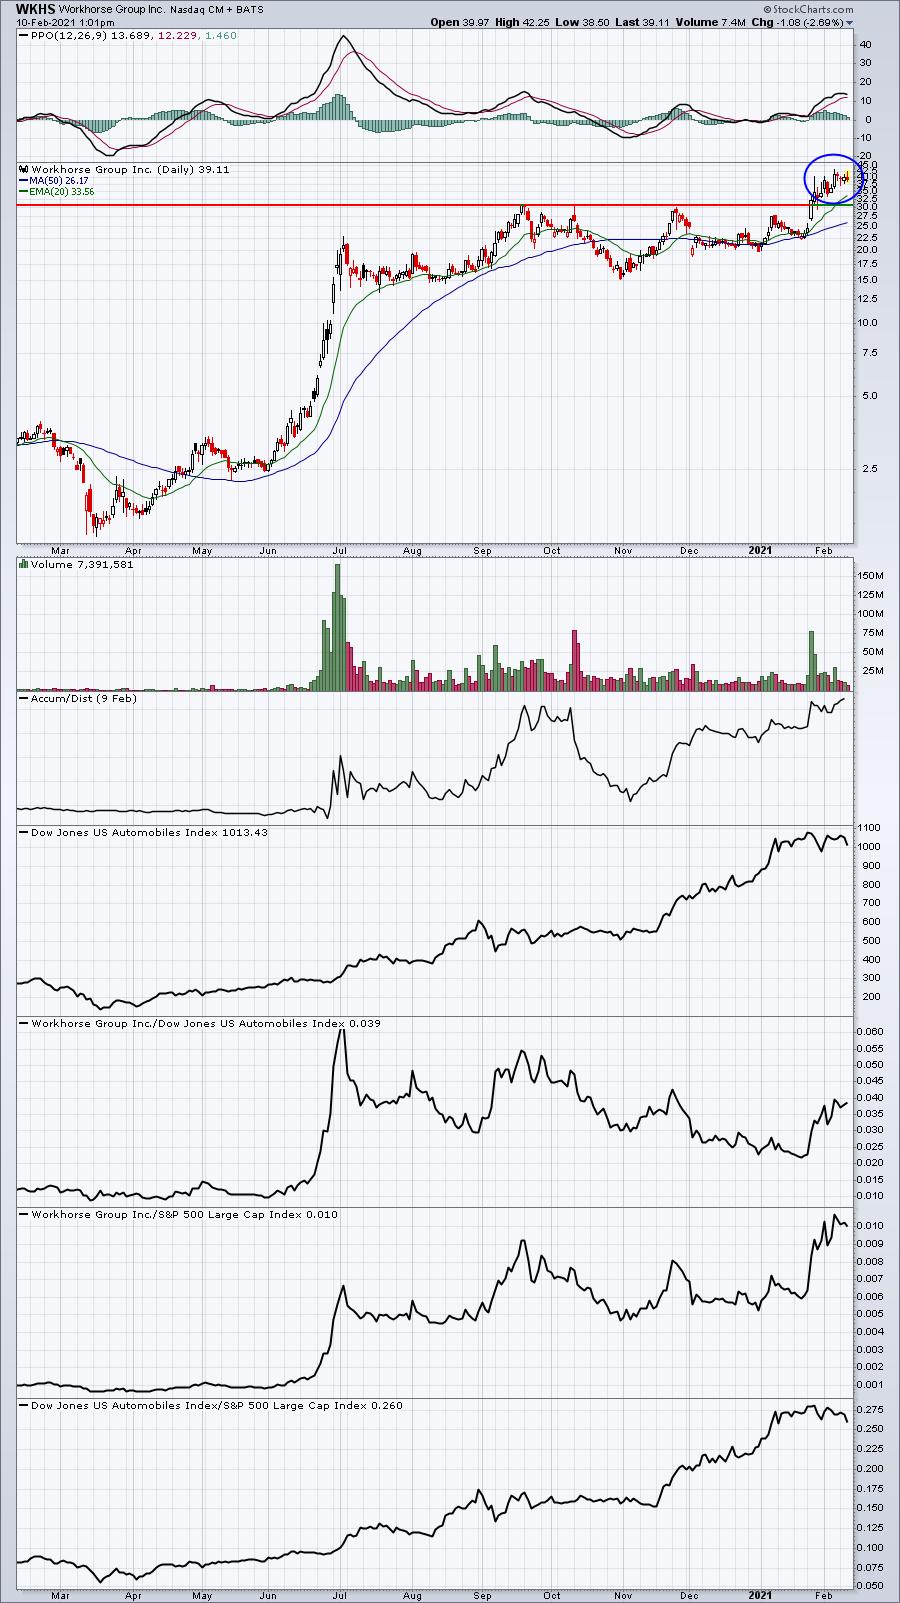
There are still a large number of shorts wondering what to do with WKHS in breakout territory. I could certainly see buying heat up here.
CLVS:
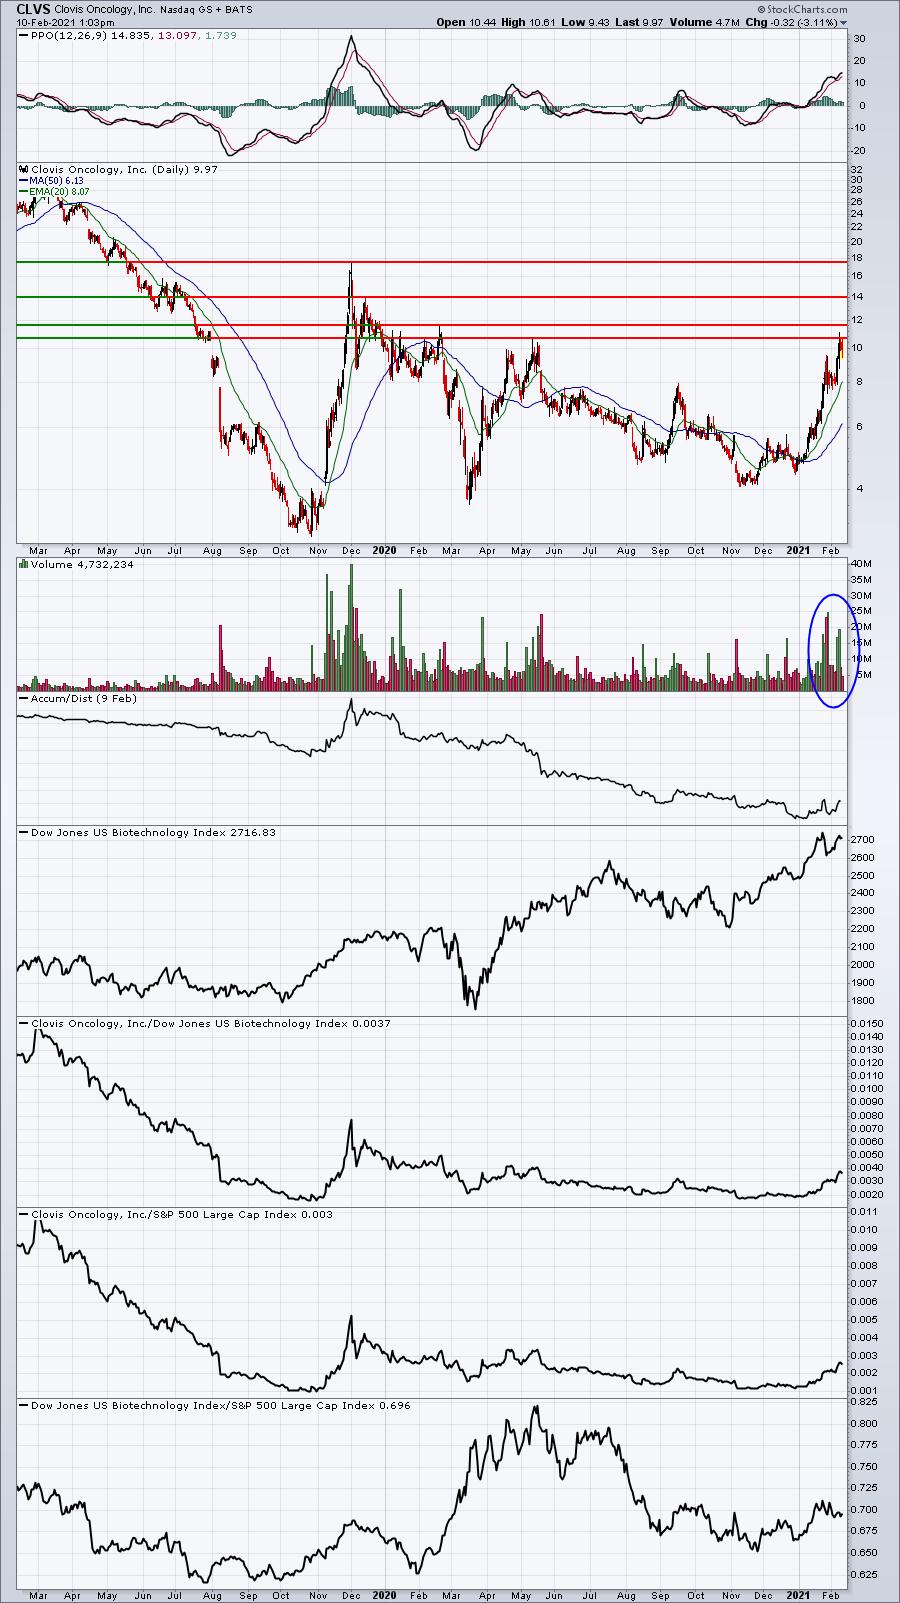
CLVS had been downtrending for a long time, so I can only assume that many short sellers borrowed their shares and sold when CLVS was much lower in price. Volume has been pouring in lately, but 10-12 presents considerable price resistance. If that fails to hold, I could see many more shorts beginning to cover.
OPK:
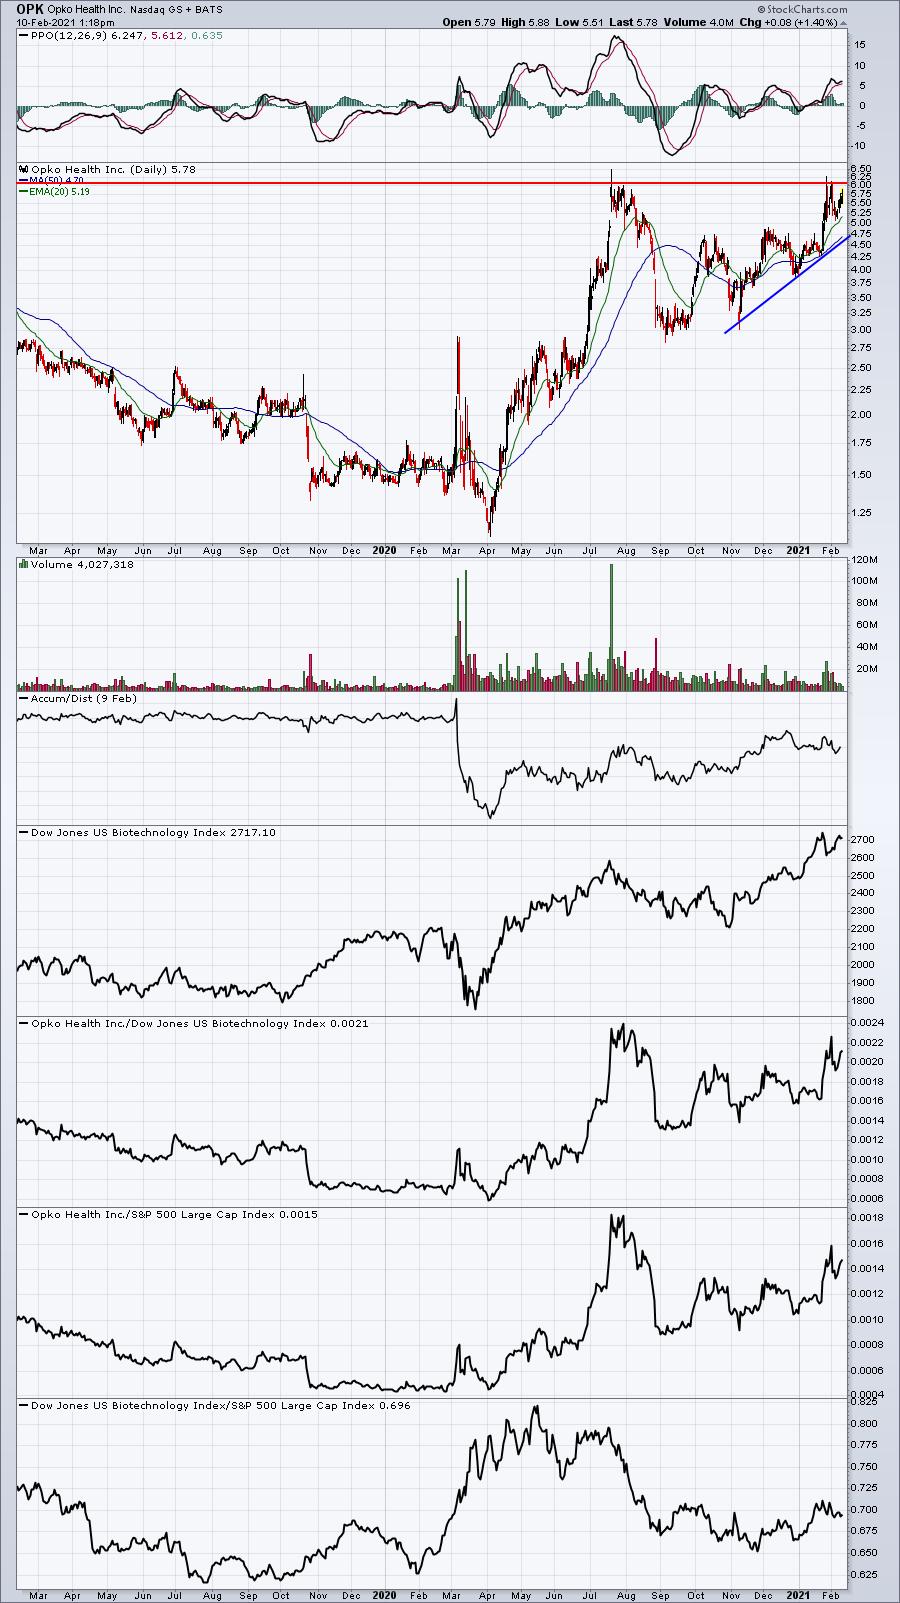
OPK was featured in this morning's EB Digest. We haven't seen an open or a close above 6.02 yet, so that's certainly a key level to watch. I suspect a close above that level will begin to send the shorts scrambling and looking for cover. Buyers could begin to trip over themselves at that point.
BLNK:
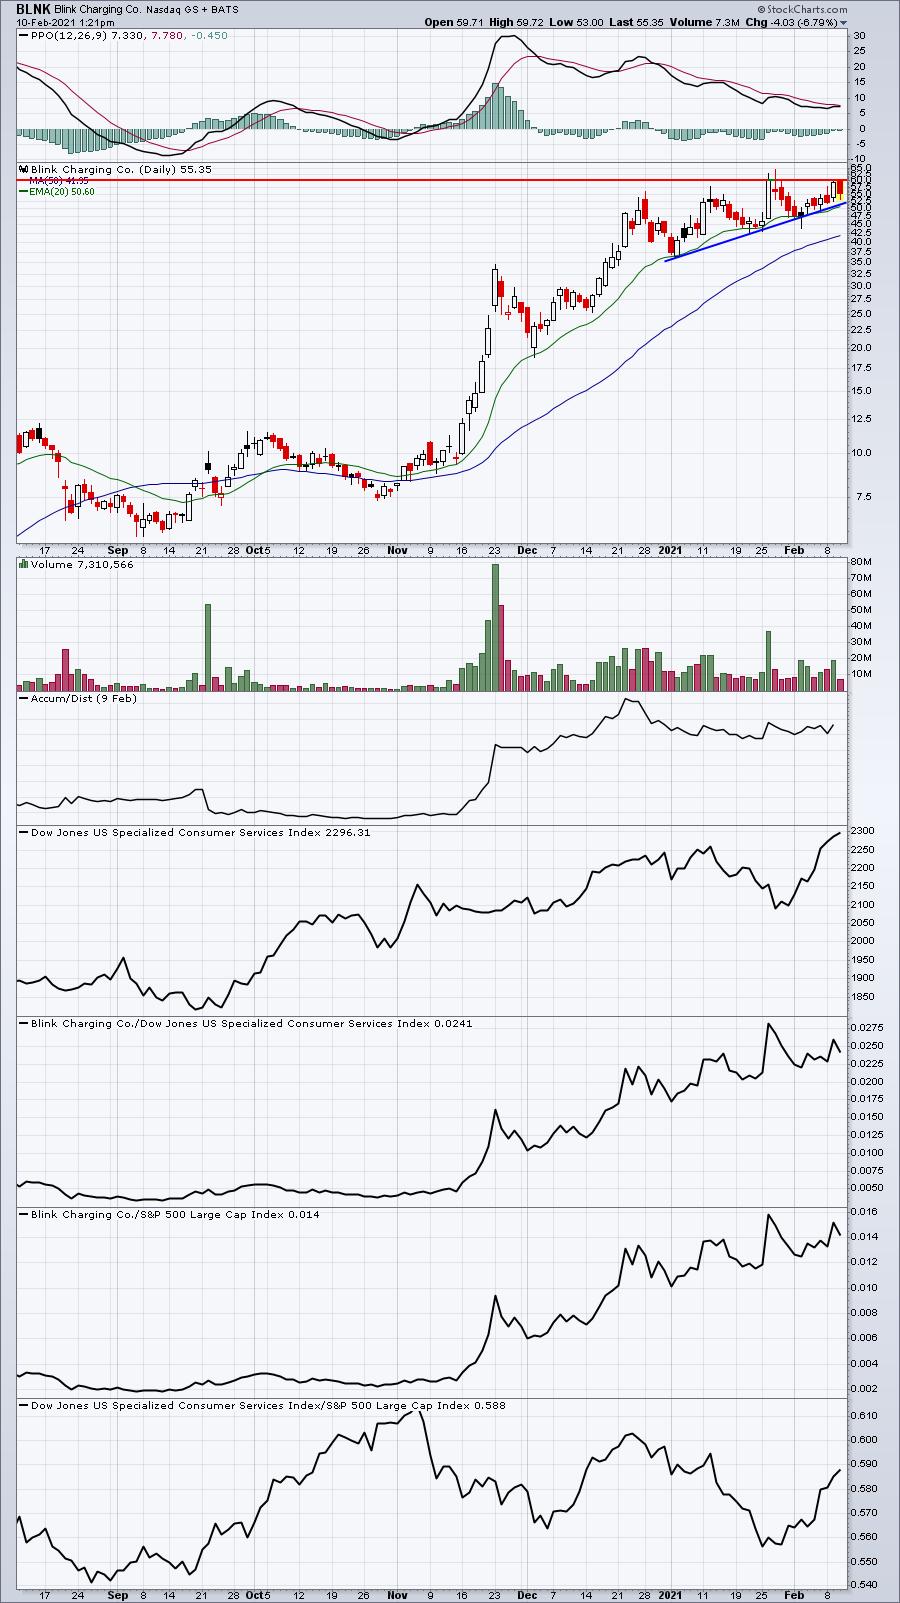
60.72 is the highest close here. Traders continue to bet against BLNK, but I would certainly respect a breakout. In the meantime, I've also annotated a recent trendline to watch to the downside. This one is definitely volatile, but I don't think the top is in just yet. We'll see.
Earnings Reports
Here are the key earnings reports for the next two days, featuring stocks with market caps of more than $10 billion. I also include a few select companies with market caps below $10 billion. Finally, any portfolio stocks that will be reporting results are highlighted in BOLD. If you decide to hold a stock into earnings, please understand the significant short-term risk that you are taking. Please be sure to check for earnings dates for any companies you own or are considering owning.
Wednesday, February 10:
KO, UBER, GM, CME, EQIX, ZG, MFC, IQV, ORLY, SLF, PAYC, CERN, EQR, EFX, CDW, ATUS, TRMB, SSNC, TYL, MGM, AVLR, CINF, IFF, LUMN, TEVA, AIRC, MOH, NLY, ZNGA, XPO, BG, IPG, UAA, BE, EEFT, PACB, CCJ, QLYS, ASGN, TMHC, SONO, IRBT, NGVT, SAVE, ELY, TTGT, INMD, CRTO, PI
Thursday, February 11:
DIS, PEP, AZN, DUK, ILMN, BAM, KHC, DLR, DXCM, DDOG, SGEN, AFRM, NET, TSN, MT, VRSN, ZBRA, LH, EXPE, K, TAP, HUBS, ALNY, BIO, QSR, AEM, GNRC, CGNX, GDDY, POOL, ARES, DVA, MHK, BWA, RARE, WSO, BL, REG, KIM, IRDM, HII, YETI, CYBR, TPX, FROG, AUY, JCOM, CARG, SVMK, TWOU, NSP, NUS, TEX, SSTK, ACB, COHU, VCRA, BJRI, VECO
Economic Reports
January CPI: +0.3% (actual) vs. +0.3% (estimate)
January Core CPI: +0.0% (actual) vs. +0.2% (estimate)
Happy trading!
Tom