
EB Daily Market Report - Friday, February 12, 2021
BIG Event on Monday, February 15th
Please mark your calendar for this Monday at 4:30pm ET. We'll be hosting our "Top 10 Stocks - Sneak Preview" event. During this event, I'll discuss our last quarter's portfolio results, which were stunning, and provide you several "themes" that I'll be looking at as we enter the portfolio "DRAFT" next weekend. The history of these events, along with our philosophy and strategy, will be discussed, which should serve as a refresher for longer-term members and an eye-opener for our newer members. I believe this is one of the biggest events that we have all quarter - other than the actual portfolio draft itself - so I hope you can make it. We do record all of our events, so if you're unable to attend, we'll still make sure you get a copy of the recording.
We will send an email on Monday to provide you room instructions.
Special Note - Yesterday DMR
Yesterday's DMR apparently was not delivered. None of us at EarningsBeats.com received it. It may have been pilot error as there's a final step for me to hit "send" that I may have inadvertantly bypassed. I'm not sure. Two things, however. First, I'm including yesterday's DMR, so below you will find two DMRs, today's followed by one for yesterday. Second, if you EVER fail to receive a DMR in your email, please remember to check our site. Immediately after sending out the DMR (or not - as in yesterday's case), I post it to our website. I'd say a rule of thumb is that if you haven't received the DMR by 3:15pm ET, check the website (certainly by 3:30pm ET).
My apologies for yesterday.
ChartLists Updated
The Strong Earnings ChartList (SECL) and Strong Future Earnings ChartList (SFECL) have been updated and should be available for viewing/downloading later today.
Today's DMR - Friday, February 12, 2021
Executive Market Summary
- Futures were lower overnight, though we did see our major indices move into positive territory earlier
- Consumer sentiment was reported well below expectations for February
- Both the S&P 500 and NASDAQ 100 fell after challenging Thursday's high
- The Volatility Index ($VIX) is down more than 3% today as it approaches that key support near 20
- The 10-year treasury yield ($TNX) has touched 1.20% and is higher by 4 basis points today
- Commodities are mixed, although crude oil ($WTIC) is nearing $60 per barrel
- Sector leadership is mixed with energy (XLE, +0.77%) benefiting from higher crude prices
- Utilities (XLU, -1.20%) remain weak on a relative basis
- Walt Disney (DIS, -1.84%) gapped higher, but is now trading lower, following better-than-expected earnings
Market Outlook
Copper ($COPPER) is in breakout mode and it's got a long-term track record of positive correlation with the S&P 500 (and with most global stock indices). Copper is different from both gold ($GOLD) and silver ($SILVER) in that copper generally only rises for one reason - global economic demand. It's typically a very bullish signal for equities to see copper prices rising:
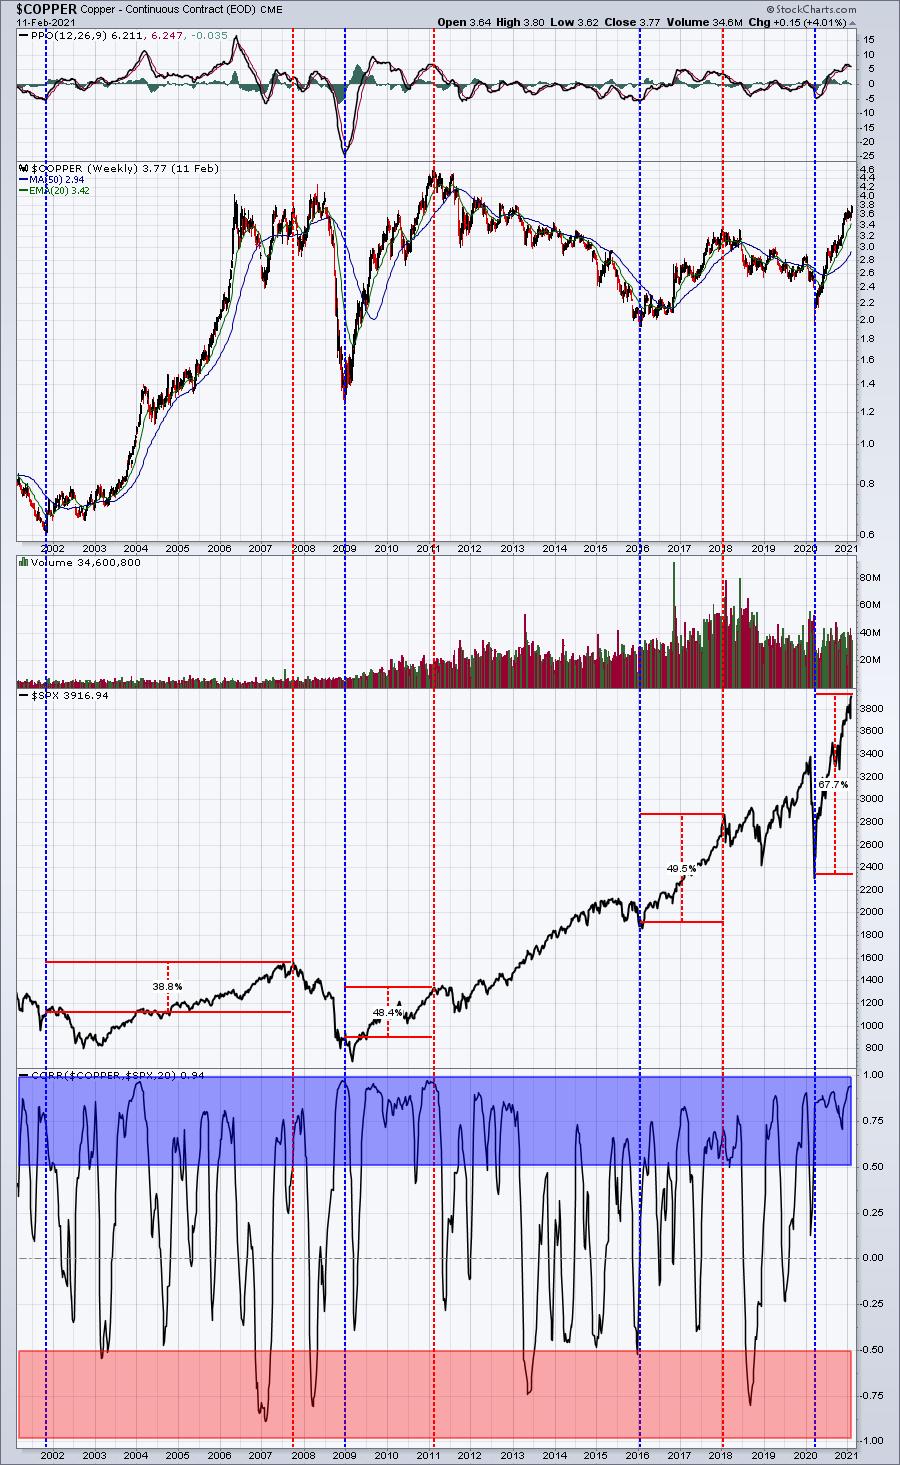
The blue-dotted vertical lines mark COPPER bottoms, while the red-dotted vertical lines mark COPPER tops (or near tops). While there were a couple of strong periods on the S&P 500 that did not correspond to higher COPPER prices, EVERY solid advance in COPPER coincided with a strong S&P 500. The correlation in the bottom panel isn't perfect positive correlation, but the blue-shaded area highlights much more strong positive correlation than the red-shaded area, which marks strong negative, or inverse, correlation.
Rising copper prices are simply one more indication that the S&P 500 is heading higher.
Sector/Industry Focus
Many key sectors and industry groups are already in breakout territory, but there are 3 key sectors that are at important resistance levels. If they breakout, it only adds to the bullishness that we're currently seeing on our major indices:
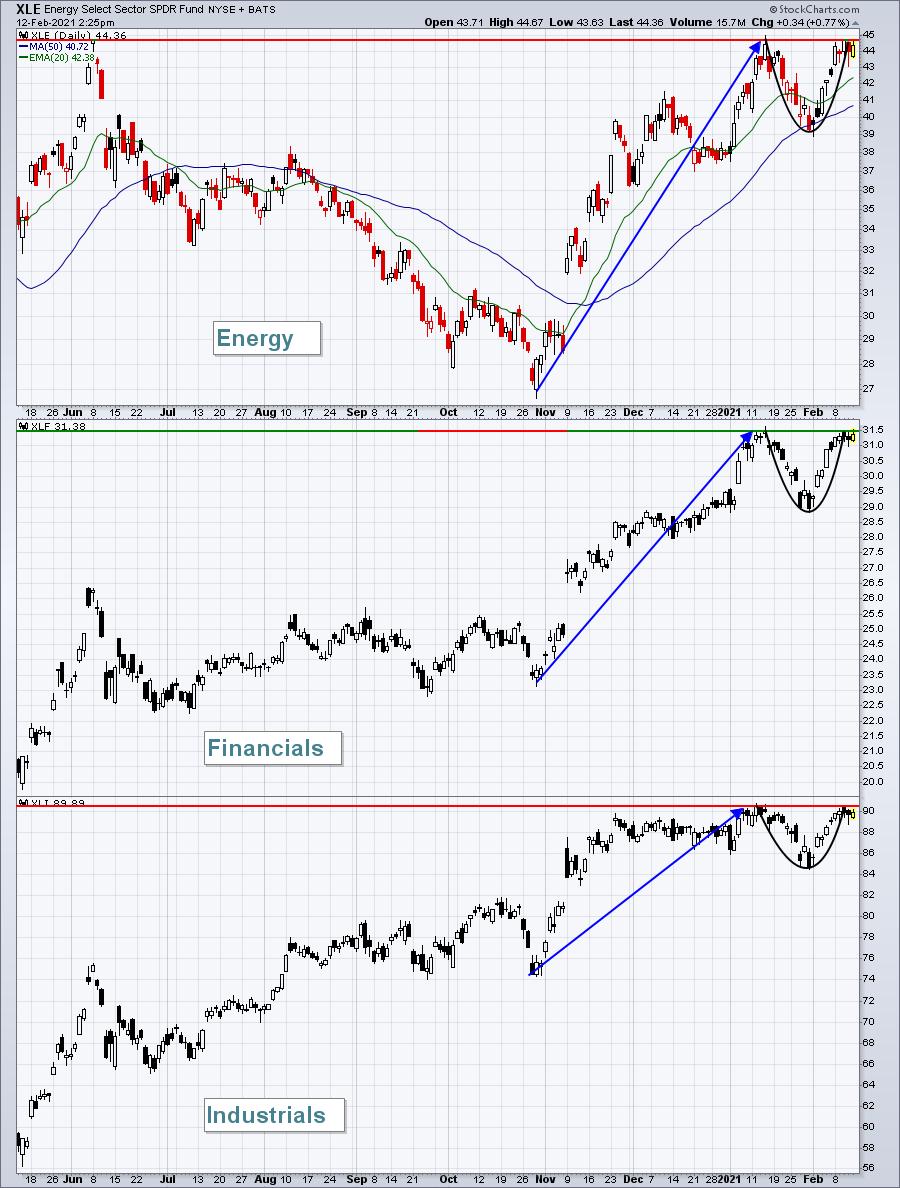
All three sectors are hesitating after forming cups off of uptrends. These are all bullish continuation patterns. While we could see handles extend for a few more days, even possibly a couple weeks, I think the higher odds are that we'll see a breakout very soon. When we do, it adds more fuel to the bullish fire.
ChartLists/Strategies
My favorite scan on our website is the Downtrend Reversal scan. It just really hits home for my personal trading strategy, which is to trade strong stocks on pullbacks. I usually run this scan against the Strong Earnings ChartList (SECL) and Strong Future Earnings ChartList (SFECL). These two ChartLists house many of the strongest fundamental and/or technical stocks in our universe. The Downtrend Reversal scan ensures that a stock has had at least several days of weakness because a stock must print a lower high for 5 consecutive days or more in order to be selected. It must also be printing a higher high today for inclusion, so it's a POSSIBLE reversal. From there, I look to see if it's testing any key technical or price support levels. That combination could make it a very solid reward to risk trading candidate. Today, HOLX was returned from this scan. Here's the chart:
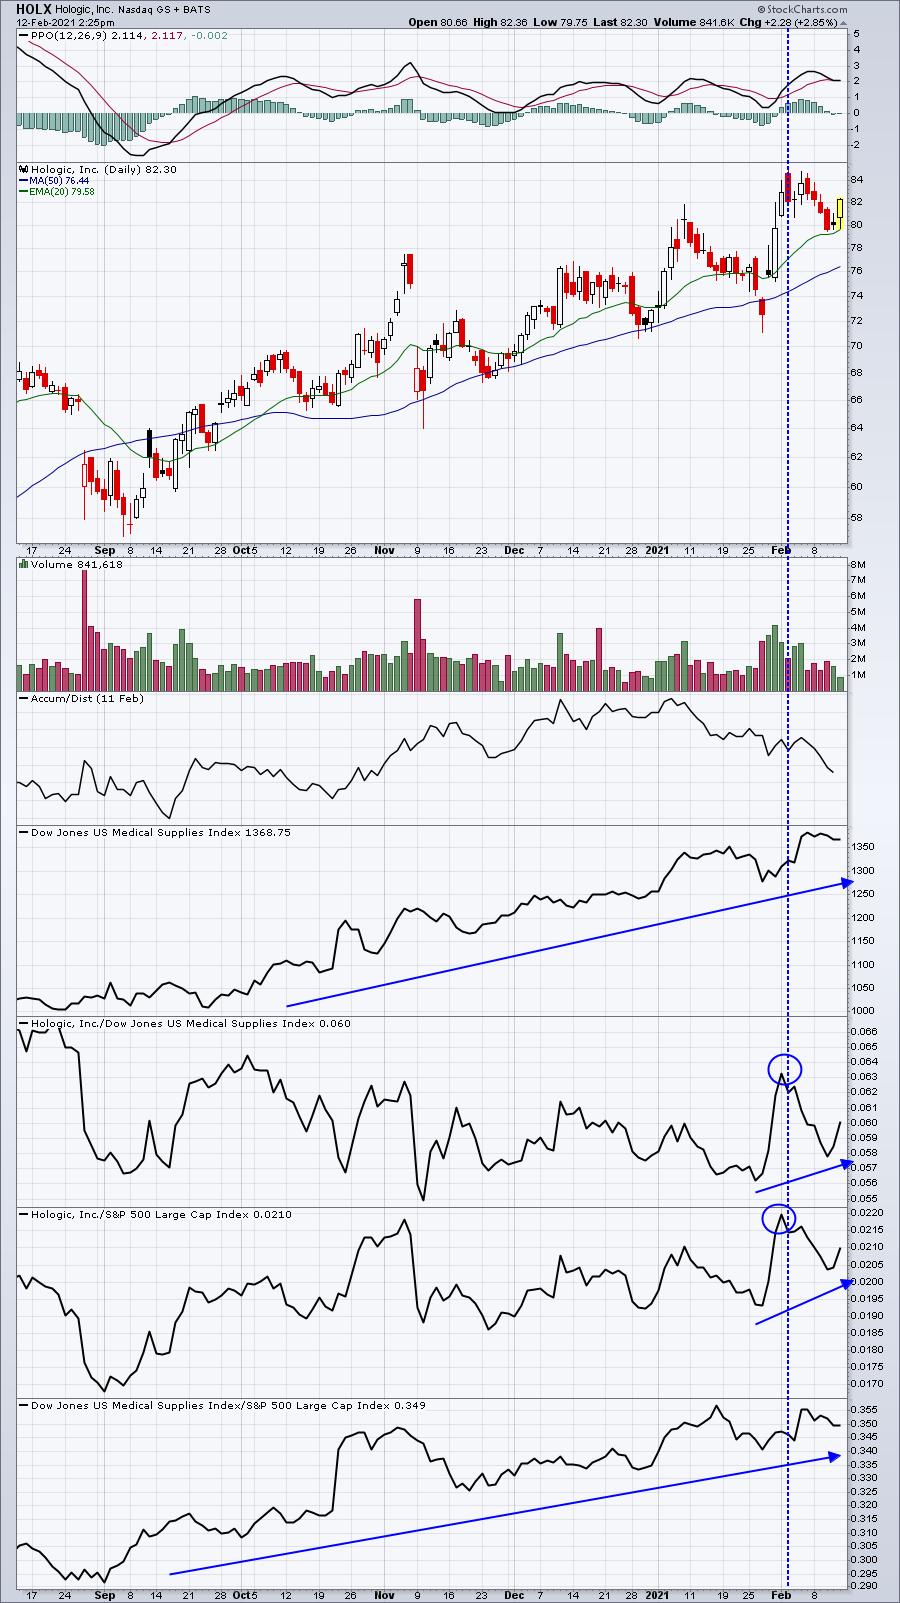
HOLX, at its most recent price high, also established relative price highs vs. its industry peers and the benchmark S&P 500. The selling took the stock down to test its 20 day EMA before turning higher today. Note that the volume on the way up recently was quite strong, while the volume during the selling over the past week was much lighter. This type of setup is awesome, because I can use the 20 day EMA as very tight closing support, while looking at the recent price high as a potential target. Unfortunately, I don't own HOLX because I didn't catch it while it was closer to its 20 day EMA. After its rebound today, the current reward to risk doesn't justify entry. But I wanted to point this out because you can be using our scanning strategies and ChartLists on our website to locate very solid reward to risk trades each and every day.
Earnings Reports
Here are the key earnings reports for the next two days, featuring stocks with market caps of more than $10 billion. I also include a few select companies with market caps below $10 billion. Finally, any portfolio stocks that will be reporting results are highlighted in BOLD. If you decide to hold a stock into earnings, please understand the significant short-term risk that you are taking. Please be sure to check for earnings dates for any companies you own or are considering owning.
Friday, February 12:
ENB, D, MCO, FTS, WPC, NWL, HUN, PRLB, FNMA
Tuesday, February 16:
CVS, ZTS, PLTR, ECL, RNG, A, AIG, OXY, EXAS, VMC, TRU, INVH, SEDG, BKI, DVN, IPGP, AAP, ALLE, BRKR, CLR, VNO, AN, LSCC, BYD, ACC, TNET, LPX, CAR, KAR, LZB, DENN
Economic Reports
February consumer sentiment: 76.2 (actual) vs. 80.9 (estimate)
Happy trading!
Tom
Yesterday's DMR - Thursday, February 11, 2021
Executive Market Summary
- Futures were higher across the board this morning, but only the NASDAQ is holding onto gains with an hour left in trading
- Commodities are mostly lower as the dollar (UUP) attempts to rebound from recent selling
- The 10-year treasury yield ($TNX) climbs slightly to 1.16%, despite weak initial jobless claims
- Technology (XLK, +0.73%) and health care (XLV, +0.11%) are the only two sectors gaining ground today
- Semiconductors ($DJUSSC, +2.69%), one of the most consistent winners over the past couple years, is leading technology higher
- Semiconductor equipment manufacturers like KLAC, LRCX, and AMAT are leading the S&P 500
- Energy (XLE, -2.10%) is on the defensive today as sellers dominate
Market Outlook
Transportation stocks ($TRAN) saw a relative breakdown recently, which is of concern as strong transports can be extremely beneficial to a secular bull market. We remain in an overall uptrend, but I really don't want to see the $TRAN:$SPX ratio break to new lows:
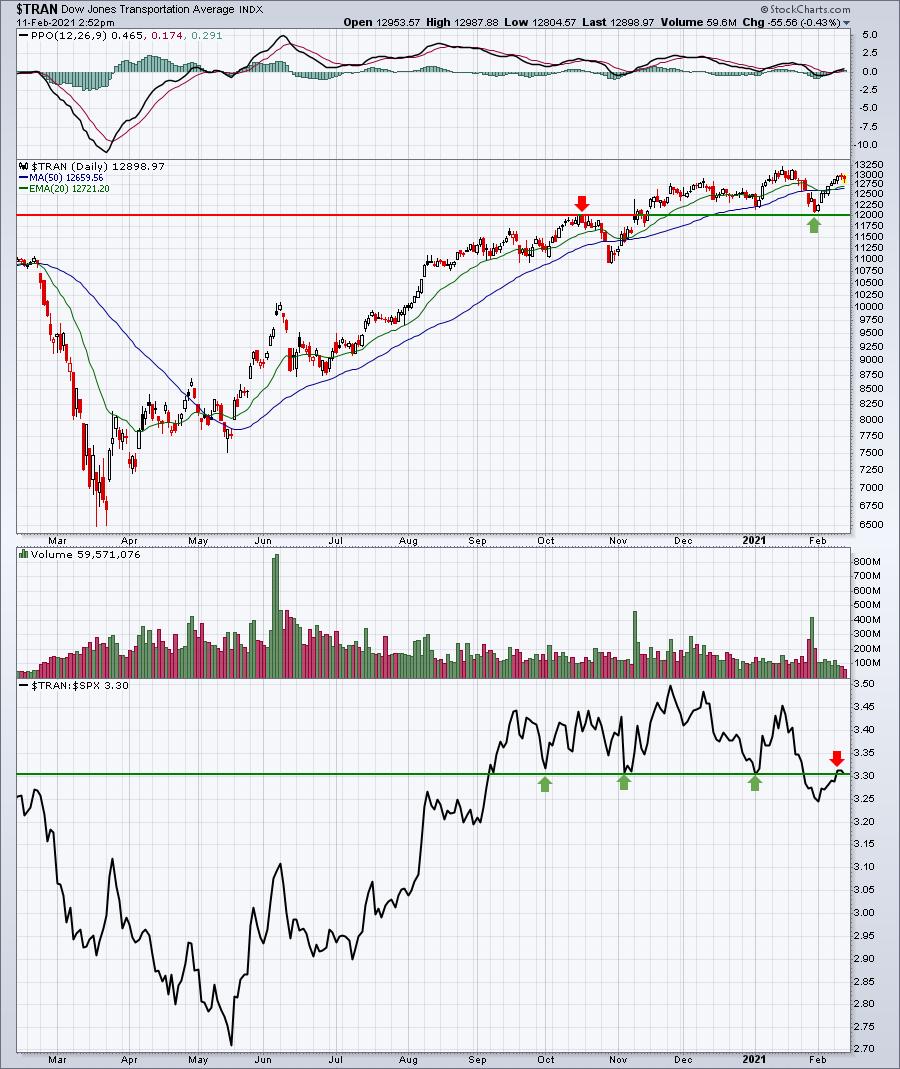
Price hasn't broken down, but we did lose relative price support in late January. I'll be watching transports closely to see if they can regain a bit of relative strength. Breaking out above the January high at 13250 would be a great start.
Sector/Industry Focus
Specialty finance ($DJUSSP) had been very weak on a relative basis as it struggled to break out on an absolute basis. Now that the latter is no longer a problem, I believe there's a reasonable chance that the recent relative strength will continue to strengthen, but there are key levels to watch:
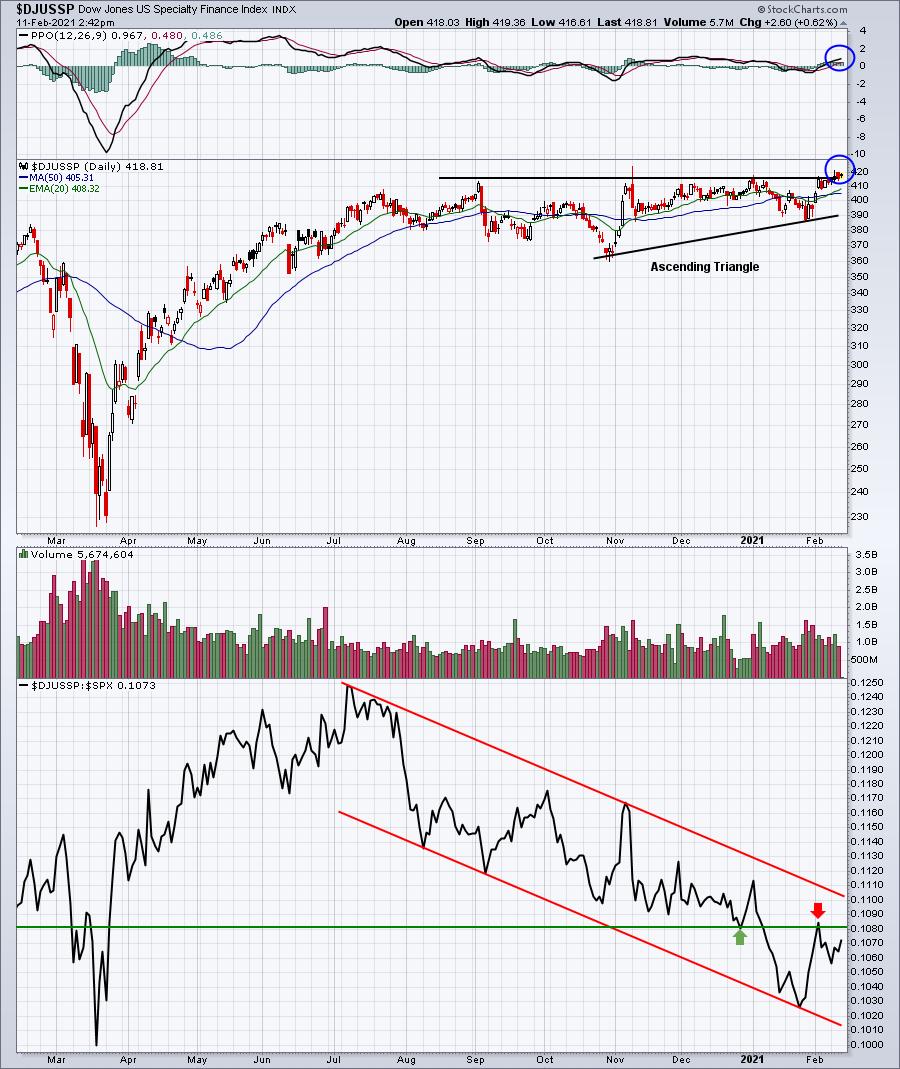
Thus far, the breakout of the ascending triangle is not exactly confirming. There's been quite a bit of hesitation. We want to see a definitive move higher. Also, the relative weakness has been contained in the channel reflected above. The first step is to clear the most recent relative price high (red arrow). After that, a breakout of the current down channel is necessary. When that occurs, we'll want to pay much closer attention to this area of the market. For now, the leaders are interesting, but more rotation into this group is needed.
ChartLists/Strategies
The U.S. stock market has been strong and many stocks are in lengthy uptrends. But there are still plenty of stocks that have endured weeks and weeks of consolidation and are either just breaking back to the upside or approaching a critical breakout. I've discussed Zoom Video Communications (ZM) recently and even highlighted it on last weekend's EB Weekly Portfolio Report. ZM has transformed from a downtrending stock to an uptrending one:
ZM:
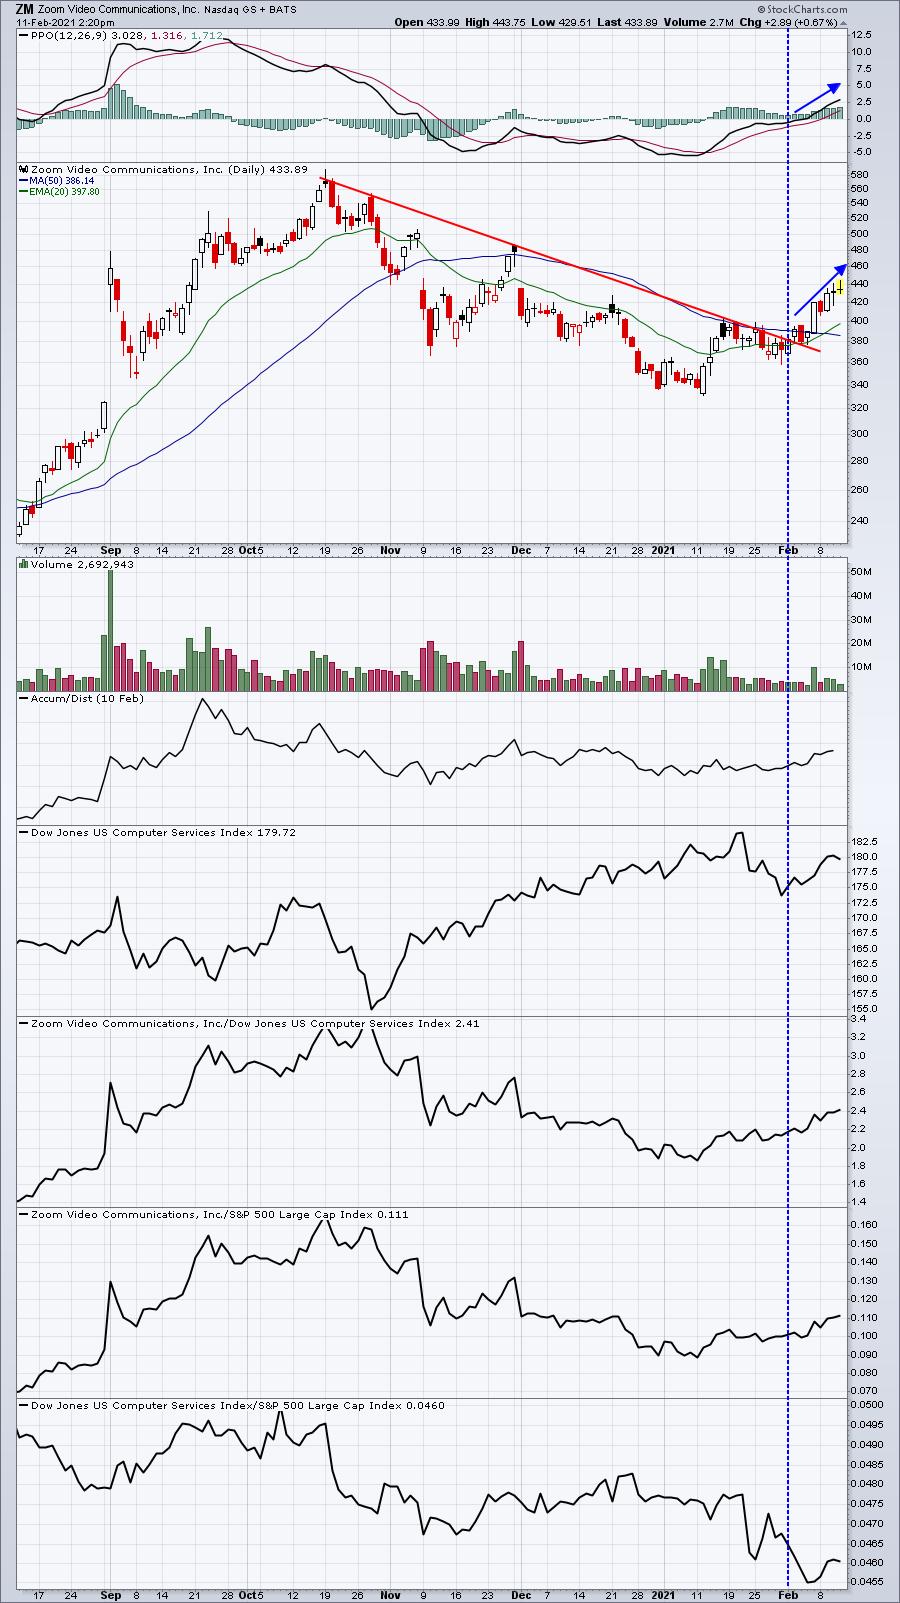
The blue-dotted vertical line is about the time this transition took place. Relative strength was building prior to that point, but we hadn't broken the downtrend. Once that downtrend was broken and ZM began trading above its key moving averages, its PPO went positive as well. I would now consider those moving averages to be excellent support during any short-term selling.
Another stock that's showing similar reversing characteristics is S&P Global Inc. (SPGI). SPGI has been struggling for many weeks, but recent strength broke that downtrend and we just saw a better-than-expected earnings report with raised guidance. That's enabled SPGI to really gain strength in the past couple sessions.
SPGI:
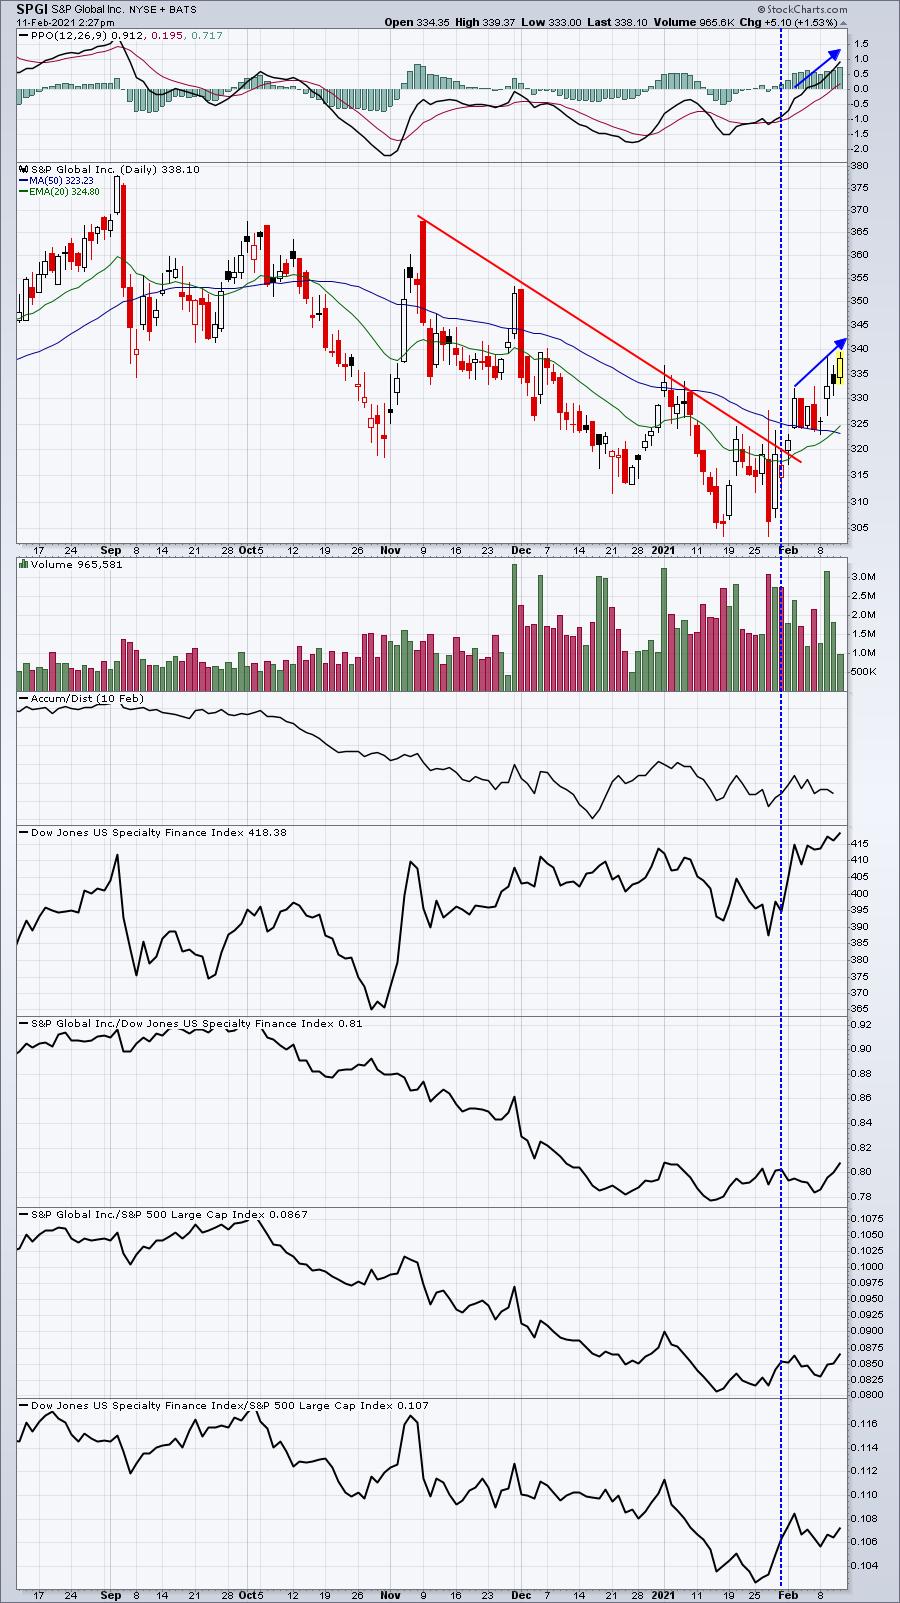
The timing here is good because the specialty finance area ($DJUSSP) just broke out and SPGI is beginning to show leadership again. This combination is likely to send SPGI higher in coming days and weeks.
Earnings Reports
Here are the key earnings reports for the next two days, featuring stocks with market caps of more than $10 billion. I also include a few select companies with market caps below $10 billion. Finally, any portfolio stocks that will be reporting results are highlighted in BOLD. If you decide to hold a stock into earnings, please understand the significant short-term risk that you are taking. Please be sure to check for earnings dates for any companies you own or are considering owning.
Thursday, February 11:
DIS, PEP, AZN, DUK, ILMN, BAM, KHC, DLR, DXCM, DDOG, SGEN, AFRM, NET, TSN, MT, VRSN, ZBRA, LH, EXPE, K, TAP, HUBS, ALNY, BIO, QSR, AEM, GNRC, CGNX, GDDY, POOL, ARES, DVA, MHK, BWA, RARE, WSO, BL, REG, KIM, IRDM, HII, YETI, CYBR, TPX, FROG, AUY, JCOM, CARG, SVMK, TWOU, NSP, NUS, TEX, SSTK, ACB, COHU, VCRA, BJRI, VECO
Friday, February 12:
ENB, D, MCO, FTS, WPC, NWL, HUN, PRLB, FNMA
Economic Reports
Initial jobless claims: 793,000 (actual) vs. 760,000 (estimate)
Happy trading!
Tom