
EB Daily Market Report - Tuesday, February 16, 2021
2 Upcoming Events
At 4:30pm ET today, I'll be hosting our February Max Pain event, where I'll discuss areas of the market that we need to be very careful of as we approach options expiration Friday later this week.
Next, Julius de Kempenaer, creator of the RRG charts, has confirmed that he will join me on Friday, February 19th for "Evaluating Market Rotation", a timely event considering that our Top 10 Stocks will be announced at this quarter's "DRAFT" on Sunday, February 21st. This event will begin at 10:00am ET, so mark your calendar!
Both of these events will be recorded, so if you can't make either or both, we'll have recordings available at your convenience.
Executive Market Summary
- Futures were strong as we opened a new week already in record all-time high territory on the S&P 500
- Selling kicked in after the first hour of trading, however, and our key indices are straddling the flat line
- The Volatility Index ($VIX) closed at a post-pandemic low beneath 20 on Friday, but it is up 9.71% today
- The 10-year treasury yield ($TNX) is up 8 basis points to 1.28%, eclipsing the March reaction high
- Crude oil ($WTIC) is up fractionally and near $60 per barrel; energy (XLE, +2.14%) leads all sectors
- Financials (XLF, +1.81%), given the rise in the TNX, are also performing exceptionally well today
- Defensive groups are at the bottom of the sector leaderboard, including XLRE, XLV, and XLU
- Cruise lines are performing very well as CCL, RCL, and NCLH are all higher by 5-7%
Market Outlook
Remember all the talk about gold ($GOLD)? We're not hearing much about it any more. It was a one-hit wonder back in March as fear spiked amidst the pandemic. Since that time, it has really struggled on both an absolute and relative basis, but especially on a relative basis:
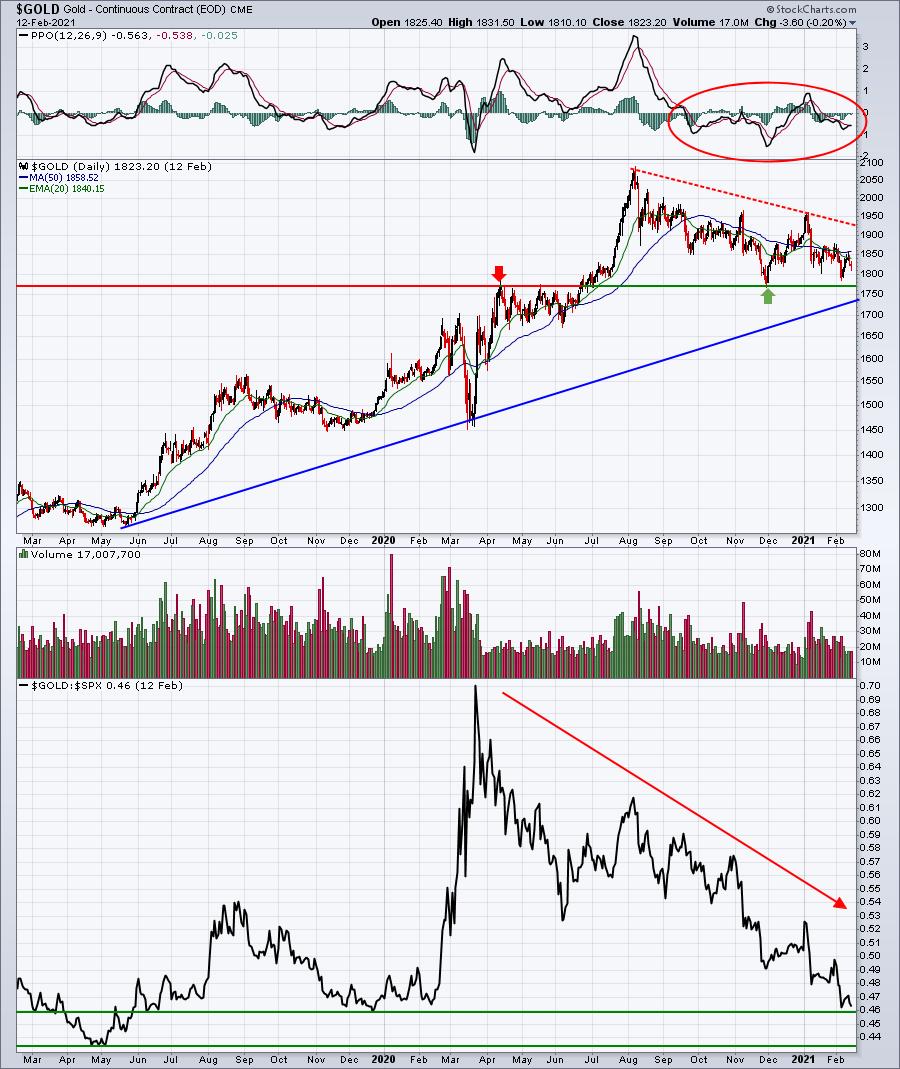
Fear sends investors running into gold. But as fear subsides, the yellow metal has a tendency to struggle. I see gold continuing to struggle, which is why I've been very consistent in my suggestions and messages about avoiding gold. In a secular bull market, gold usually outperforms. There's always the "dollar effect", however. But, for me, that's another problem, because my signals are still telling me to expect a higher dollar later in 2021 and that adds to the weakness in gold, especially relative to the S&P 500.
Looking at the above chart, however, it's very difficult to like much of anything on this chart. Relative weakness vs. the benchmark S&P 500 (lower panel) is quite apparent. Gold has been downtrending on a relative basis for months now.
We have key support levels approaching, but I'd still remain very cautious gold and gold stocks.
Sector/Industry Focus
Let's give a shout out to energy (XLE). I have not been a fan and I believe the XLE still has a lot to prove, but at least on an absolute basis, a key breakout is being achieved currently:
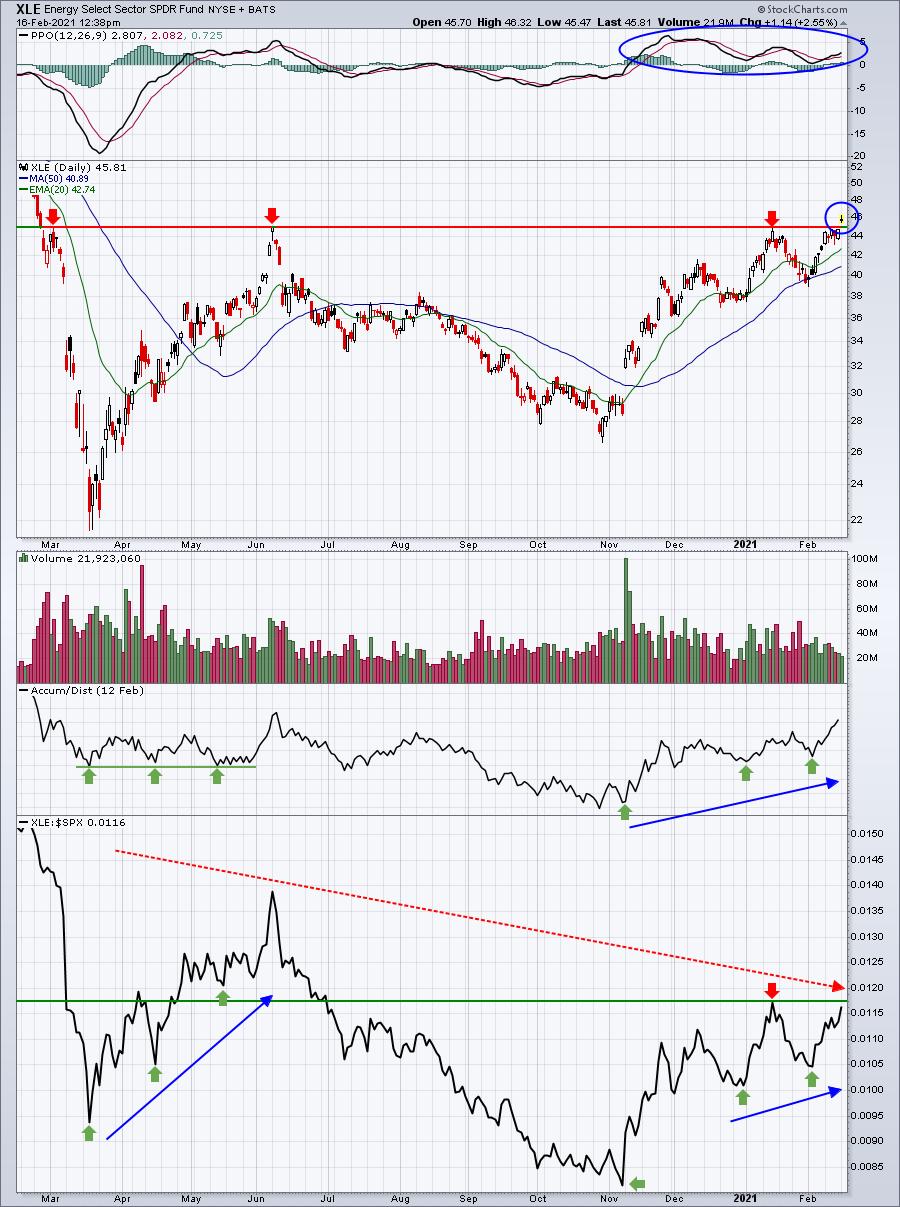
Am I scurrying into my trading account and buying multiple energy stocks today? No. But I will say this. The current rally and breakout looks more promising than any other breakout or attempt at a breakout over the past year. This looks like the real deal to me.
Look at that big rally from March to June. The PPO was VERY red (way below zero), suggesting extremely bearish momentum. The rebound was not convincing at all. Those green arrows under the higher relative strength lows were not matched by higher lows on the AD line. And the upward price action stopped immediately when we hit that first recovery level at the beginning of March.
Now check out this rally. First, understand that the PPO has been exclusively above the centerline. This suggests bullish momentum. Next, the rising relative strength lows are accompanied by a rising AD line. To top it off, we're actually breaking above a critical price resistance level near 45. The day's not over, so let's see how we close. But there's no doubt in my mind that we're going higher in energy from here. The only question is whether the XLE leads or not. This is where I have my doubts, especially if I'm right about the dollar climbing later in 2021.
ChartLists/Strategies
Taking profits is a subject where I receive questions constantly. Obviously, the answer depends quite a bit on your trading strategy. If you're a "buy and hold" type investor, pay attention to weekly charts, not daily or hourly. I'd only grow concerned if long-term relative strength is clearly turning lower and significant price breakdowns are occurring. I'm more of a swing trader, so I tend to respect overhead resistance. While I do anticipate, that in a bull market, prices will continue higher, it doesn't mean they'll continue higher RIGHT NOW. So if I've bought a stock at key support and it's now moved to key resistance, it's likely time for me to take at least partial profits. Below are two charts where overhead price resistance is being tested to explain this concept. If you want to improve your trading results, watch specifically for intraday breakouts that fail. If they do fail, take your money and run. Here are examples of what I'm referring to:
LOVE:
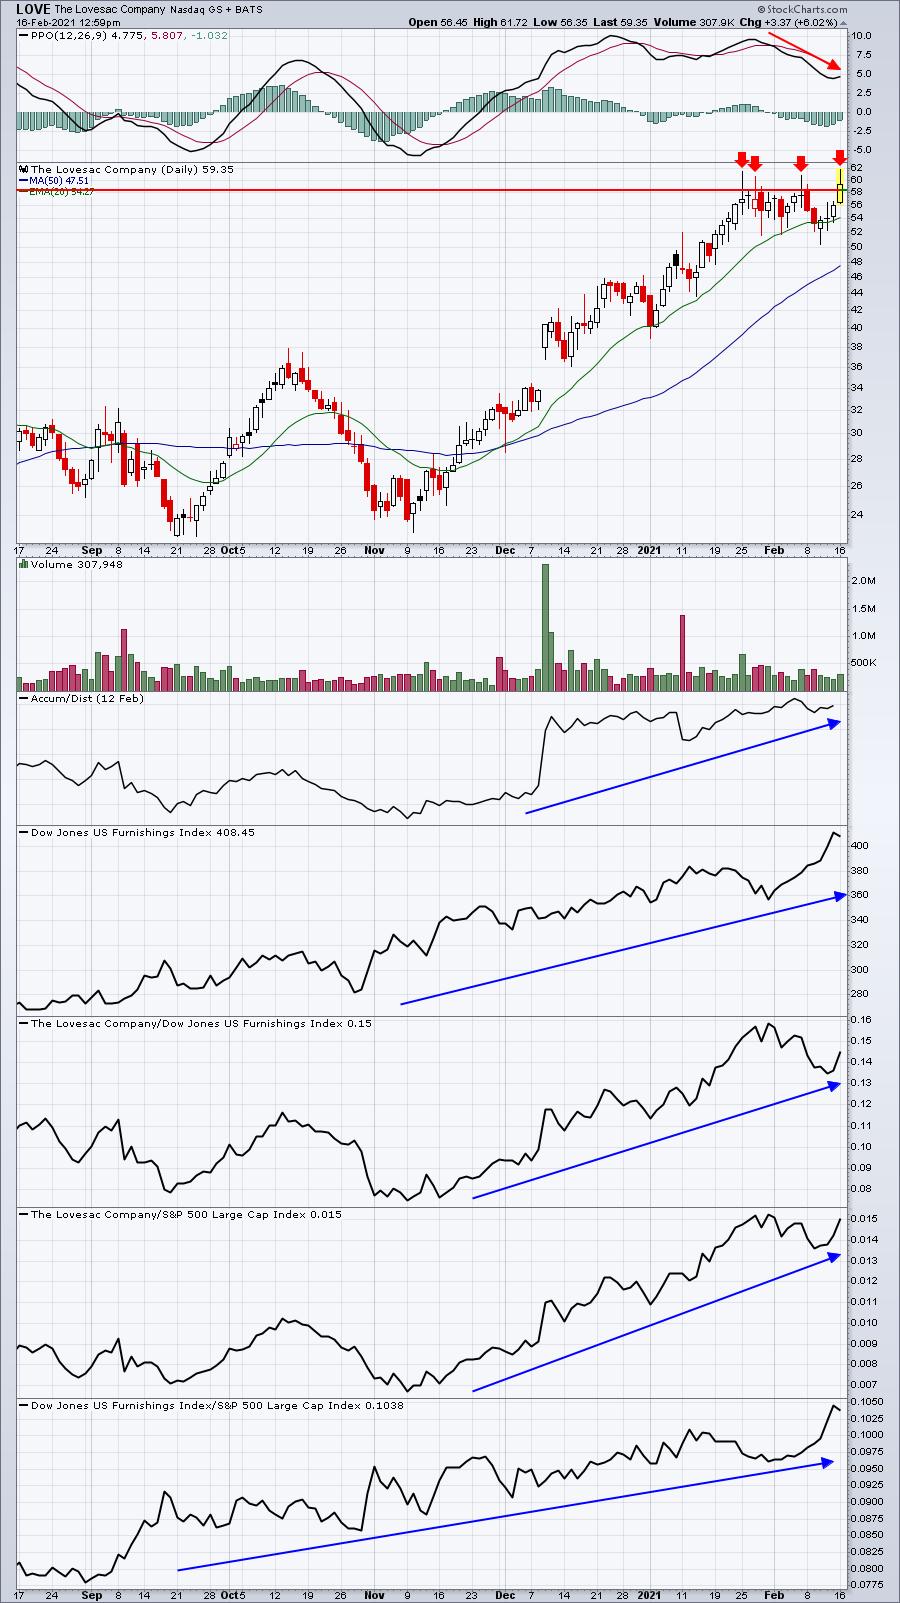
First, let me say that this chart is quite bullish. Longer-term, there's tremendous strength here that suggests the stock will move higher. However, if I'm trading short-term, I need to be aware that today's intraday high eclipsed recent highs. We were in breakout territory. And we were attempting the breakout with increasing volume. A confirmed breakout would be bullish. But a failed breakout with a close today back beneath 58.25, in my view, adds considerable risk to holding this short-term. Note that PPO that's continuing to fall. That's a sign of slowing momentum. That doesn't guarantee me that it's going lower, but it alerts me to the fact that the risk is high to hold, especially if this breakout fails. Technical analysis, to me, is about evaluating risk. It's not about being right or wrong. Those who don't believe in technical analysis either don't understand it, or simply only look at it as a RIGHT or WRONG analysis.
RH:
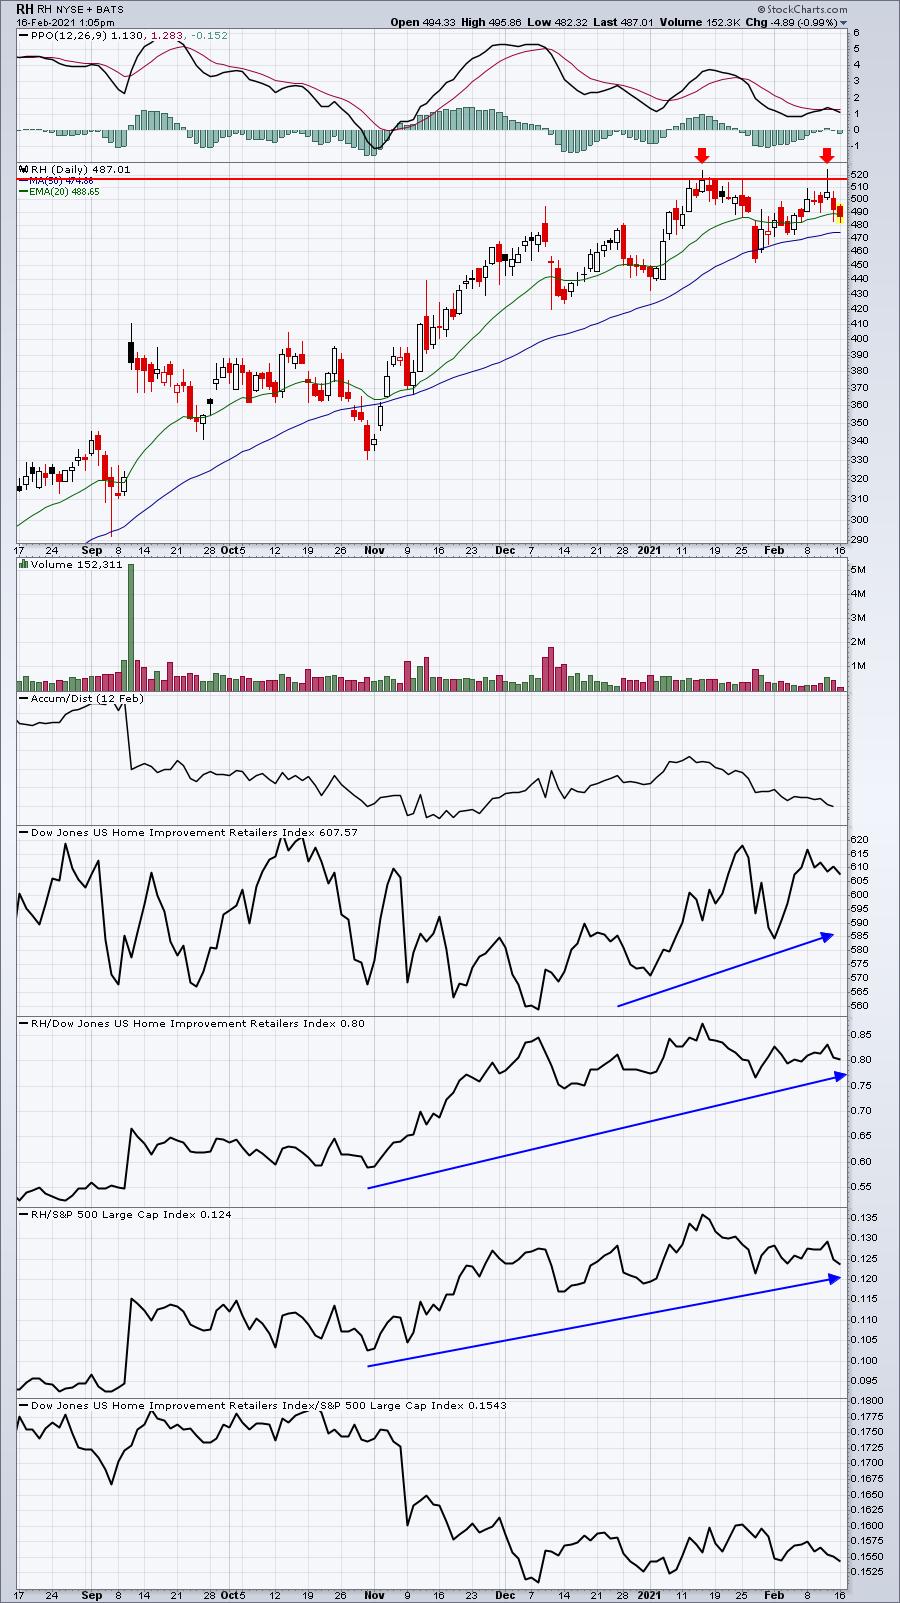
RH actually shows what happens many times after you see that false breakout. It hasn't done anything horrible, but after failing to confirm that intraday breakout a couple trading days ago, the resulting failure has led to a couple of days of lower price action. If you fail to heed that short-term warning, you end up holding back down to the 20 day EMA and giving back your gains. In addition, your capital is tied up longer in a trade that's not working now. Had you sold closer to the failed breakout near 517, that cash would be available for another trade where a stock is at or near key price/moving average support. It goes back to that old saying, "a bird in the hand is worth two in the bush."
If you really struggle with taking profits and end up taking too many losses on previously profitable positions, KEEP A JOURNAL and please be objective. Critique yourself once a week on your trades. Look back over the prior week and go through your trading account. Where did you make money? Where did you lose money? Could you have done something differently. Should you have done something differently? The best teacher in stock market trading is HISTORY. Learn from your mistakes and also be honest about your tendencies.
Earnings Reports
Here are the key earnings reports for the next two days, featuring stocks with market caps of more than $10 billion. I also include a few select companies with market caps below $10 billion. Finally, any portfolio stocks that will be reporting results are highlighted in BOLD. If you decide to hold a stock into earnings, please understand the significant short-term risk that you are taking. Please be sure to check for earnings dates for any companies you own or are considering owning.
Tuesday, February 16:
CVS, ZTS, ECL, PLTR, RNG, A, AIG, OXY, EXAS, VMC, TRU, INVH, SEDG, EXPD, BKI, IPGP, DVN, ALLE, AAP, BRKR, CLR, AN, GWPH, LSCC, BYD, LPX, LZB, DENN
Wednesday, February 17:
SHOP, BIDU, TWLO, ADI, SNPS, NTR, HLT, ES, WCN, GRMN, PXD, TXG, IQ, ALB, RPRX, ET, WIX, SUI, CRL, GPC, PEGA, MOS, BFAM, FSLY, HSIC, CF, OC, NVTA, CONE, ATH, SPWR, QTWO, H, HLF, MRO, PAAS, GMED, CHH, WING, STMP, ALSN, VMI, VCYT, AM, SNBR, TSEM, MANT, SUN, JACK, CAKE, UCTT, LASR, SKT
Economic Reports
February empire state manufacturing index: 12.1 (actual) vs. 5.7 (estimate)
Happy trading!
Tom