
EB Daily Market Report - Wednesday, February 17, 2021
Friday Event
Julius de Kempenaer, creator of the RRG charts, will join me on Friday, February 19th at 10:00am ET for "Evaluating Market Rotation", a timely event considering that our Top 10 Stocks will be announced at this quarter's "DRAFT" on Sunday, February 21st.
If you can't make this event, we'll have a recording available shortly after the event and you can review it at your convenience.
Executive Market Summary
- Futures were mixed overnight, but weakened into today's open
- Our major indices have spent much of the day in negative territory, with the Dow Jones being the exception, and currently trading higher fractionally
- The 10-year treasury yield ($TNX) has reached 1.30%, though it's flat today
- Meanwhile, crude oil ($WTIC, +1.45%) is now approaching $61 per barrel
- Volatility ($VIX) has climbed 3.5% as fears are being stoked by the short-term selling
- (Insert options expiration and legal thievery here)
- Energy (XLE, +0.98%) is the easy winner today with crude oil higher
- The dollar (UUP) is up 0.5%; watch the 24.67 level - a definitive move above that level would be bullish
- Technology (XLK, -1.23%) is the worst performing sector (and also the most heavily traded sector in terms of options)
Market Outlook
How timely was last night's max pain webinar? I discussed the concept and the fact that it would behoove market makers to see lower prices in the QQQ, SPY, TWTR, PYPL, and NIO. Check, check, check, check, and check. Here's where they stand intraday (at last check):
- QQQ: -0.81%
- SPY: -0.20%
- TWTR: -3.18%
- PYPL: -3.28%
- NIO: -3.88%
These 5 stocks/ETFs had an estimated total net call premium of $2.59 billion at yesterday's close. Using prices of these securities as of approximately 2:40pm, this total net call premium was $2.32 billion. That's more than a quarter BILLION in savings in just these 5 stocks. We see this type of legal thievery every month and you have to remain vigilant as a short-term trader and beware the options-expiry-induced selling that sometimes takes place.
I also said looking at consumer staples (XLP) for short-term gains might make sense given their lack of participation in the recent rally. The XLP trails only the XLE in today's trading and the two stocks that I suggested it would behoove market makers to see higher prices were CLX and TAP. They're up 1.62% and 1.84%, respectively. It's a MIRACLE! (sarcasm intended).
Sector/Industry Focus
Technology (XLK) is clearly the worst performing sector today. So I decided to take a look at how each industry group is performing today. I want you to check out this technology leaderboard:
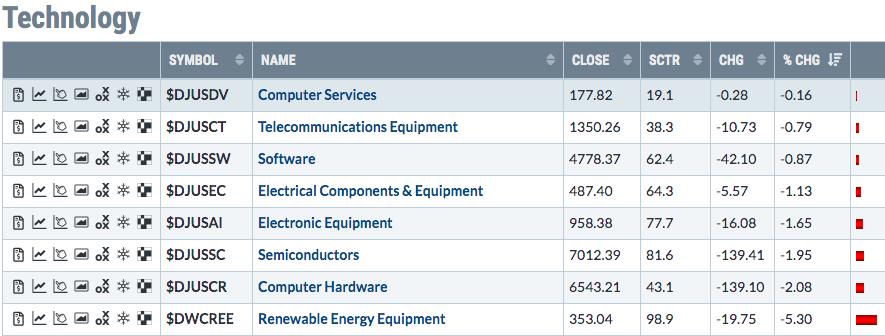
The worst selling is taking place in the industry groups with the highest SCTR scores (most relative strength recently). But, not too shockingly, the one industry group that's not really getting caught up in the selling is computer services ($DJUSDV). Check out the SCTR score on the DJUSDV. 19, the worst relative strength reading in the group. This selling is about taking lower those stocks that have performed well and where max pain resides well below current price.
Market makers should be dressed in orange jumpsuits.
ChartLists/Strategies
Let's continue our discussion from yesterday and spot other "tops" where we saw false breakouts. It's very important to train your eyes to see these false breakouts:
TTC:
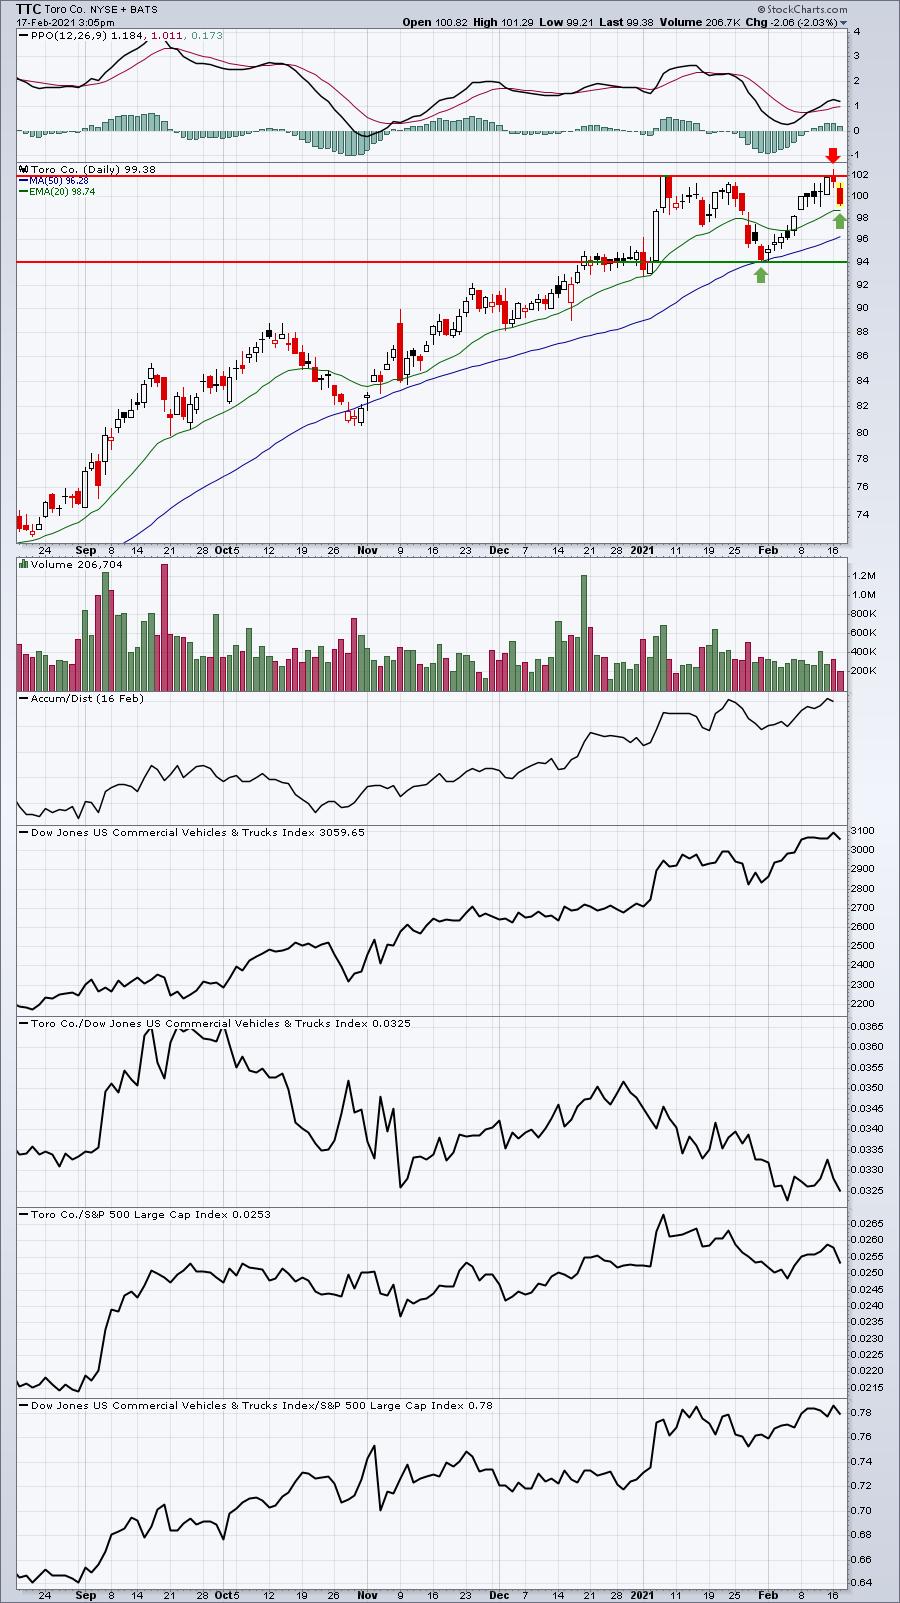
I'm expecting TTC to turn at its rising 20 day EMA. Failure to do so would increase the odds of further sideways consolidation and more selling down to the price support level shown.
WGO:
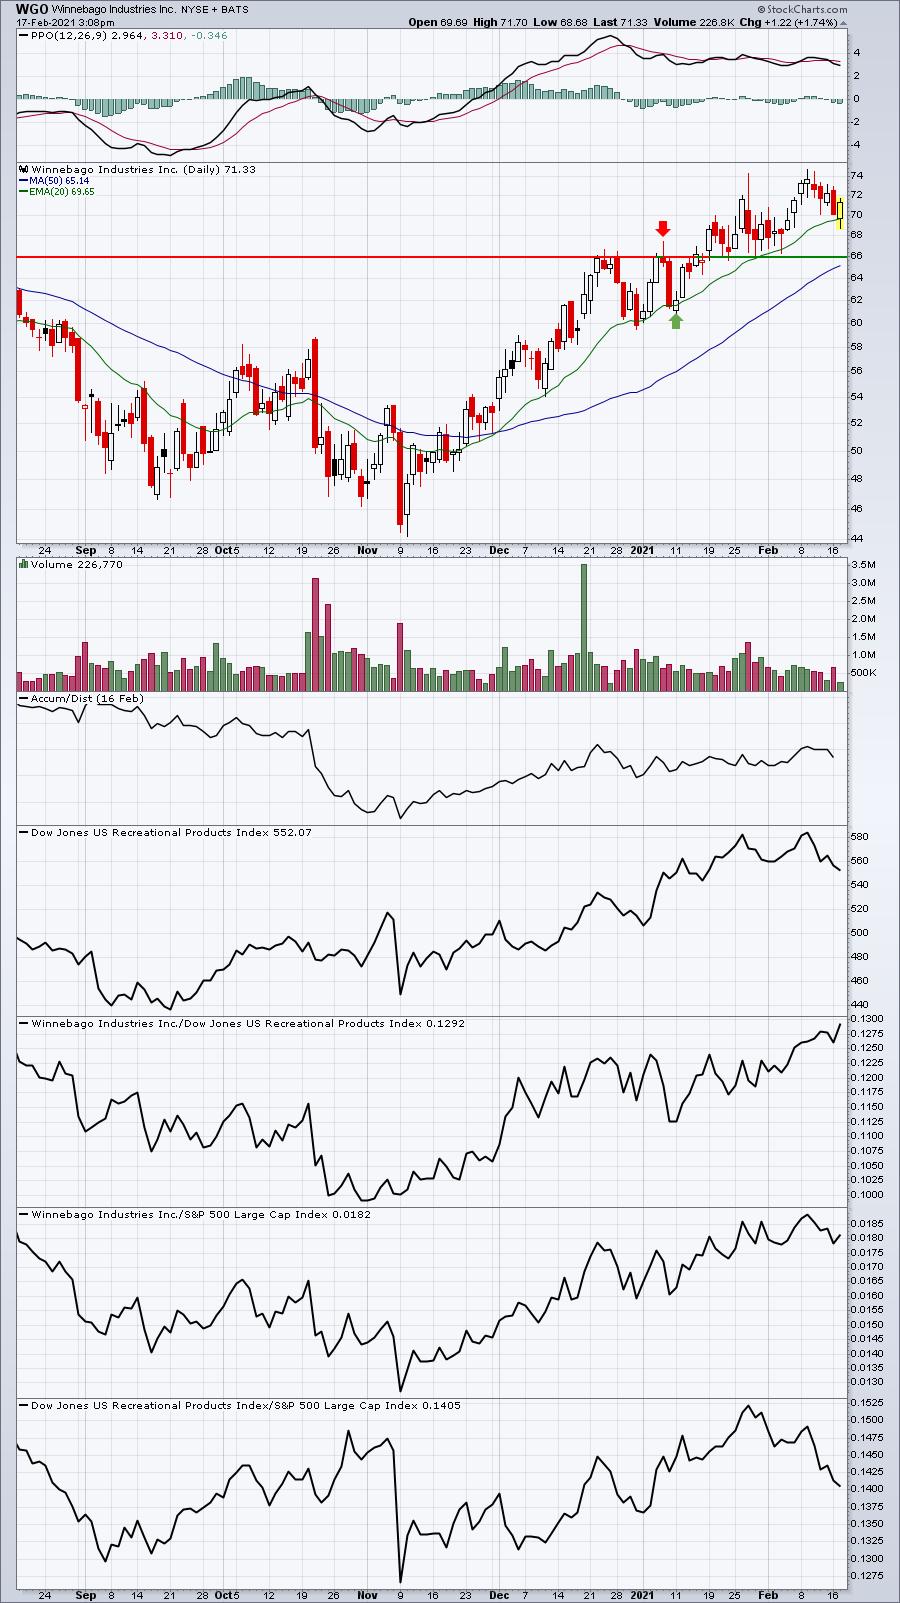
Here's another example of a false breakout in early January, followed by a bit of selling down to the rising 20 day EMA. From there, the bullishness returned. This is what I'm looking for on TTC. We'll see.
Is the selling on certain stocks being overdone? In some instances, probably so. I'd look for false breakdowns at key support when buying (or simply tests of support as the risk is reduced when buying at or near support). Here are a few examples of stocks falling back into key support areas:
ACI:

We're not guaranteed price action will turn higher from this support zone. But if the support fails to hold, our risk is much lower buying at support than it would have been buying a few weeks ago.
ABMD:
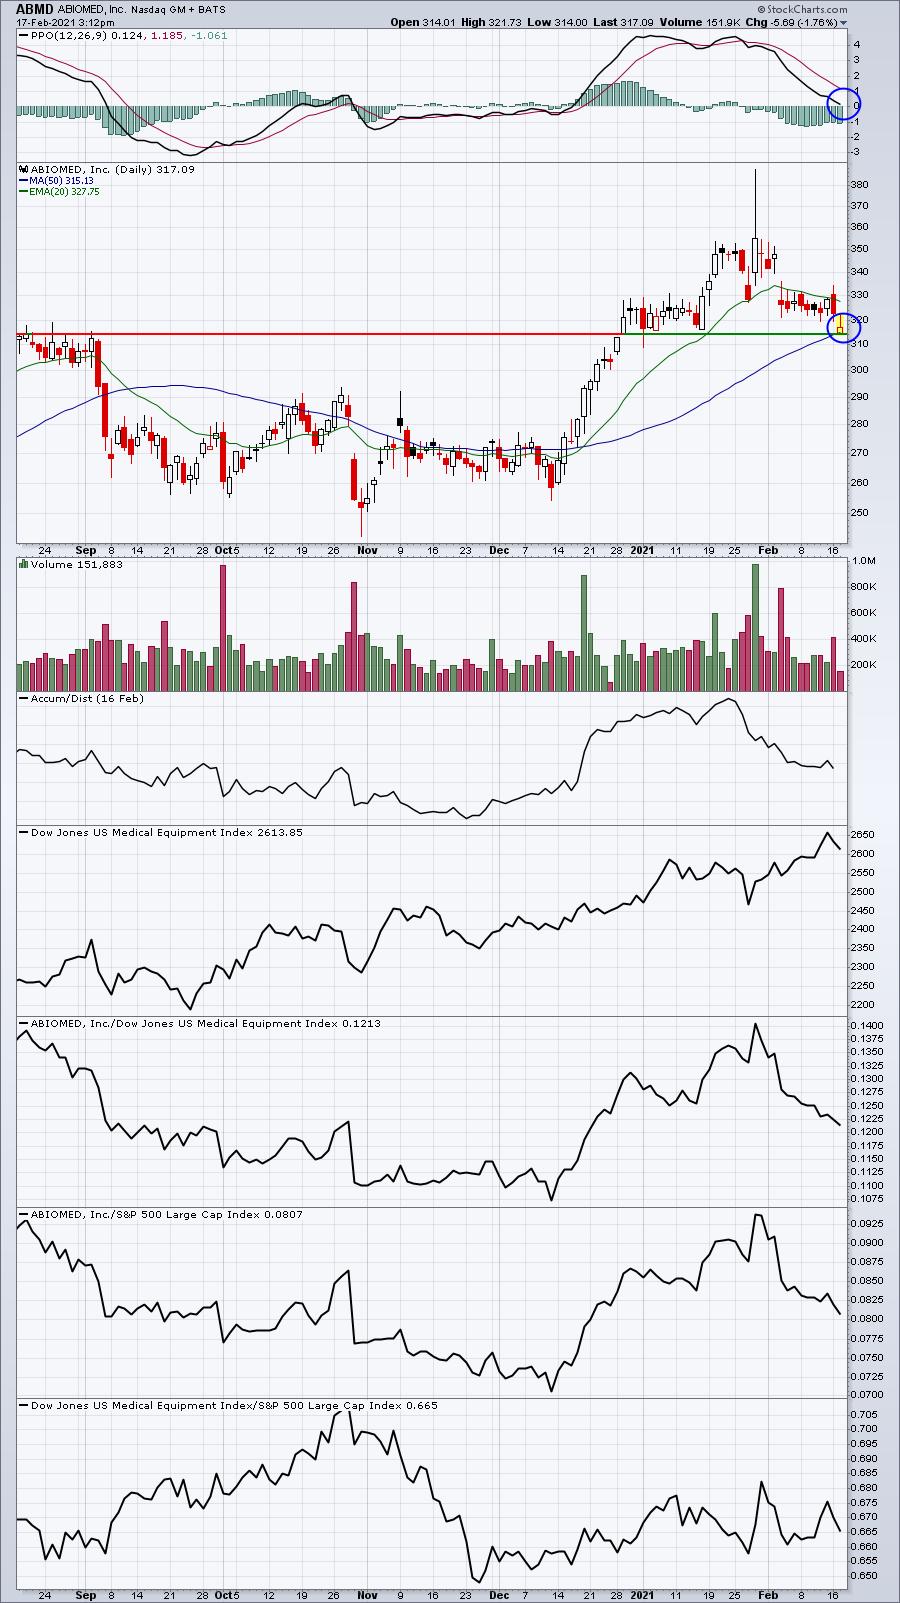
In addition to price support, ABMD is also testing its 50 day SMA, while its PPO returns to centerline support.
HAE:
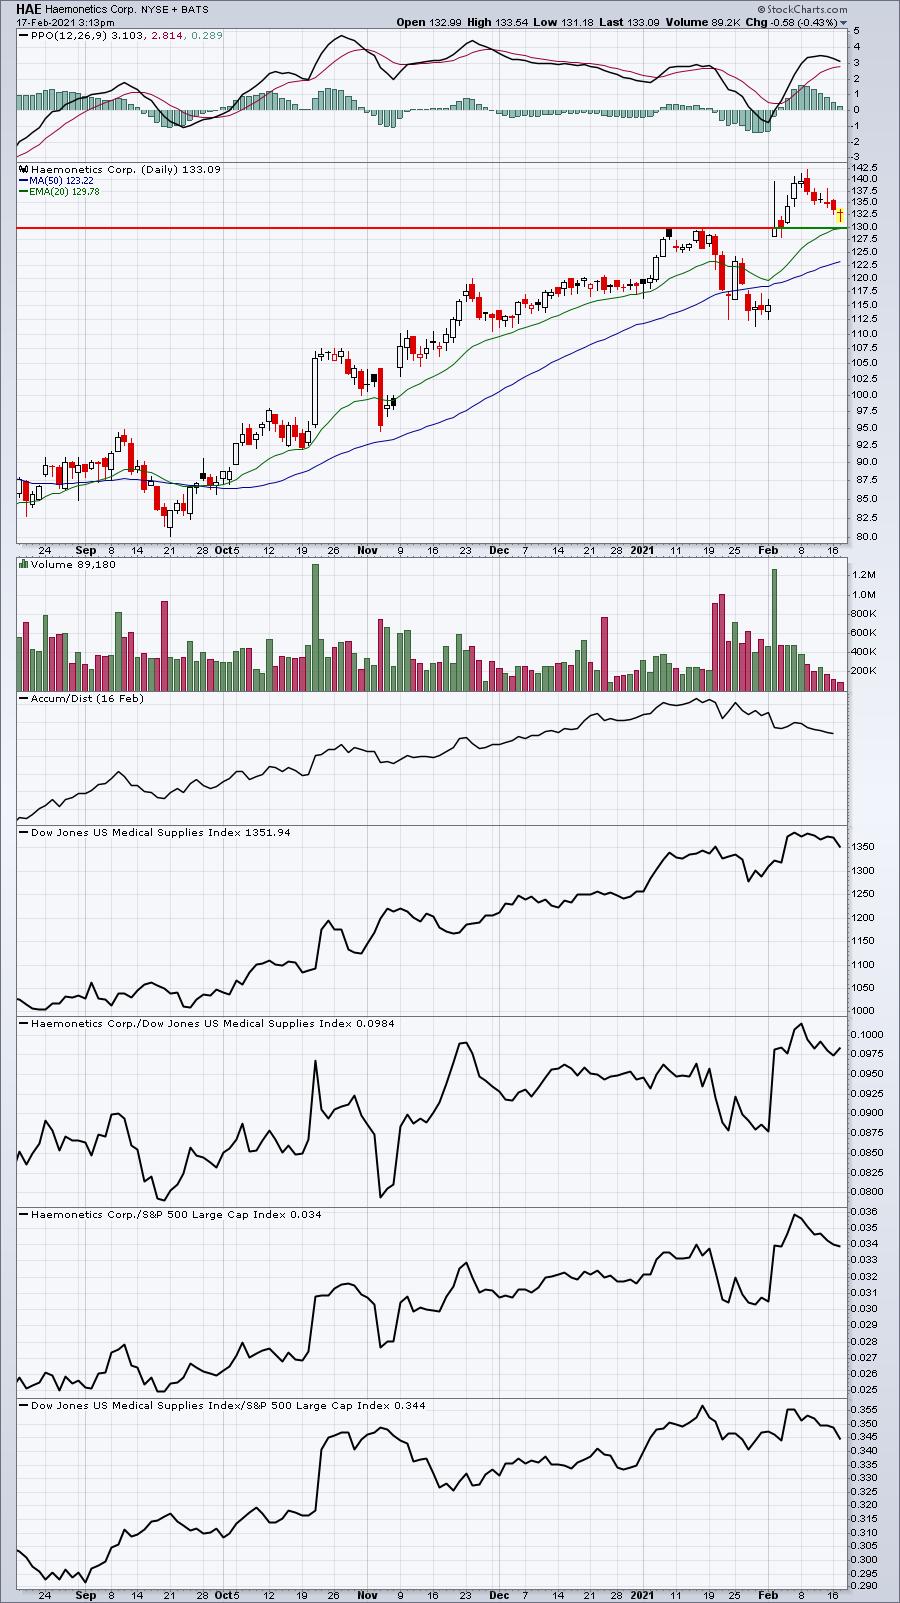
Price support here coincides with the rising 20 day EMA. Reward to risk begins to look quite solid when levels like this are reached.
Earnings Reports
Here are the key earnings reports for the next two days, featuring stocks with market caps of more than $10 billion. I also include a few select companies with market caps below $10 billion. Finally, any portfolio stocks that will be reporting results are highlighted in BOLD. If you decide to hold a stock into earnings, please understand the significant short-term risk that you are taking. Please be sure to check for earnings dates for any companies you own or are considering owning.
Wednesday, February 17:
SHOP, BIDU, TWLO, ADI, SNPS, NTR, HLT, ES, WCN, GRMN, PXD, TXG, IQ, ALB, RPRX, ET, WIX, SUI, CRL, GPC, PEGA, MOS, BFAM, FSLY, HSIC, CF, OC, NVTA, CONE, ATH, SPWR, QTWO, H, HLF, MRO, PAAS, GMED, CHH, WING, STMP, ALSN, VMI, VCYT, AM, SNBR, TSEM, MANT, SUN, JACK, CAKE, UCTT, LASR, SKT
Thursday, February 18:
WMT, AMAT, SO, ROKU, WM, NEM, MAR, TRP, TTD, GOLD, KEYS, CPRT, HRL, ANET, ED, EPAM, WST, PPL, VTR, AEE, NICE, FE, APPN, WAB, VICI, OMC, LNT, LKQ, OLED, HST, TECK, DBX, GLPI, FVRR, QDEL, GLOB, RS, COG, PLNT, TXRH, GTLS, TRIP, RXT, EVBG, TDS, VC, OPK, TPH, BLMN, AAWW, EHTH
Economic Reports
February PPI: +1.3% (actual) vs. +0.4% (estimate)
February Core PPI: +1.2% (actual) vs. +0.2% (estimate)
February retail sales: +5.3% (actual) vs. +1.1% (estimate)
February retail sales less autos & gas: +6.1% (actual) vs. +0.5% (estimate)
January industrial production: +0.9% (actual) vs. +0.5% (estimate)
January capacity utilization: 75.6% (actual) vs. 74.8% (estimate)
December business inventories: +0.6% (actual) vs. +0.5% (estimate)
January housing market index: 84 (actual) vs. 83 (estimate)
FOMC minutes released at 2:00pm ET
Happy trading!
Tom