
EB Daily Market Report - Tuesday, February 23, 2021
Executive Market Summary
- Futures were weak once again as the selling was again concentrated in NASDAQ stocks
- After opening lower, we saw a rebound this morning, but weakness is coming back in the last half hour or so
- The 10-year treasury yield ($TNX) has reversed off earlier highs near 1.39%
- Financials (XLF, +0.24%) have benefited from that early move higher in the yield
- The utilities (XLU, +0.38%), consumer staples (XLP, +0.14%), and real estate (XLRE, +0.08%) sectors have managed to escape today's selling
- Consumer discretionary (XLY, -2.38%) and technology (XLK, -2.05%) are again the targets of the selling
- Automobiles ($DJUSAU, -5.50%) are particularly weak with Tesla (TSLA, -6.18%) shares giving up more ground
- Many energy (XLE) and gambling ($DJUSCA) names lead the S&P 500; MGM and WYNN are both higher by roughly 3.5% on the session mid-day
Market Outlook
I believe much of this current weakness is related to last week's options expiration. I believe it's also extended to other "leaders" so that institutions can accumulate ahead of the next run in growth stocks. This is just my opinion. But I'm not seeing other signs that this short-term weakness will morph into something longer-term. As always, I'll be watching rotation to see certain areas warrant further attention on our part. Despite selling this week, I still LOVE consumer discretionary (XLY). But rotation within the XLY needs to be monitored. For instance, here's the rotation that's taken place the past week:
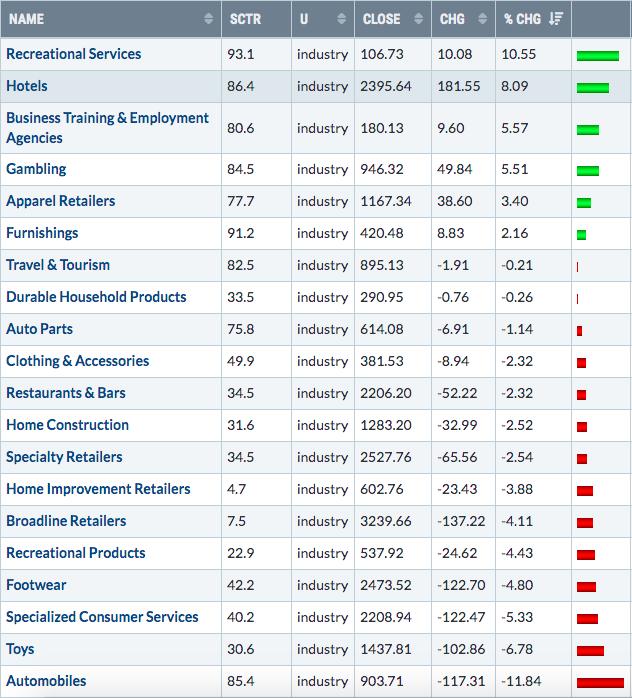
Some of this strength I still don't trust. Yes, they may show short-term strength, but I still believe it's very uncertain whether they lead during the balance of 2021. Recreational services ($DJUSRQ) is a prime example of that. But I do like business training, gambling, and apparel retail. Then at the bottom we see automobiles. I'm still a fan of the group, but short-term I recognize the issues. Don't lose sight of AD lines, though. TSLA, for example, is seeing its highest volume since mid-December. A strong finish this afternoon could send TSLA to a new high in its AD line as price falls back - a very good longer-term signal in my humble opinion.
During selloffs like the one we're in, Volatility ($VIX) always becomes a key factor. This, too, is a positive sign as the VIX hit a high of just 27 - compared to 37 in January with less selling - and it's backed off to 24.70. The next four hours will be important short-term. If we see more selling this afternoon and close at or near the lows of the day, then expect more selling this week. If we rebound this afternoon, and especially if we end the day near or on our highs, then accumulation is mostly likely underway and the intermediate-term bottom has likely formed. I'm leaning toward the latter, but honestly I'm open to either scenario.
Longer-term, nothing has changed for me. I remain as bullish as ever.
Sector/Industry Focus
I'm a HUGE fan of semiconductors ($DJUSSC). It's the only group where I placed four different stocks into our four portfolios. The group has been so strong that simply cannot afford to ignore them. While selling among many of these stocks have been significant this week, let's keep in mind two things that I've talked about. First, we're seeing story after story now about how higher interest rates are going to kill this rally. Hogwash. And I even pointed out a few weeks ago that this was going to be the media's new play toy. Second, it's been a week since we had our February Max Pain webinar. Do you remember where the QQQ resided a week ago? It closed at 335.54. We indicated that Max Pain on the QQQ was 319.10. At the time, it was probably hard to imagine that we'd see that kind of drop around options expiration, right? Well, one week later and the QQQ hit a low of 311.00!!!!! Welcome to the world of options expiration and the criminal (but legal) activity of the market makers. You might think, "well, Wall Street firms don't control the media." I'd beg to differ. If a Goldman Sachs analyst says that interest rates are going to be a problem for the market, the media JUMPS all over it. Not only that, but they put their own little twist on the headlines. Here was a recent article on CNBC that was published one week before options expired:
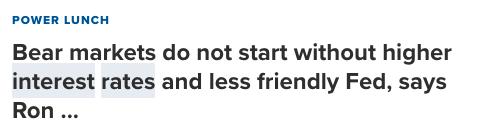
Who said anything about a "bear market"? Earlier today, the Fed said they are not concerned about inflation and they haven't changed their stance on interest rates. This is how "spin" works. Write the most negative and shocking headline that you can.......to get noticed.
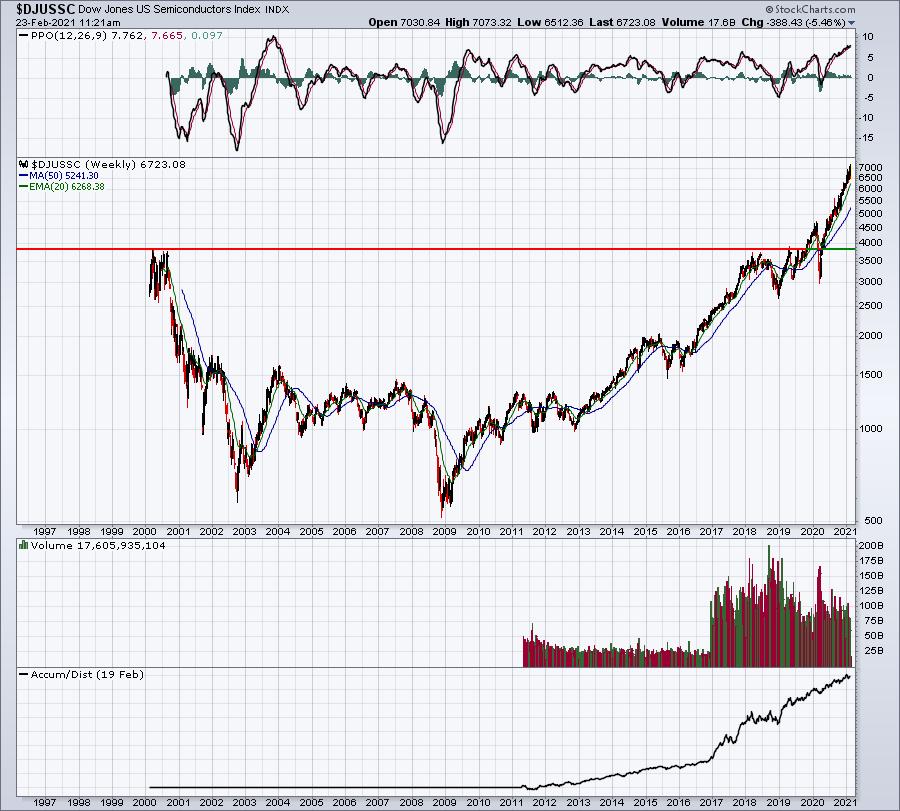
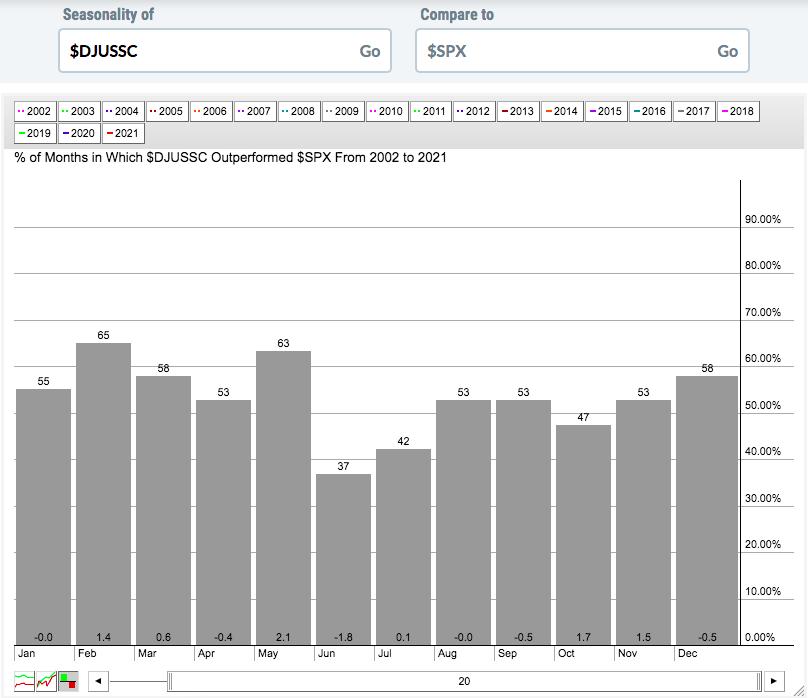
Listen, the semiconductors have had a HUGE run for a LONG time and will eventually pause. Perhaps we're seeing the start of a pause now, though I'm not so sure it isn't more of an options-induced selloff. I will first show you a long-term weekly chart of the DJUSSC, followed by a seasonality chart that covers the past 20 years:
20-year weekly chart:
20-year seasonality chart:
Couple points here:
(1) The semiconductors, very much like the overall U.S. stock market, went many, many years without any gain whatsoever. From the high that you see in 2000 to the high in 2019, the group, as a whole, went absolutely nowhere. We broke out just before the pandemic hit. When everyone decided to panic sell in March, institutions were buying semiconductors like crazy. The rising 20 week EMA was last tested in late-October 2020. I believe the "worst case scenario" (my opinion, of course) would be another 20 week EMA test, which is currently just below 6300. On the daily chart, a drop to 6300 would look something like this:
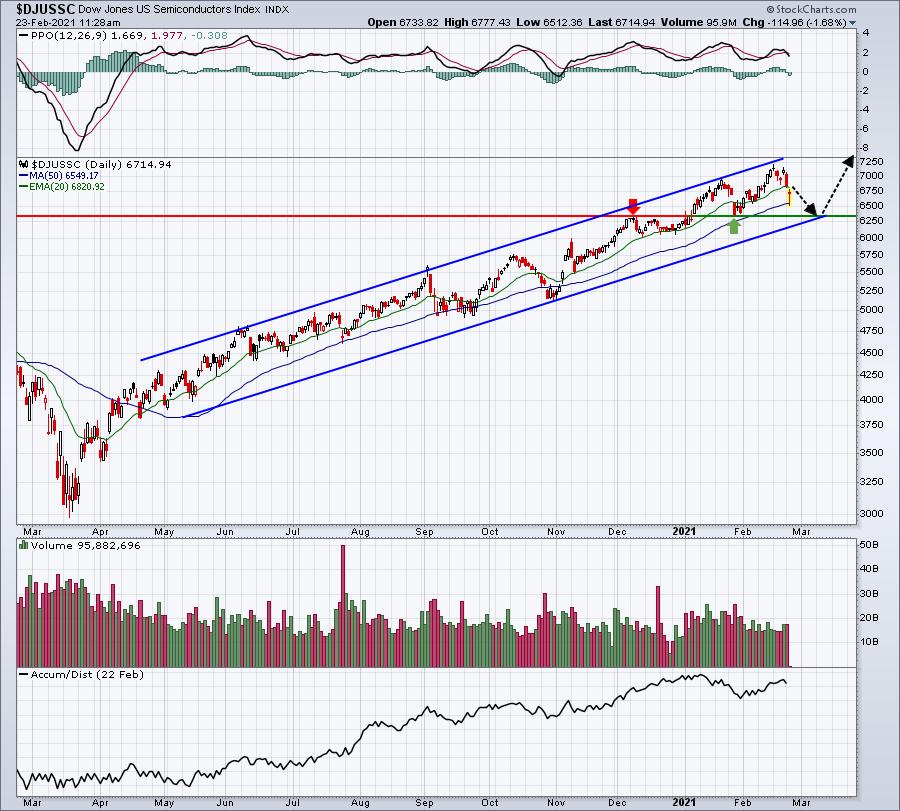
When the market grows more fearful, it does crazy things. We remain in that 19th to 25th period of the calendar month, which can also be unpredictable. My opinion is to stick with semiconductors longer-term, recognizing that the short-term could be highly volatile. Once we get past this week, I believe we'll see things settle down.
Now for my second point - getting back to that seasonality chart. That is a RELATIVE seasonality chart. It shows us how the semiconductors perform historically (over last 20 years) vs. the S&P 500. We tend to see solid relative action through May. The summer months can be more challenging, especially from June through September, where we show little relative strength. Currently, however, we remain in a relatively good spot historically.
ChartLists/Strategies
If you have a more aggressive trading mindset, here are a few stocks that have been beaten to a pulp the past week or so and could produce exceptional short-term returns:
TLRY:
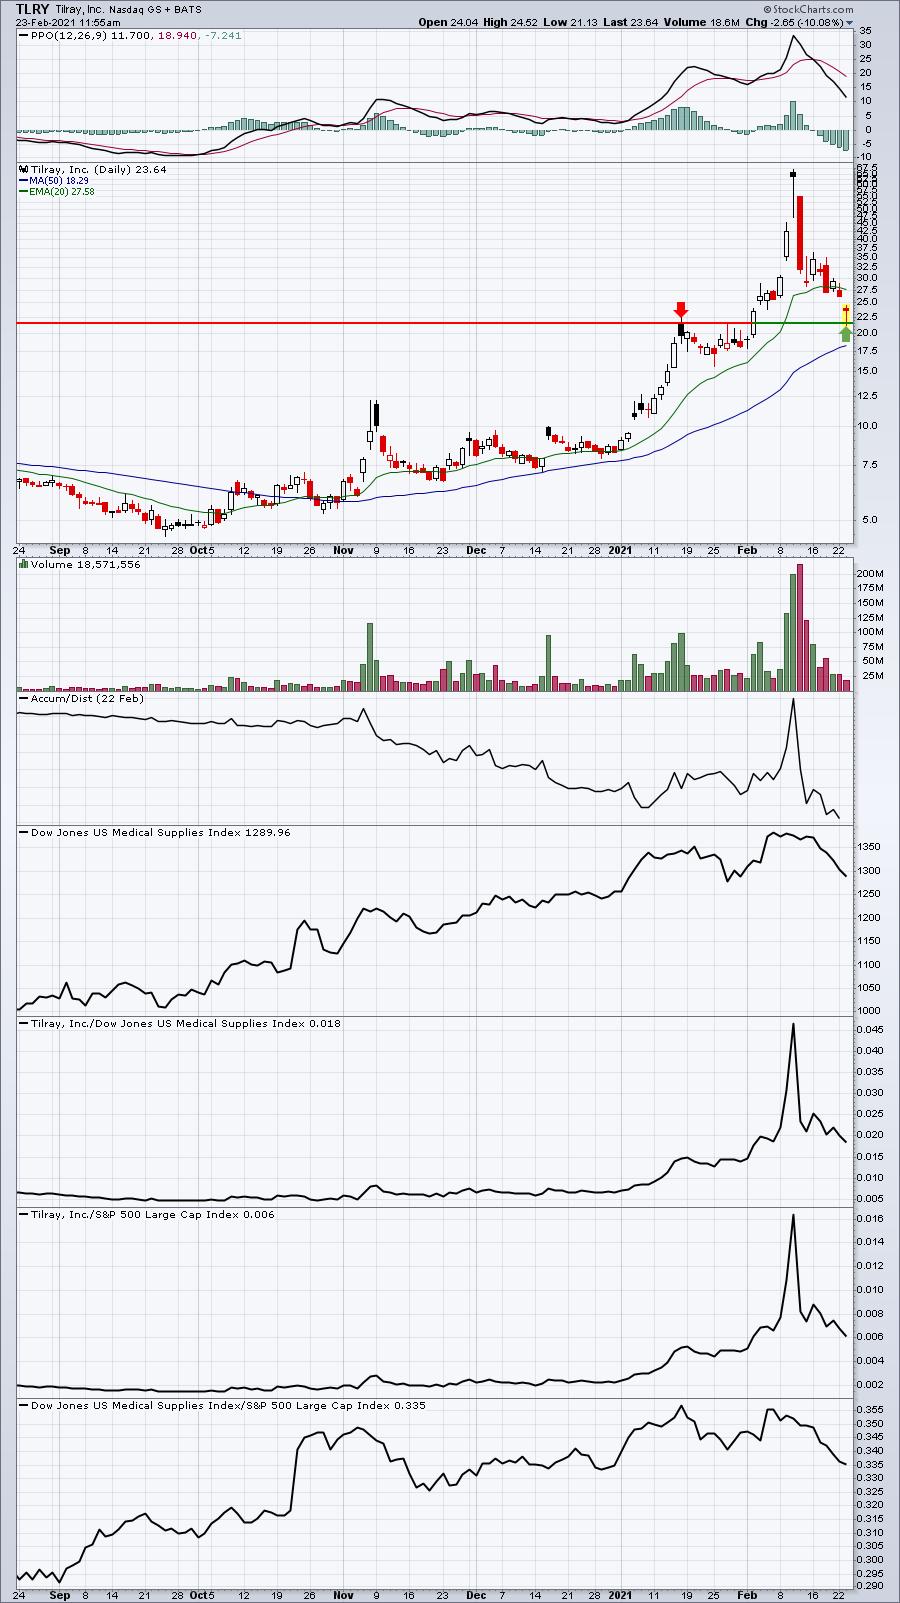
Does it get any more volatile than this? One very good technical reason to buy TLRY, though, is that it's worked its way back to test the breakout level from early February. Who thought that would happen?
AOSL:
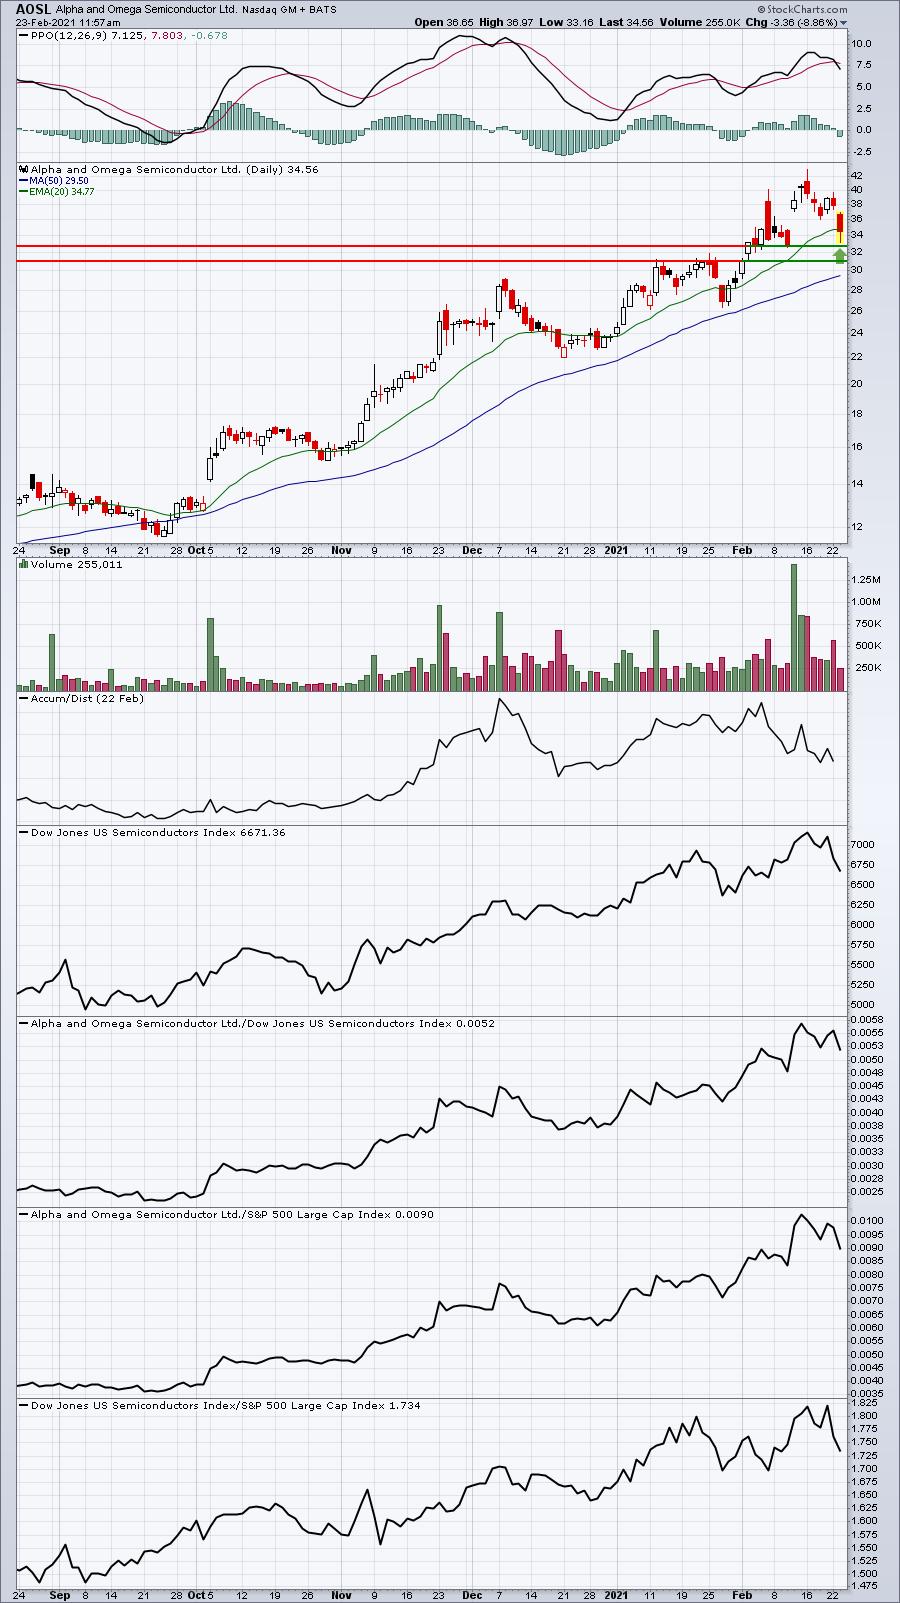
If the selling in semiconductors continues, perhaps you'll see AOSL in the 31.00-32.50 area, but we've already seen a big drop and a close back above the 20 day EMA at 34.77 would be bullish.
VERU:
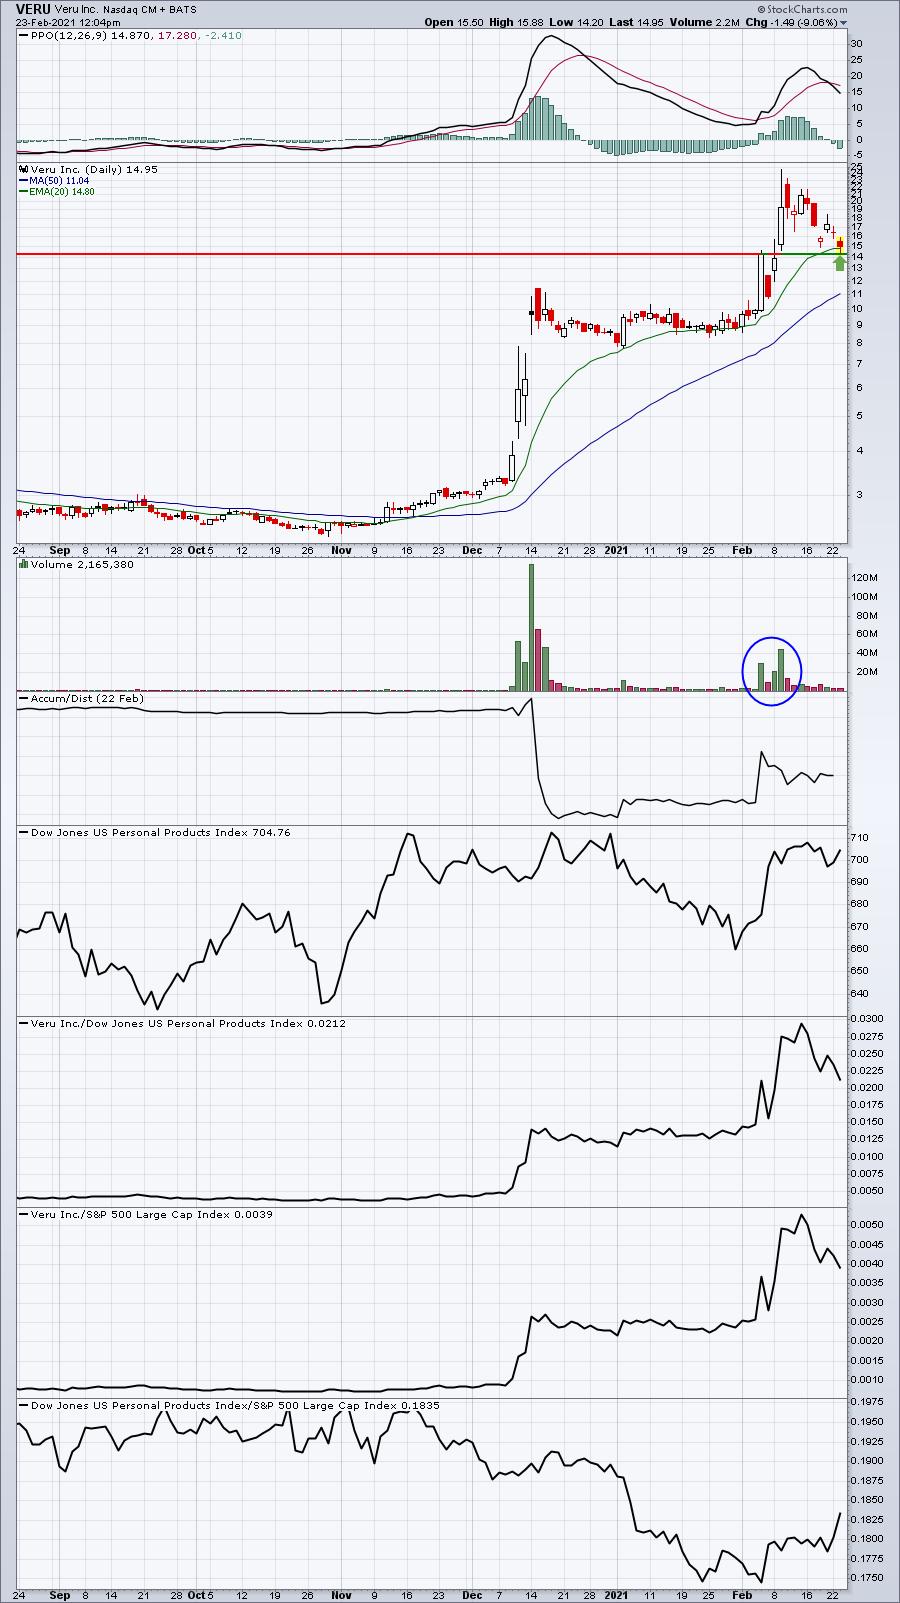
VERU has pulled back from nearly 25 just under two weeks ago to today's price at 14.95. It's an extremely volatile stock, but it could absolutely rebound very quickly as well. It's also testing its 20 day EMA for the first time since that heavy volume acceleration earlier this month.
As I said above, these are EXTREMELY VOLATILE stocks that present high risk, but also could produce very nice returns. It's up to each individual how much risk you're willing to take. The other thing about the three above is that they're in different industries within different sectors. It's simply been a SELL ALL LEADERS mantra the past several days and these 3 babies have been thrown out with the bath water.
Earnings Reports
Here are the key earnings reports for the next two days, featuring stocks with market caps of more than $10 billion. I also include a few select companies with market caps below $10 billion. Finally, any portfolio stocks that will be reporting results are highlighted in BOLD. If you decide to hold a stock into earnings, please understand the significant short-term risk that you are taking. Please be sure to check for earnings dates for any companies you own or are considering owning.
Tuesday, February 23:
HD, MDT, SQ, INTU, BNS, BMO, TRI, CSGP, ALC, VRSK, XP, EC, CBRE, PXD, PODD, HEI, LDOS, MASI, AGR, PPD, EQH, WLK, PEN, COG, TOL, UPWK, NXST, CROX, FLS, M, SPR, SPT, MATX, LGIH, ARNC, COOP, RRC, MYGN, SYX
Wednesday, February 24:
NVDA, LOW, RY, BKNG, TJX, BILI, TDOC, PSA, EXC, VIAC, ANSS, AWK, CQP, HZNP, ETR, LNG, GH, OAS, NTAP, ESTC, ELAN, LB, FNF, BHC, RGEN, WTRG, RDFN, AMED, EV, PSTG, APA, MGNI, NEO, TNDM, DDD, OSTK, CDNA, MMSI, ODP, VCEL
Economic Reports
December Case-Shiller home price index: +1.3% (actual) vs. +1.0% (estimate)
December FHFA house price index: +1.1% (actual) vs. +0.8% (estimate)
February consumer confidence: 91.3 (actual) vs. 90.0 (estimate)
Happy trading!
Tom