
EB Daily Market Report - Monday, March 1, 2021
ChartList Updates
Many ChartLists were updated over the weekend, including:
- Strong Earnings ChartList (SECL)
- Strong Future Earnings ChartList (SFECL)
- Raised Guidance ChartList (RGCL)
- Short Squeeze ChartList (SSCL)
- Upcoming Earnings ChartLists (5)
- Seasonality ChartList
You can go to our website and view/download these on our ChartLists page.
The Seasonality Report and Short Report will be published within the next 24-48 hours. Again, the Seasonality ChartList for March and the latest Short Squeeze ChartList have both been updated, but the reports haven't been sent out yet. Look for these reports over the next day or two.
Executive Market Summary
- Futures were higher right on cue as we begin a fresh month
- The U.S. Dollar hit a 3-week high earlier today as the greenback is poised to rally further - see Market Outlook below
- The 10-year treasury yield ($TNX) is down a basis point to 1.45% as we see further consolidation in the bond market
- Gold ($GOLD) is down again this morning, trading at its lowest level since June
- Crude oil ($WTIC) is down 1.5%, but energy (XLE, +3.05%) is still among today's sector leaders
- Financials (XLF, +3.48%) and industrials (XLI, +3.18%) are the two leaders; all 11 sectors are higher
- Real estate (XLRE, +0.91%) is lagging on today's session
- 29 of 30 Dow Jones component stocks are higher
- Renewable energy ($DWCREE, +6.94%) and autos ($DJUSAU, +4.78%), after pausing recently, are among today's best performing industry groups
- Zoom Video Communication (ZM, +9.17%) reports its latest quarterly results after the bell today
Market Outlook
I don't know if you've been following the dollar index ($USD), but it's beginning to move higher and I believe it's beginning to confirm what I've been suspecting for weeks - the dollar will rally during the balance of 2021. As a refresher, the dollar typically follows the difference between U.S. 10-year treasury yields and German 10-year treasury yields ($UST10Y-$DET10Y). When there's an inverse relationship, once that correlation begins to hook back to the upside, the dollar typically reverses course. I think that's happening now:
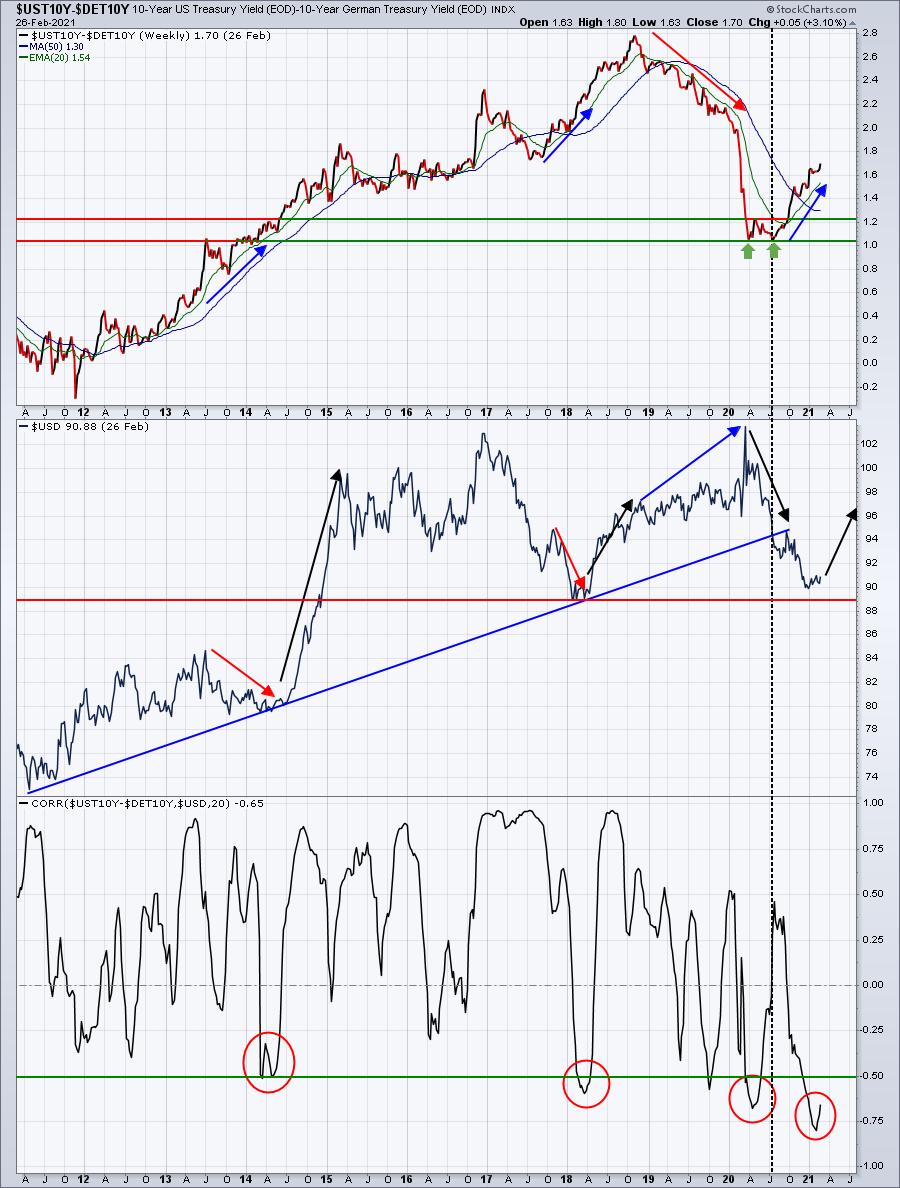
The four red circles highlight the inverse correlation. When we saw this inverse correlation reverse in the previous three instances, check out the dollar's reversal (solid black directional line). I've drawn in the fourth black directional line as my guess at how the dollar is going to react over the coming weeks and months. If I'm right about the dollar, it is likely to have a negative impact on materials (XLB) and energy (XLE) on a relative basis. I would still expect both the XLB and XLE to rise, but I'd expect both to show relative weakness.
Sector/Industry Focus
Materials (XLB) and energy (XLE) have the tendency to underperform when the dollar rises. Therefore, if you're currently long these two sectors, at least understand the possible ramifications if I'm correct about dollar strength in 2021. Here's a long-term chart of the relative strength of both materials (XLB:$SPX) and energy (XLE:$SPX) with the dollar index plotted in the panel just beneath:
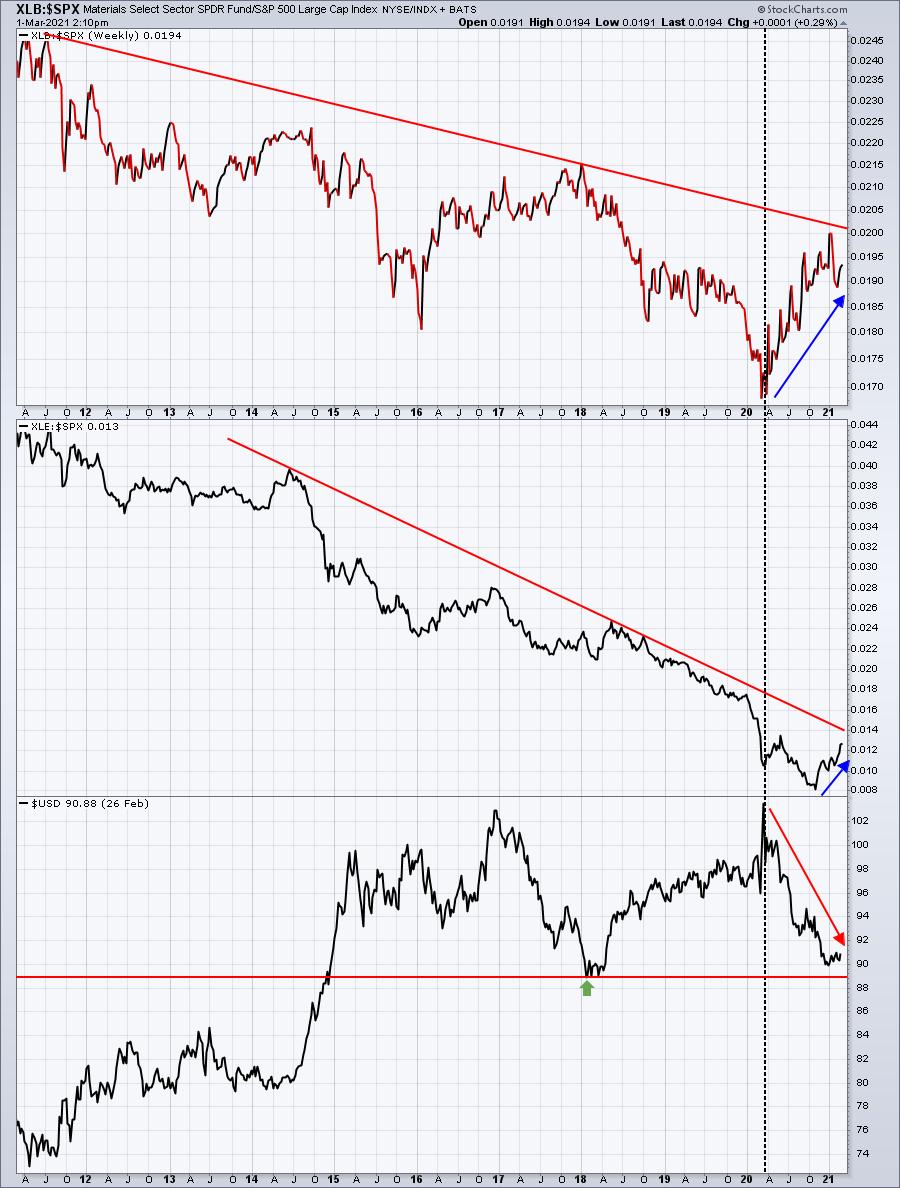
I know we've seen a really nice stretch of relative strength in both the XLB and XLE, but keep in mind it's occurred with a falling dollar. Unless the $USD breaks convincingly through 89 support, I'd be very, very nimble when it comes to owning materials and energy stocks. Just my two cents.
ChartLists/Strategies
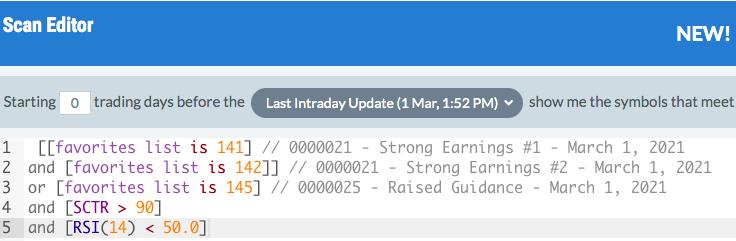
I ran a scan of our Strong Earnings ChartLists (SECL - we now have two because there are more than 500 stocks) and our Raised Guidance ChartList, looking for SCTRs above 90, but RSIs below 50 (pullback). Here was the scan syntax, followed by the results:
Scan syntax:
Scan results:
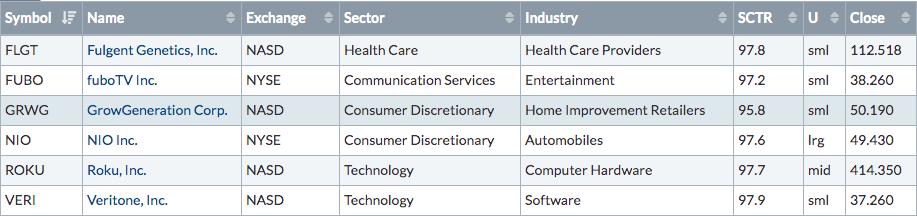
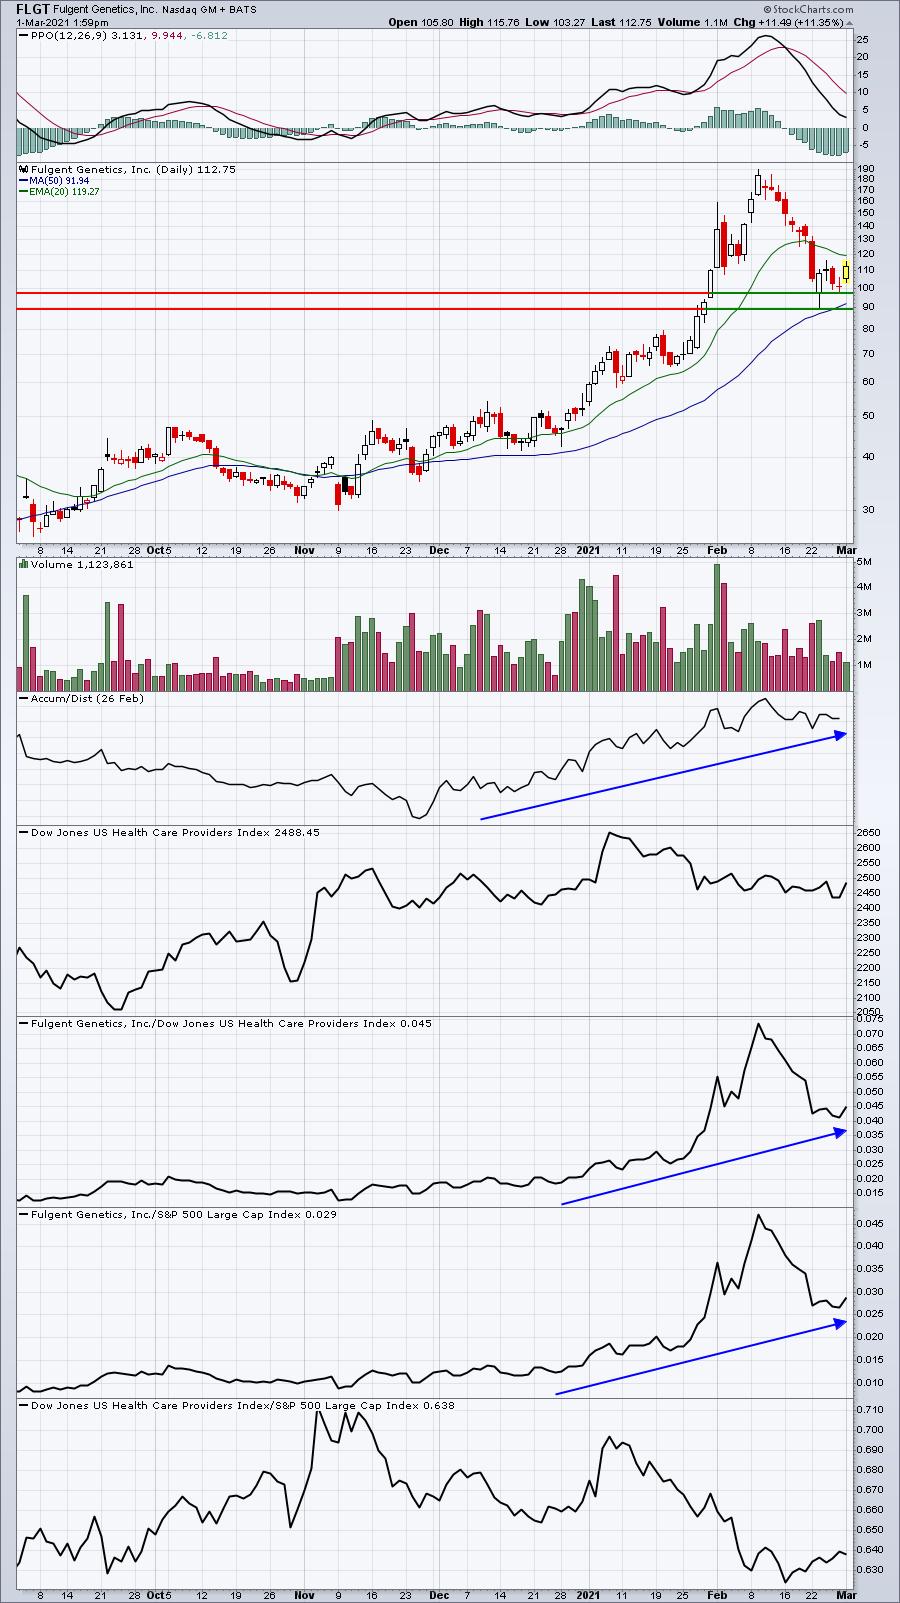
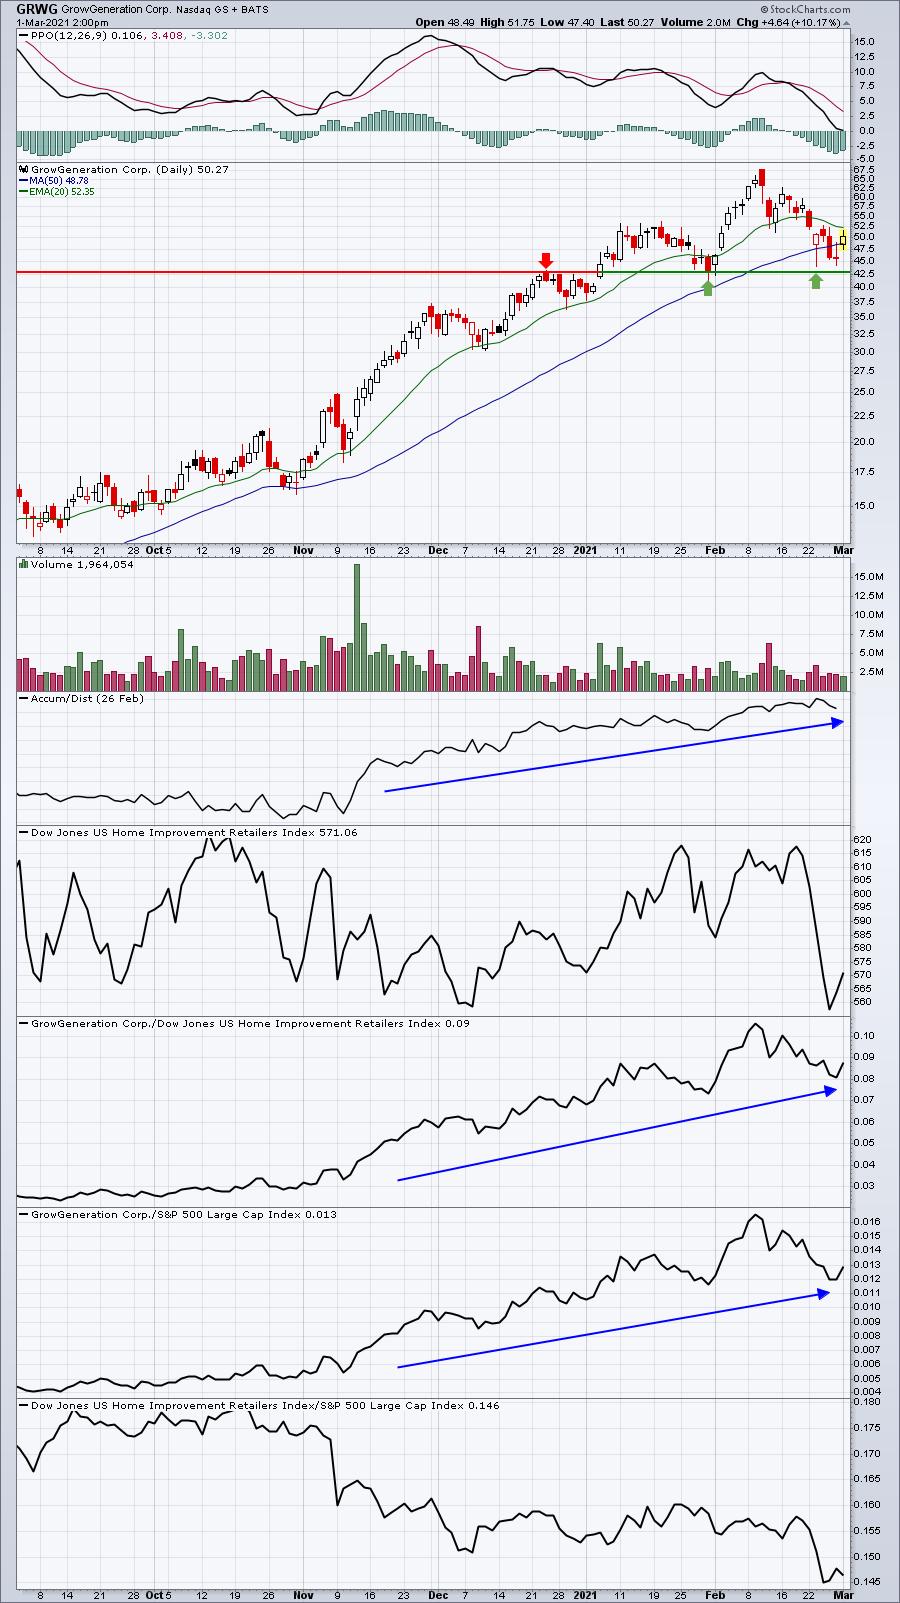
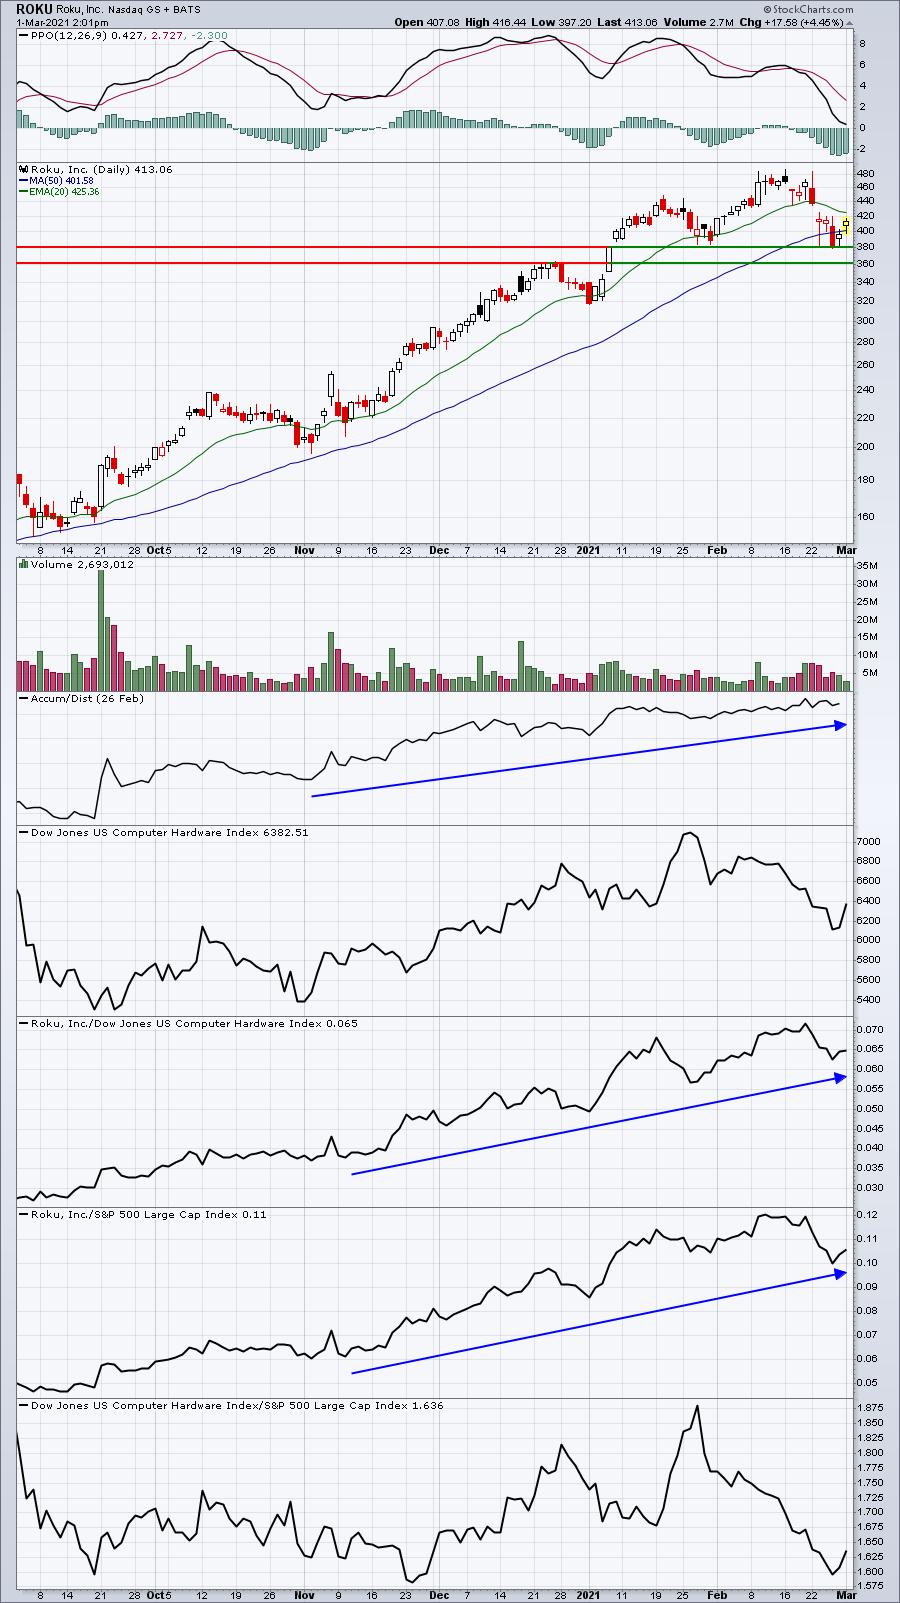
I didn't check all of the above stocks for earnings dates, but I do know that NIO reports today after the bell and FUBO reports tomorrow. I'll ignore those two. The other 4 are very strong stocks with SCTRs at 95 or above and their RSIs are below 40, suggesting some type of pullback recently. Here are their current technical outlooks:
FLGT:
GRWG:
ROKU:
VERI:
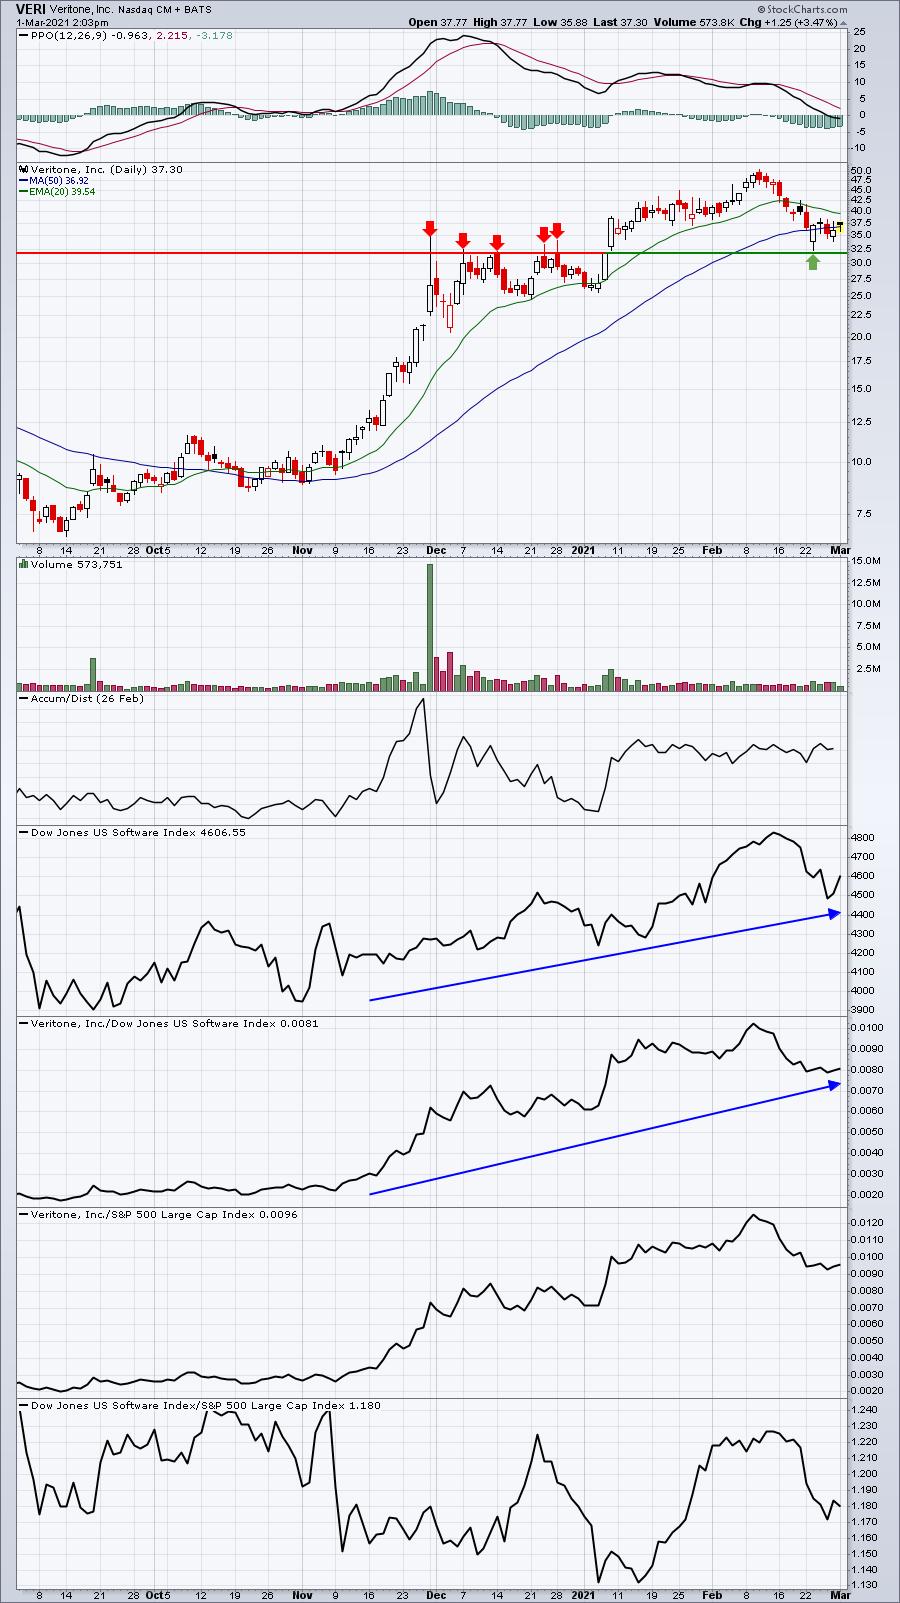
These are all trade candidates worthy of consideration. Many are quite volatile, so please make sure you're comfortable with the extreme movements in both directions. However, by scouring our research (ChartLists) and applying technical analysis scans, you can uncover excellent relative strength stocks that have pulled back. You don't have to chase stocks higher.
Earnings Reports
Here are the key earnings reports for the next two days, featuring stocks with market caps of more than $10 billion. I also include a few select companies with market caps below $10 billion. Finally, any portfolio stocks that will be reporting results are highlighted in BOLD. If you decide to hold a stock into earnings, please understand the significant short-term risk that you are taking. Please be sure to check for earnings dates for any companies you own or are considering owning.
Monday, March 1:
ZM, NIO, FMX, NVAX, XRAY, AI, SRPT, PRGO, BHVN, DDD, SGMS, SWCH, TGNA, CDLX, NSTG, INO, SSYS, WKHS, PGEN, INSG
Tuesday, March 2:
TGT, SE, VEEV, ROST, AZO, HPE, BSY, DAR, KSS, JWN, TGTX, AMBA, URBN, BOX, FUBO, ANF
Economic Reports
February PMI manufacturing: 58.6 (actual) vs. 58.5 (estimate)
February ISM manufacturing: 60.8 (actual) vs. 58.9 (estimate)
January construction spending: +1.7% (actual) vs. +0.8% (estimate)
Happy trading!
Tom