
EB Daily Market Report - Tuesday, March 2, 2021
Executive Market Summary
- Futures were relatively flat as we opened this morning after a volatile overnight session
- Crude oil ($WTIC) is flat today as the 10-year treasury yield ($TNX) falls 3 basis points to 1.41%
- Materials (XLB, +1.29%) and communication services (XLC, +0.44%) lead the action
- Technology (XLK, -0.76%) is again on the wrong side of rotation
- Aluminum ($DJUSAL, +5.80%) and mining ($DJUSMG, +3.88%) are among the best industry performers and helping to lead materials higher
- Renewable energy ($DWCREE, -3.11%) and semiconductors ($DJUSSC, -1.48%) are hurting the technology area
- Zoom Video Communications (ZM, -4.85%) and Target Corp (TGT, -4.25%) are both lower after opening gaps higher following excellent quarterly reports
Market Outlook
I believe it's very important to be a bit more cautious throughout March if your mindset is more of a trader. We've made a big run over the past year and the third month of each calendar quarter tends to be relatively weak. If we look at the S&P 500's seasonality chart on StockCharts.com, here's the breakdown over the past 10 years (bull market years):
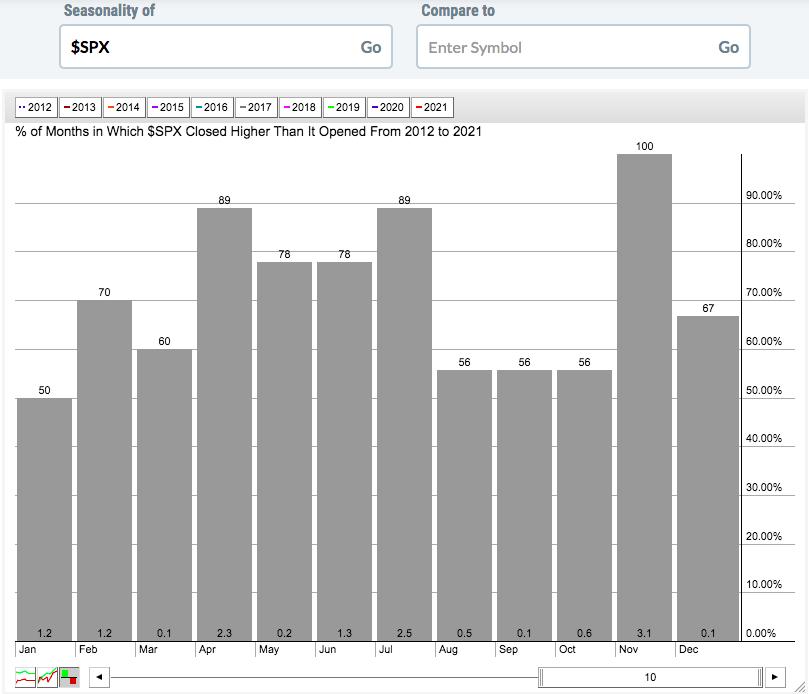
If you go through the exercise of adding up the average monthly returns (numbers at the bottom of each gray-shaded bar), here's the breakdown:
- 1st month of calendar quarter (Jan, Apr, Jul, Oct): +6.6% (annualized +19.8%)
- 2nd month of calendar quarter (Feb, May, Aug, Nov): +5.0% (annualized +15.0%)
- 3rd month of calendar quarter (Mar, Jun, Sep, Dec): +1.6% (annualized +4.8%)
It's a real thing. We get past earnings season and the aggressive sectors tend to weaken and money rotates to defensive temporarily.
Sector/Industry Focus
Continuing the theme from above, let's look at technology (XLK) from a seasonal perspective over the past 10 years:
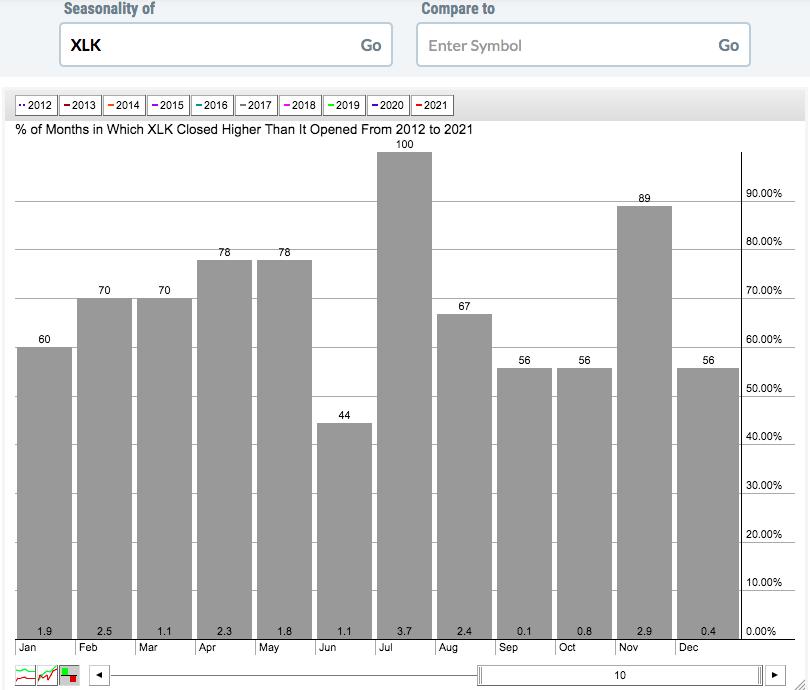
Here's the performance breakdown of the XLK over the past 10 years:
- 1st month of calendar quarter (Jan, Apr, Jul, Oct): +8.7% (annualized +26.1%)
- 2nd month of calendar quarter (Feb, May, Aug, Nov): +9.6% (annualized +28.8%)
- 3rd month of calendar quarter (Mar, Jun, Sep, Dec): +2.7% (annualized +8.1%)
The average return really tails off for this aggressive sector during March, June, September, and December. Keep this in mind as you contemplate your trading strategy this month. For those not really interested in trading, I'd ignore this info.
ChartLists/Strategies
Given the defensive sector relative strength that we typically see during March, I looked across our ChartLists for stocks in health care, consumer staples, utilities, and real estate that have SCTRs above 95. Here was the scan syntax that I used:
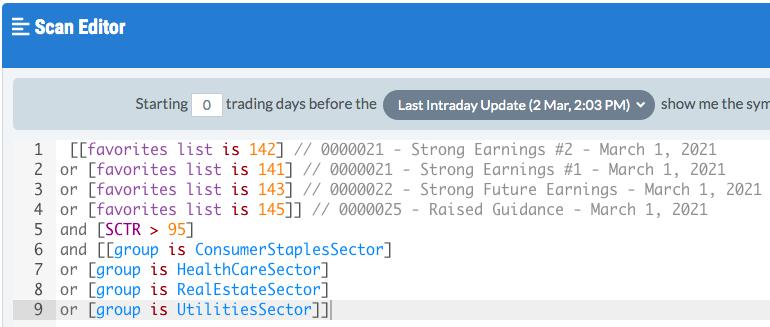
There were 31 results. Here are the Top 15 SCTRs on that list of 31:
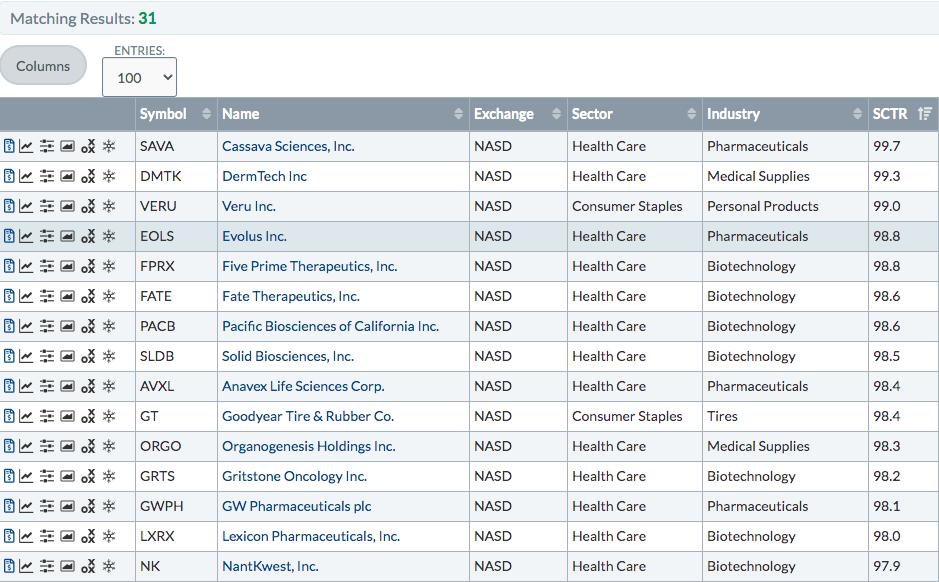
Here are 3 of the above stocks that look interesting to me:
VERU:
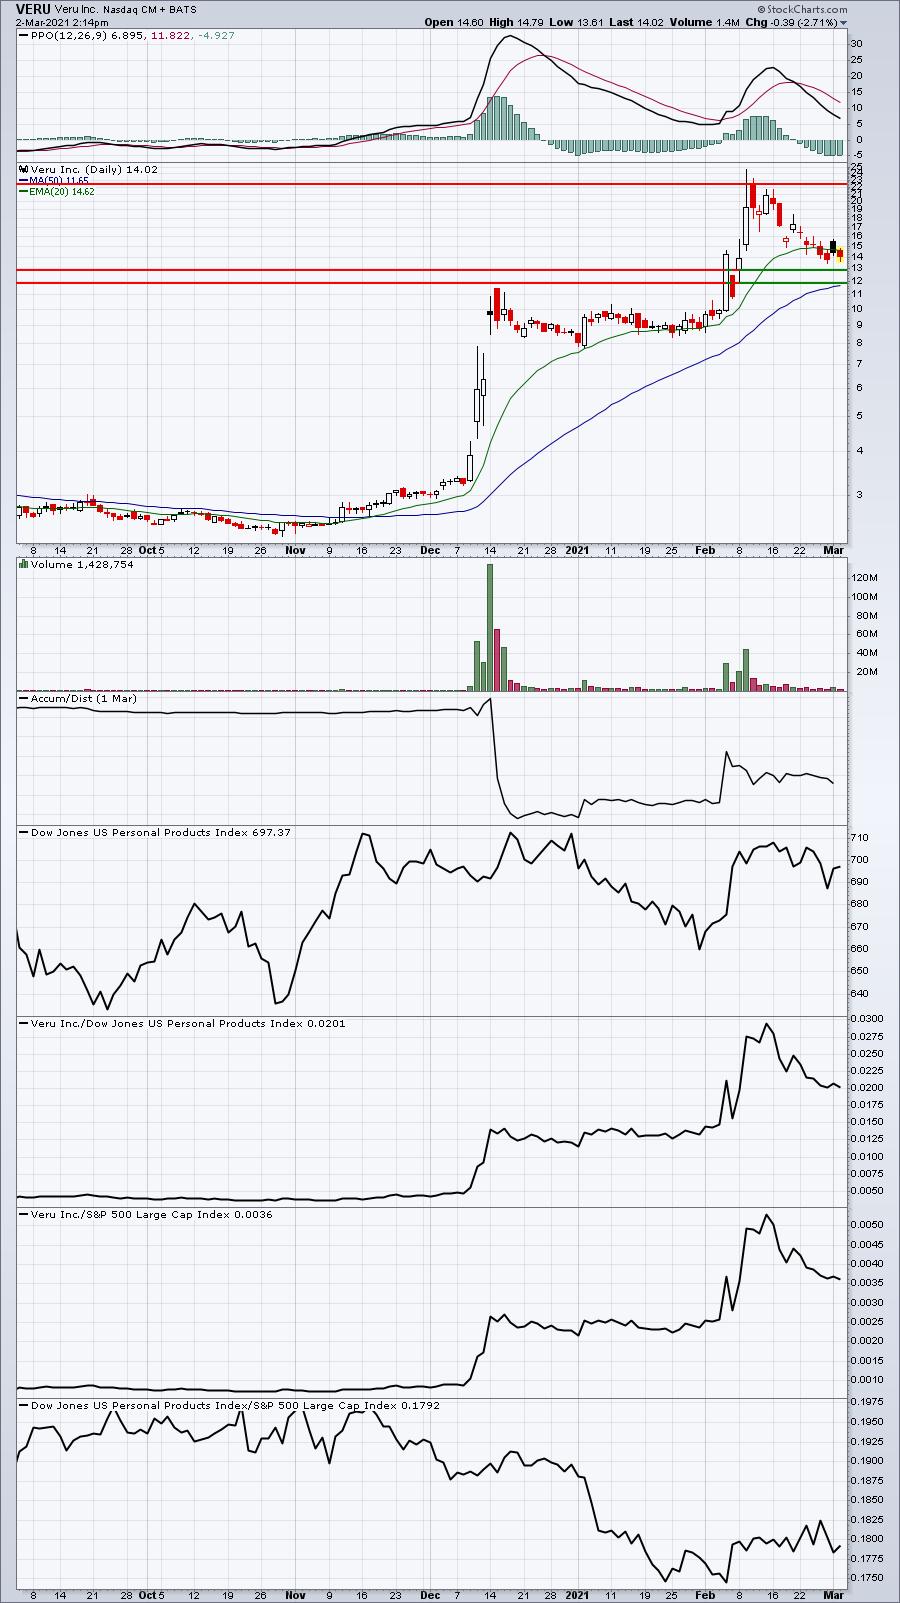
The closer that VERU gets to the support zone between 12-13, the more I like it. It has already filled a couple gaps, but that 12-13 range would be very interesting. To the upside, key price resistance now resides close to 22.50. VERU is quite volatile and risky, but the reward to risk looks solid here - even at its current price.
GRTS:
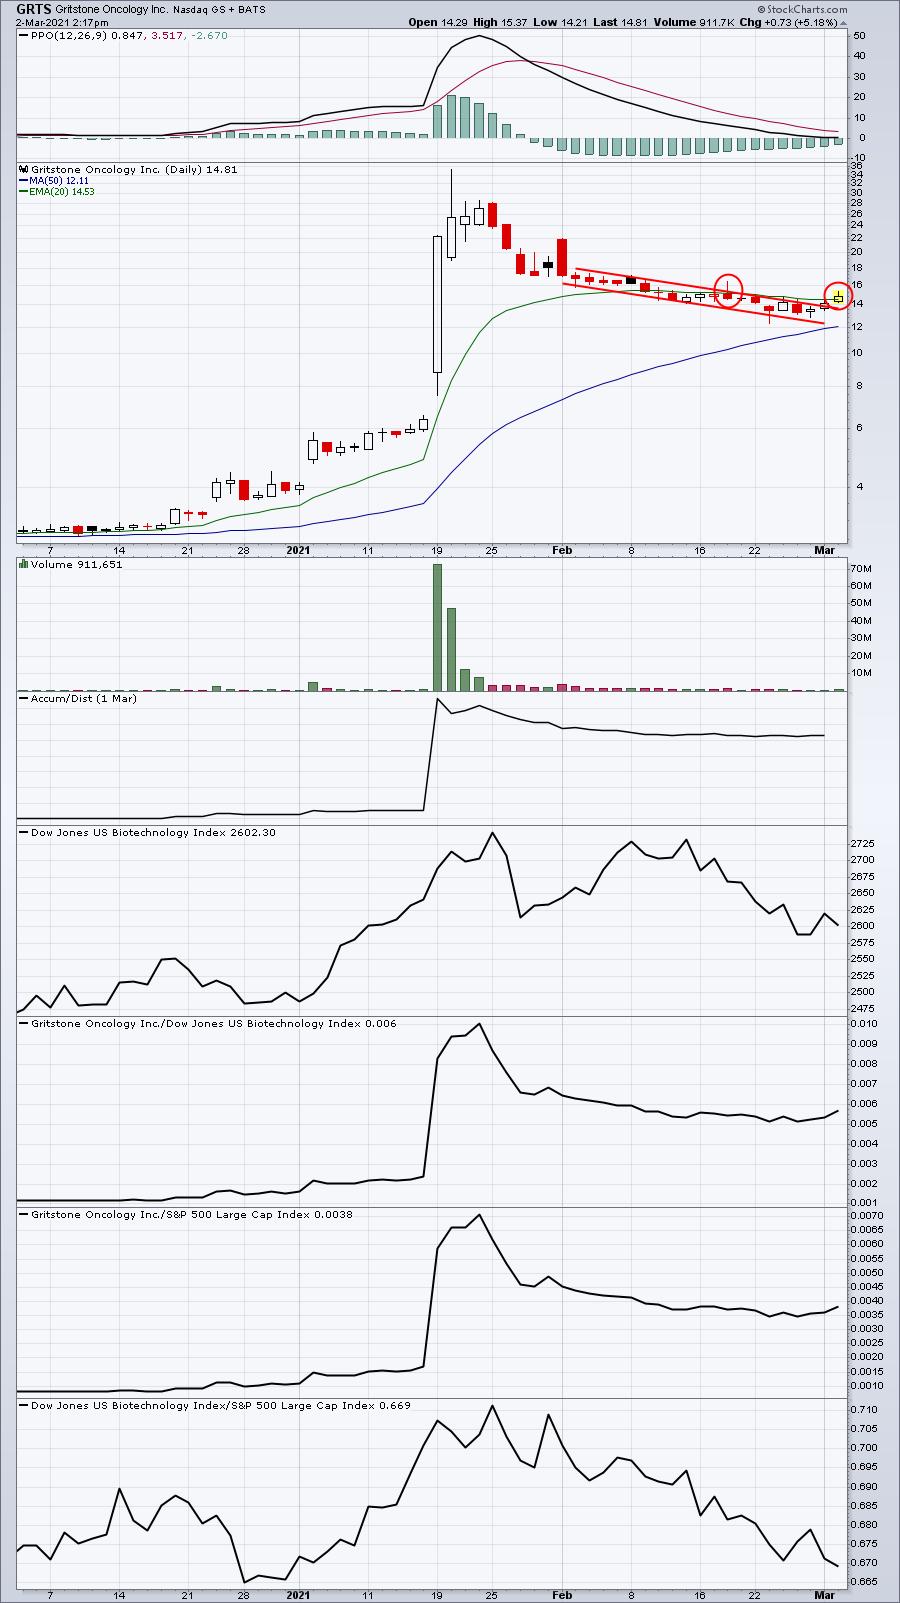
This is another risky trade, but it's got the potential to deliver hefty gains. The month-long downtrend appears to be broken, but we've already seen one false break above the declining 20-day EMA and today could mark the second (red circles). A close above the 20-day EMA, however, would be perhaps the start of another uptrend.
NK:
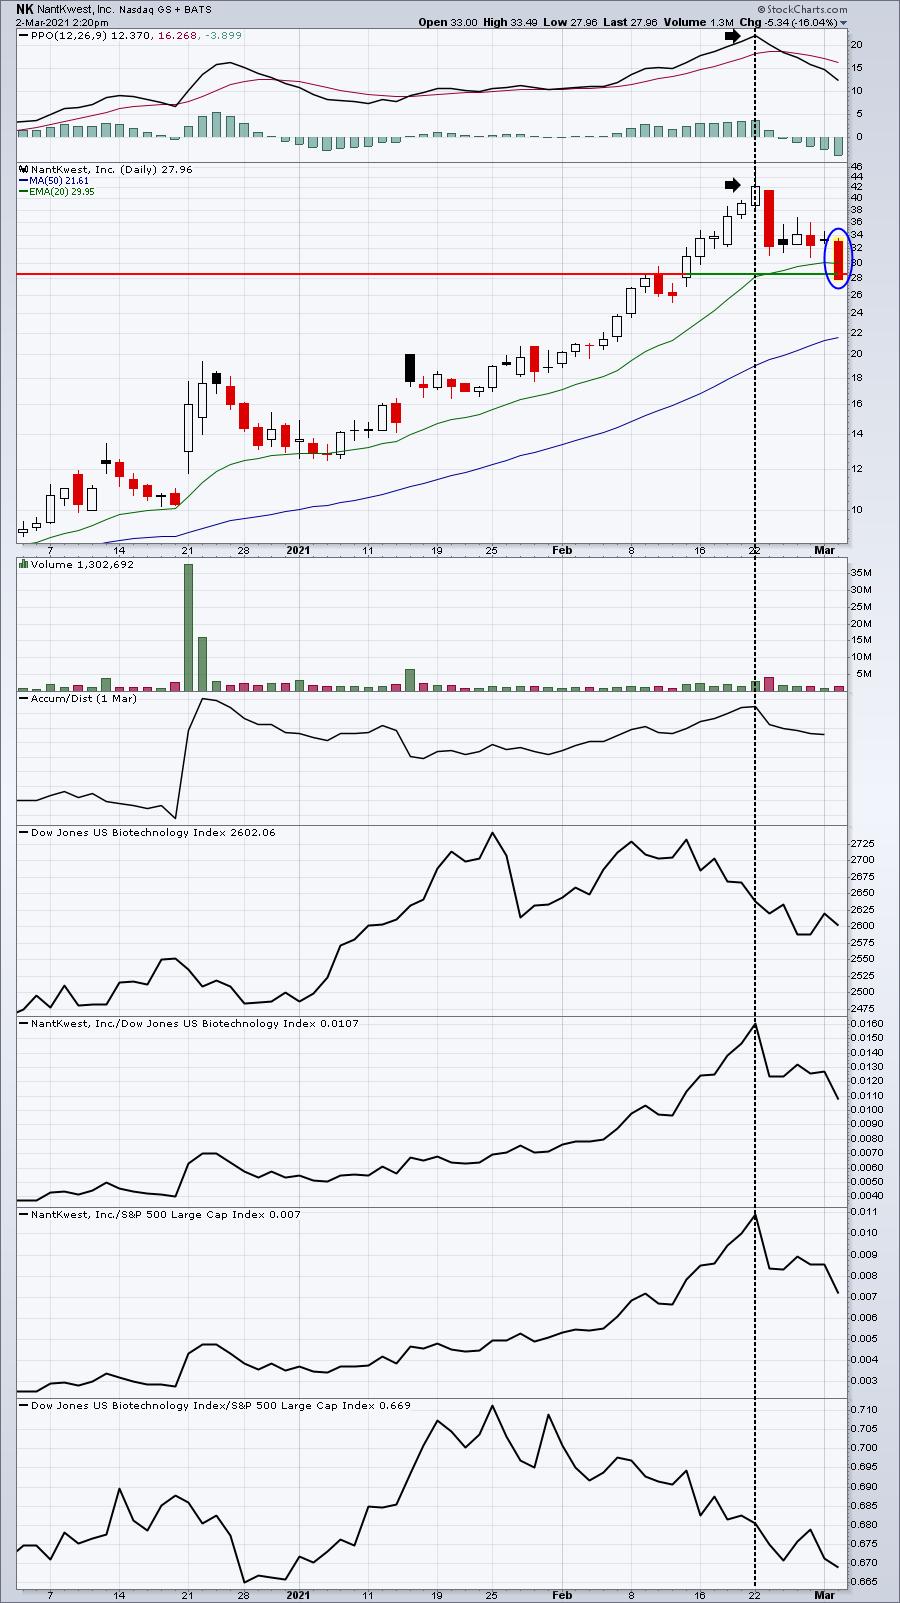
The vertical black-dotted line shows that the PPO was at a high when price was also at a high. Typically, when this occurs, the rising 20-day EMA provides big support. Today, NK has pulled back to test price support and a close back above the 20-day EMA would be a bullish short-term development, in my opinion. If that happens, 36 (recent price highs) would be initial price resistance, followed by the February high close to 42.
Earnings Reports
Here are the key earnings reports for the next two days, featuring stocks with market caps of more than $10 billion. I also include a few select companies with market caps below $10 billion. Finally, any portfolio stocks that will be reporting results are highlighted in BOLD. If you decide to hold a stock into earnings, please understand the significant short-term risk that you are taking. Please be sure to check for earnings dates for any companies you own or are considering owning.
Tuesday, March 2:
TGT, SE, VEEV, ROST, AZO, HPE, BSY, DAR, KSS, JWN, TGTX, AMBA, URBN, BOX, FUBO, ANF
Wednesday, March 3:
SNOW, BF/B, OKTA, MRVL, TCOM, SPLK, DLTR, SQM, VRM, WEN, AEO, PDCO, YEXT, EQX
Economic Reports
None
Happy trading!
Tom