
EB Daily Market Report - Wednesday, March 3, 2021
Executive Market Summary
- Futures were weak as we opened for trading this morning
- Action since then has been very bifurcated with the growth-oriented NASDAQ lagging significantly
- The IWF:IWD (growth vs. value) ratio has moved to its lowest level since June as market rotation away from growth and into value continues
- Gold ($GOLD, -1.11%) moves to a 9-month low; even increasing fear levels are not helping gold right now
- Crude oil ($WTIC, +2.43%), on the other hand, is back in the spotlight
- Energy (XLE, +2.54%) and financials (XLF, +1.69%) are leading today, while technology (XLK, -2.09%) and consumer discretionary (XLY, -1.53%) once again lag
- Home construction ($DJUSHB, -2.83%) are among the lagging industries as the rising 10-year treasury yields ($TNX) have these stocks on the defensive
Market Outlook
The rotation away from technology (XLK), consumer discretionary (XLY), and growth (IWF) in general can be seen in the recent underperformance of NASDAQ shares. Now that we apparently are seeing the second important top in the NASDAQ, I believe we can now use this new channel information to construct what the upcoming few months may look like and where the current bleeding can be expected to end (if we break below key support near 13000):
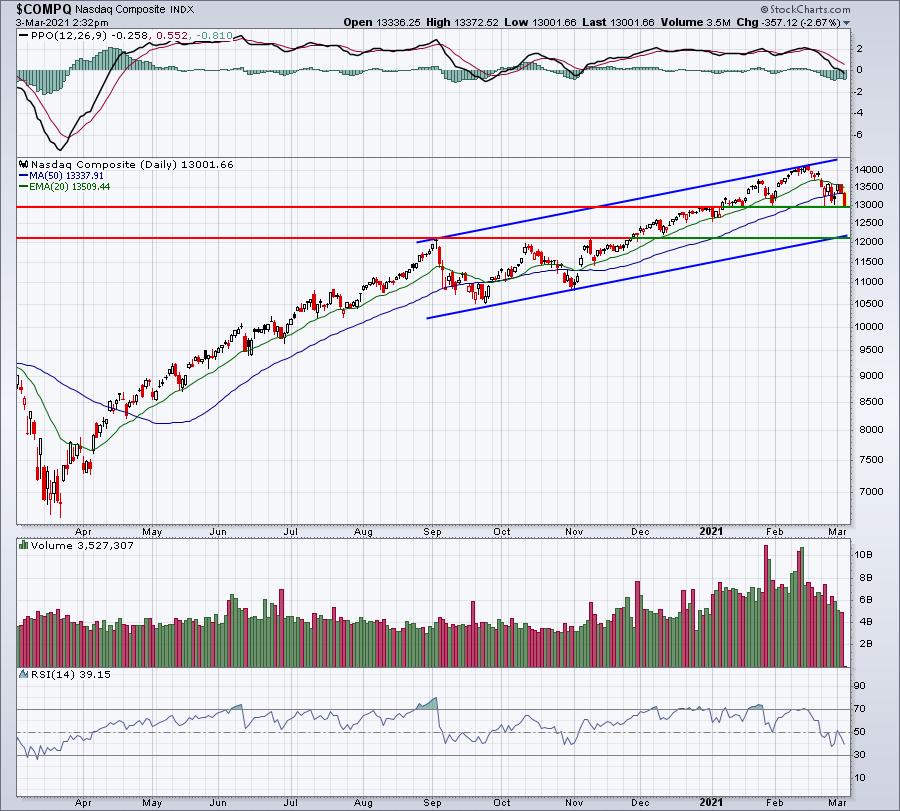
The previous channel's slope was unsustainable. It's unrealistic to expect our equity markets to gain on a percentage basis over the next year what we saw over the last year. You have to keep in mind we were working off of panic-induced lows. But by connecting the September top with the February top, we have an upper trendline. I've dragged that same slope to until it connected with the late-October low and that brings the current lower trendline to about 12,000 right now, which is also close to that previous September high. So if we lose 13,000 support which, barring a final hour recovery, it looks like we will, then I believe we have another 1,000 point downside that we could have to deal with during March. I hope we don't have to deal with it, but I think it's important to at least consider that possibility.
UPDATE: Before sending out this DMR, I checked and the NASDAQ has bounced 85 points since I attached the above chart around 2:30 ET or so. So perhaps we can get a rally and avoid the 13000 breakdown for now. Watch this into the close today and throughout the balance of the week.
Sector/Industry Focus
Software stocks ($DJUSSW, -3.01%) are taking a big hit today overall and there is technical evidence to suggest we could be in for more selling, especially if we lose 20-week EMA support his week. There's been a negative divergence in place for several months. If we close beneath that 20-week EMA this week, a 50-week SMA test and PPO centerline "reset" could be next. That could potentially be another 8-10% lower. Here's the current weekly chart:
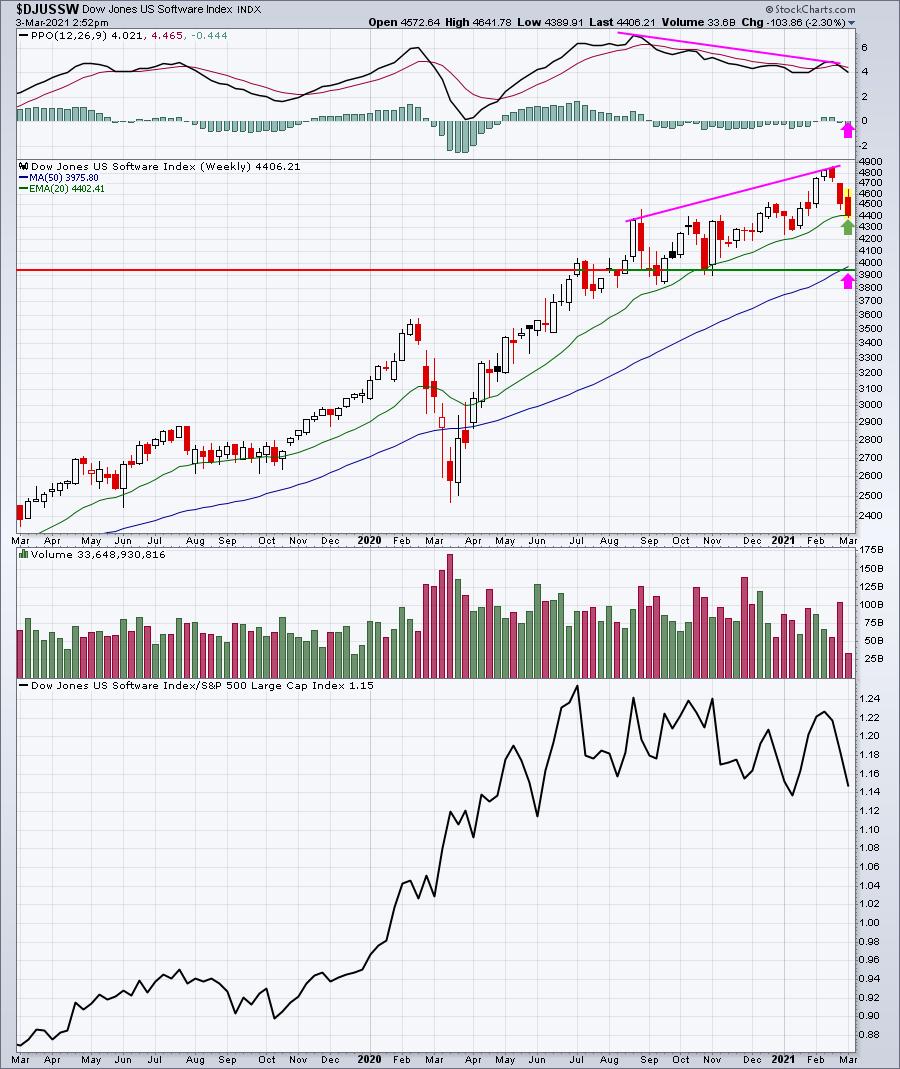
So the big question here is......do we hold the 20-week EMA (green arrow) later this week? Trading beneath it intraweek isn't a big deal, but closing below it can definitely lead to more selling, especially when a negative divergence is present. That negative divergence has been in play a long, long time, but historical relative weakness in March could present one problem too many for the group. If that 20-week EMA support is lost, then those pink arrows potentially come into play.
ChartLists/Strategies
When the market turns more volatile and we see our leaders underperforming, namely technology and consumer discretionary, I tend to grow much more cautious in my trading. That means (1) I tend to trade smaller position sizes, and (2) I make sure I only enter if I can keep a tight stop in place. In other words, I try to exercise a lot of patience before pulling the trigger. During today's selling, I did buy the following 3 positions. These stocks may not be appropriate for others as they can be quite volatile, but I'll give you my rationale for each trade. By the way, if the market weakens into the close, it's possible these trades stop out and I move right back into cash. Here are the charts:
BILL:
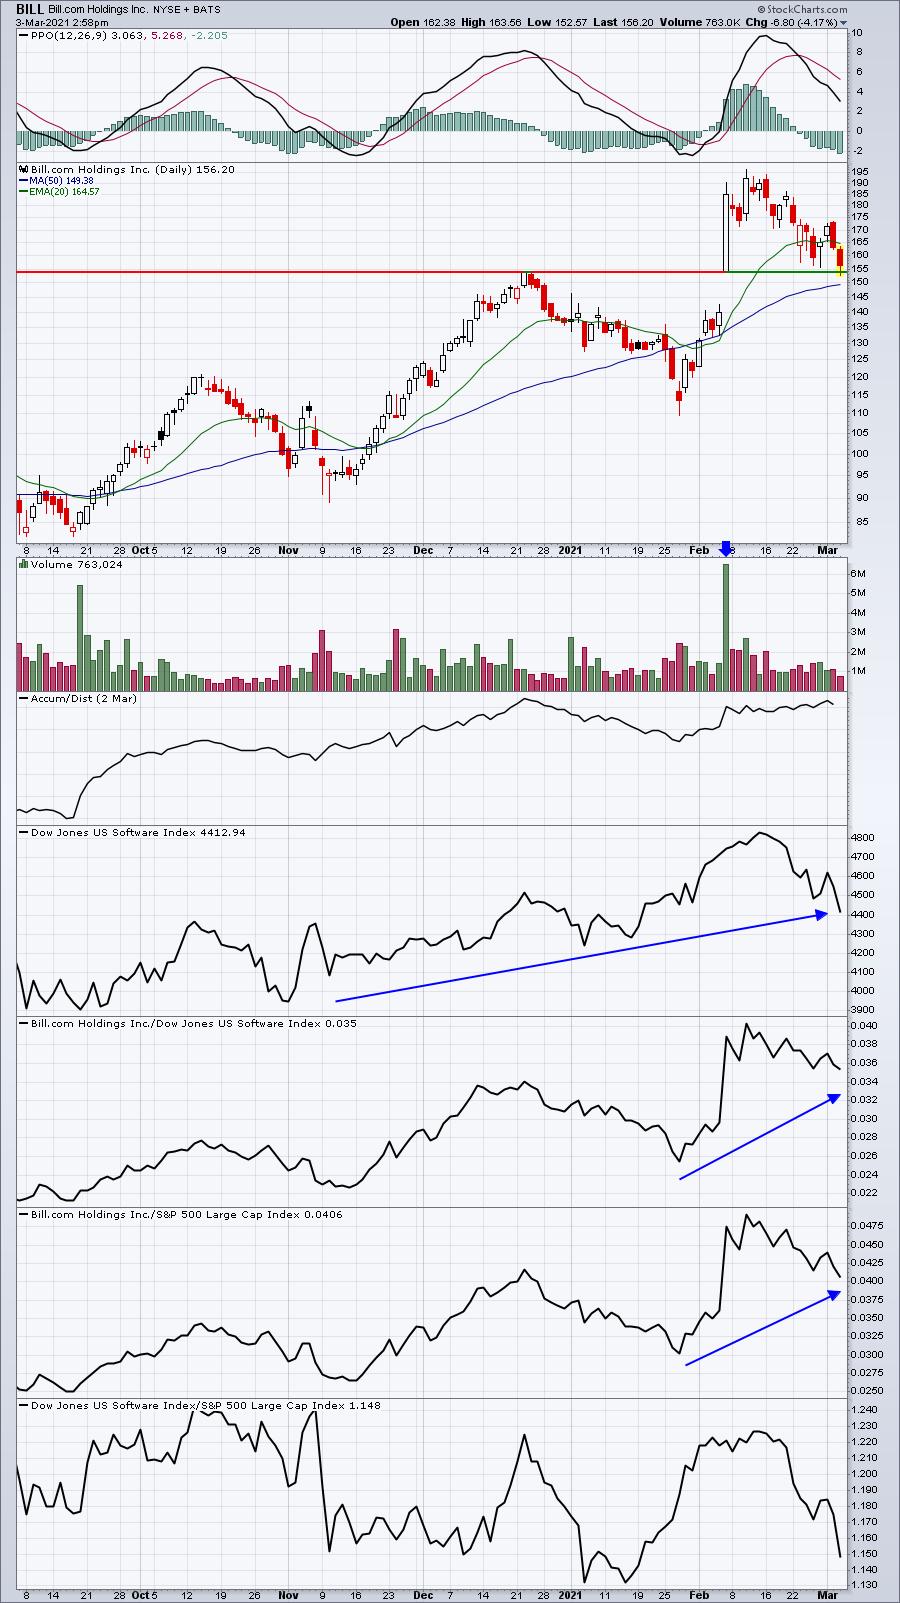
Perhaps the most important thing here is that BILL is a leader in software. Based on what I wrote above about software, I only want to consider trading the BEST of the software stocks. BILL fits the "bill". Also, I love buying stocks at the TOP of gap support when they print a very bullish hollow candle on massive volume like BILL did back in early February. That AD line is also very strong, despite all of the selling. Now that it's trading back above that gap support, I'll exit if today's low is violated.
COHU:
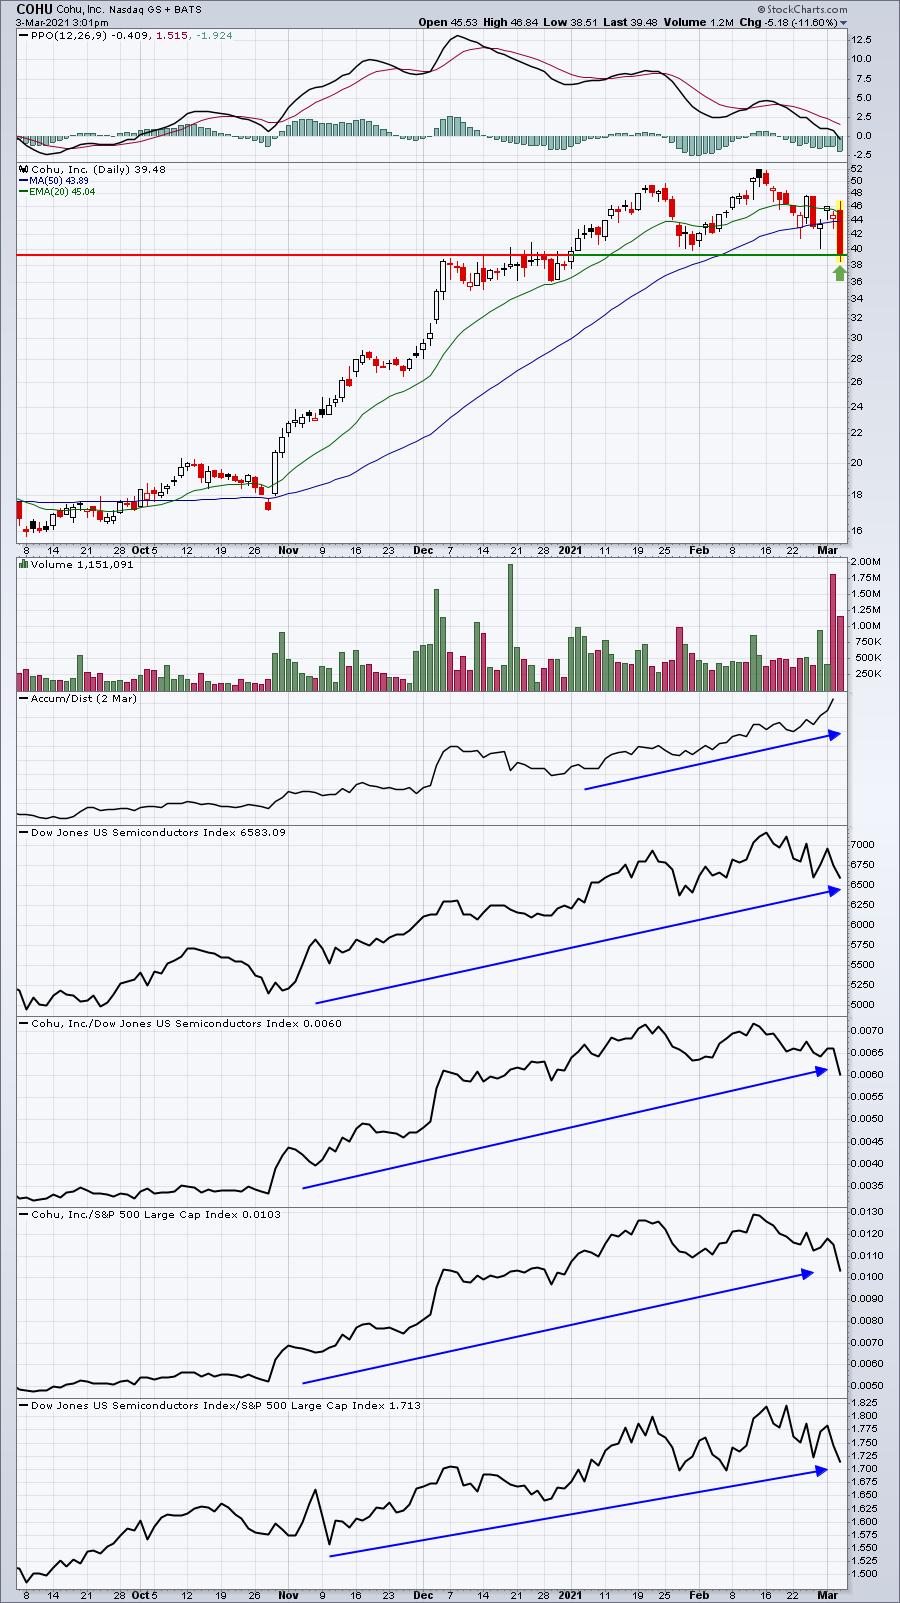
COHU is a leader in semiconductors ($DJUSSC) and its AD line is incredibly strong, despite the recent selling. I see key price support here as the level where we broke out in January, or 39.38. We moved beneath that level intraday, but have recovered back above it. I've placed a stop beneath today's intraday low to help minimize any loss.
ILMN:
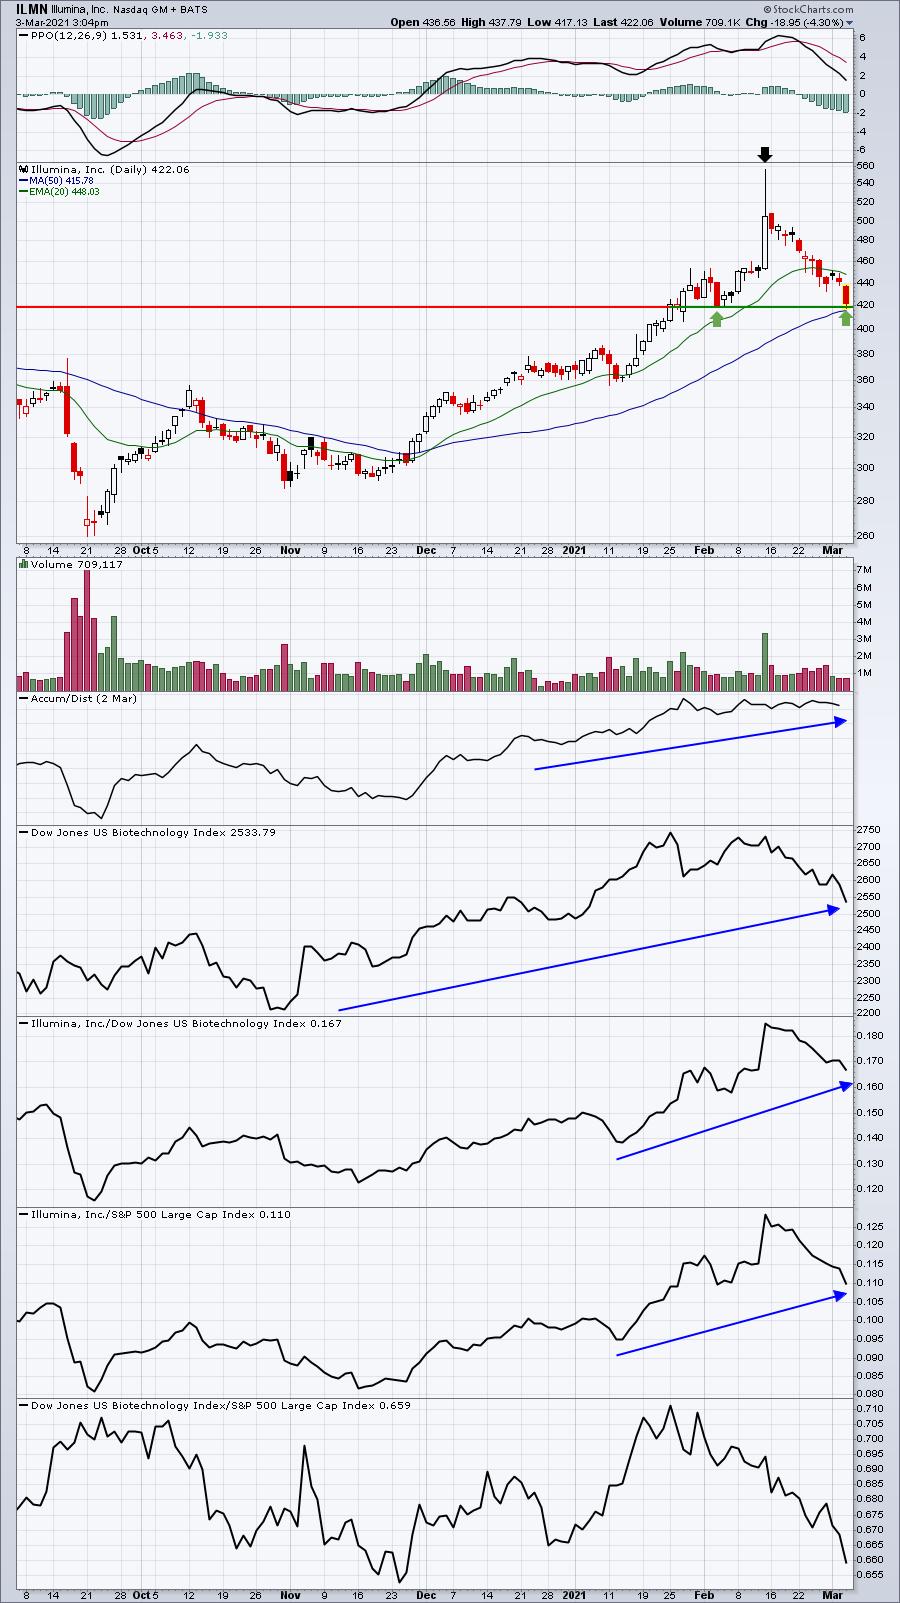
ILMN is in health care, which avoids technology. This is another with a very strong AD line and we're testing both recent price support and the 50 day SMA. A close beneath this combination of support would trigger a sell on my part.
Earnings Reports
Here are the key earnings reports for the next two days, featuring stocks with market caps of more than $10 billion. I also include a few select companies with market caps below $10 billion. Finally, any portfolio stocks that will be reporting results are highlighted in BOLD. If you decide to hold a stock into earnings, please understand the significant short-term risk that you are taking. Please be sure to check for earnings dates for any companies you own or are considering owning.
Wednesday, March 3:
SNOW, BF/B, OKTA, MRVL, TCOM, SPLK, DLTR, SQM, VRM, WEN, AEO, PDCO, YEXT, EQX
Thursday, March 4:
AVGO, COST, KR, WORK, COO, BURL, ARGX, TTC, GWRE, GPS, CIEN, SDGR, BJ, SDC, FLGT, MIK, PRPL, VERI
Economic Reports
February ADP employment report: 117,000 (actual) vs. 165,000 (estimate)
February PMI composite: 59.5 (actual) vs. 58.8 (estimate)
February ISM services: 55.3 (actual) vs. 58.7 (estimate)
Happy trading!
Tom