
EB Daily Market Report - Thursday, March 4, 2021
Executive Market Summary
- Futures were mostly flat at the open, but selling quickly intensified again, especially on the NASDAQ
- Growth stocks (IWF) remain under intense absolute and relative selling pressure
- The 10-year treasury yield ($TNX) is up 9 basis points to 1.56% at last check
- While gold ($GOLD, -1.24%) falls beneath $1700 per ounce, crude oil ($WTIC, +4.03%) is jumping to nearly $64 per barrel
- Fed Reserve Chair Jerome Powell said earlier today that he expects any inflationary pressures to be short-term in nature and is unlikely to cause the Fed to hike rates
- Tomorrow is another big jobs report and one that could have a significant short-term effect on equities
- Economic reports this morning, especially strong factory orders, suggest continuing economic improvement
- I'm watching the finish today very, very closely; a strong finish could signal a bottom, while the alternative could lead to more selling after Friday's jobs report
- Energy (XLE, +1.36%) and utilities (XLU, +0.26%) are today's only sectors in positive territory
- Consumer discretionary (XLY, -2.51%) headlines the weakness
Market Outlook
Have you ever heard me refer to the market makers "being on vacation"? Well, if you haven't, this is what it looks like. Volume accelerates, selling intensifies, and those "liquidity providers" are nowhere to be found. They wait....and wait....and wait. When the selling exhausts itself, institutional market makers step in and gladly pick up everyone's shares on the way back up. We see it over and over and over again, yet it's still incredibly unnerving when it happens.
Institutions are FLUSH with cash right now, having sold BILLIONS of dollars worth of treasuries recently. That money will eventually be put to work in equities, but why not wait until individual traders throw in the towel, offering shares at heavily-discounted prices? That's what's unfolding right now, in my view. The NASDAQ lost 13000 support on the close yesterday and we've seen selling intensify as the "C" in "A-B-C correction" plays out:
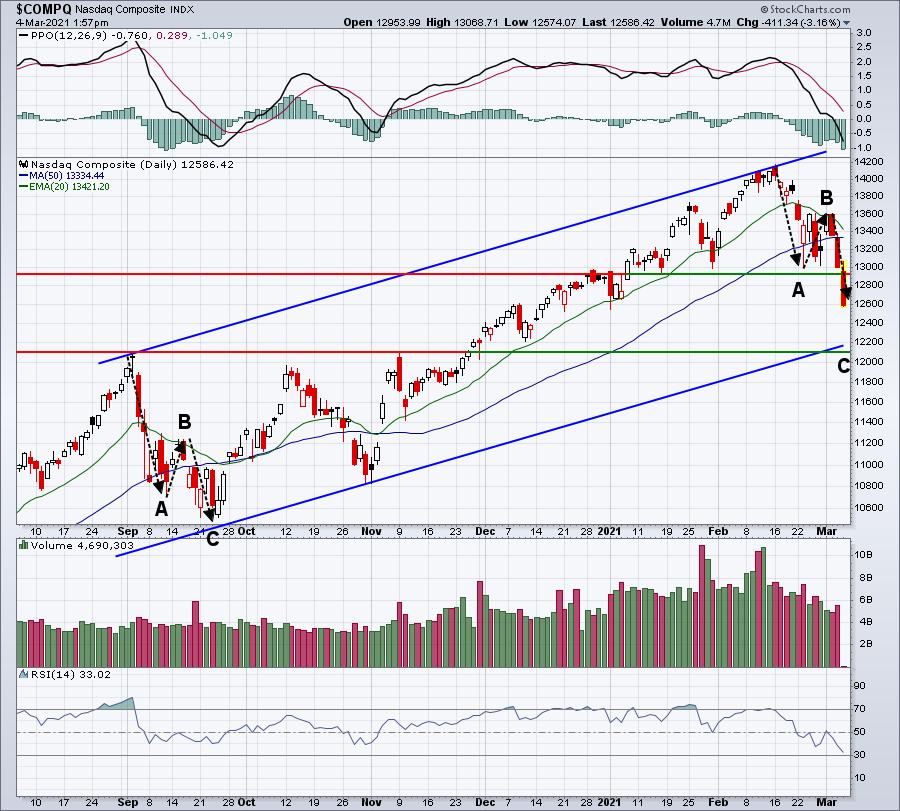
The difficult part is always calling the bottom. Many times it occurs with a significant afternoon rally. Note that the past two trading days, we've close on the days' price lows. That typically does not mark a bottom. I believe we're getting close to a bottom. If we don't rally significantly this afternoon into the close, expect more weakness with the jobs report and then perhaps a big reversal. We've now lost 8% or so on the QQQ in a little more than 48 hours. But when market makers aren't buying, prices decrease rapidly.
Sector/Industry Focus
I try to be as objective as possible when I assess the stock market. Short-term, I believe selling is possible any time. Sometimes we'll get some advanced notice and clues, other times not so much. As I look at the current selling, I still see incredibly bullish signals such as the long-term uptrend in the XLY:XLP and $TRAN:$UTIL. I also know that short-term spikes in treasury yields tend to be extremely bullish for equities as cash rotates from one asset class (bonds) to another (stocks). I track earnings reports as close as anyone and we now have a record number of companies on our Strong Earnings ChartList (SECL) - 526. We had to create a second ChartList for the first time ever. Many of these earnings beats were by a MILE, not even close to estimates. Earnings growth is accelerating in a near-record low interest rate environment. All of these signals tell me to stay the course and ignore, as best we can, the short-term carnage taking place around us. Another very solid message being sent is the dollar rising to a 3-month high. I've discussed that U.S. yields are rising faster than Germany's, a signal of economic strength here. This typically leads to the dollar's strength, or "the dog wagging the tail." I've indicated that we should begin to see dollar strength in 2021 and we're now seeing it.
Ultimately, all of this is going to lead to higher U.S. equities, in my opinion, of course. But we will never move higher without pauses. There's always a reason to pause and now the hype is all about rising interest rates. Whatever. I believe institutions are prepping to put A TON of cash to work in U.S. equities and they're licking their collective chops as prices fall into their laps. Unfortunately, this is how the game is played ALL THE TIME. It's not fair to the individual investor as he/she must navigate all the disinformation in the media and try to keep his/her emotions in check. I've been doing this for years and I still have trouble remaining completely neutral when the heavy selling kicks in.
ChartLists/Strategies
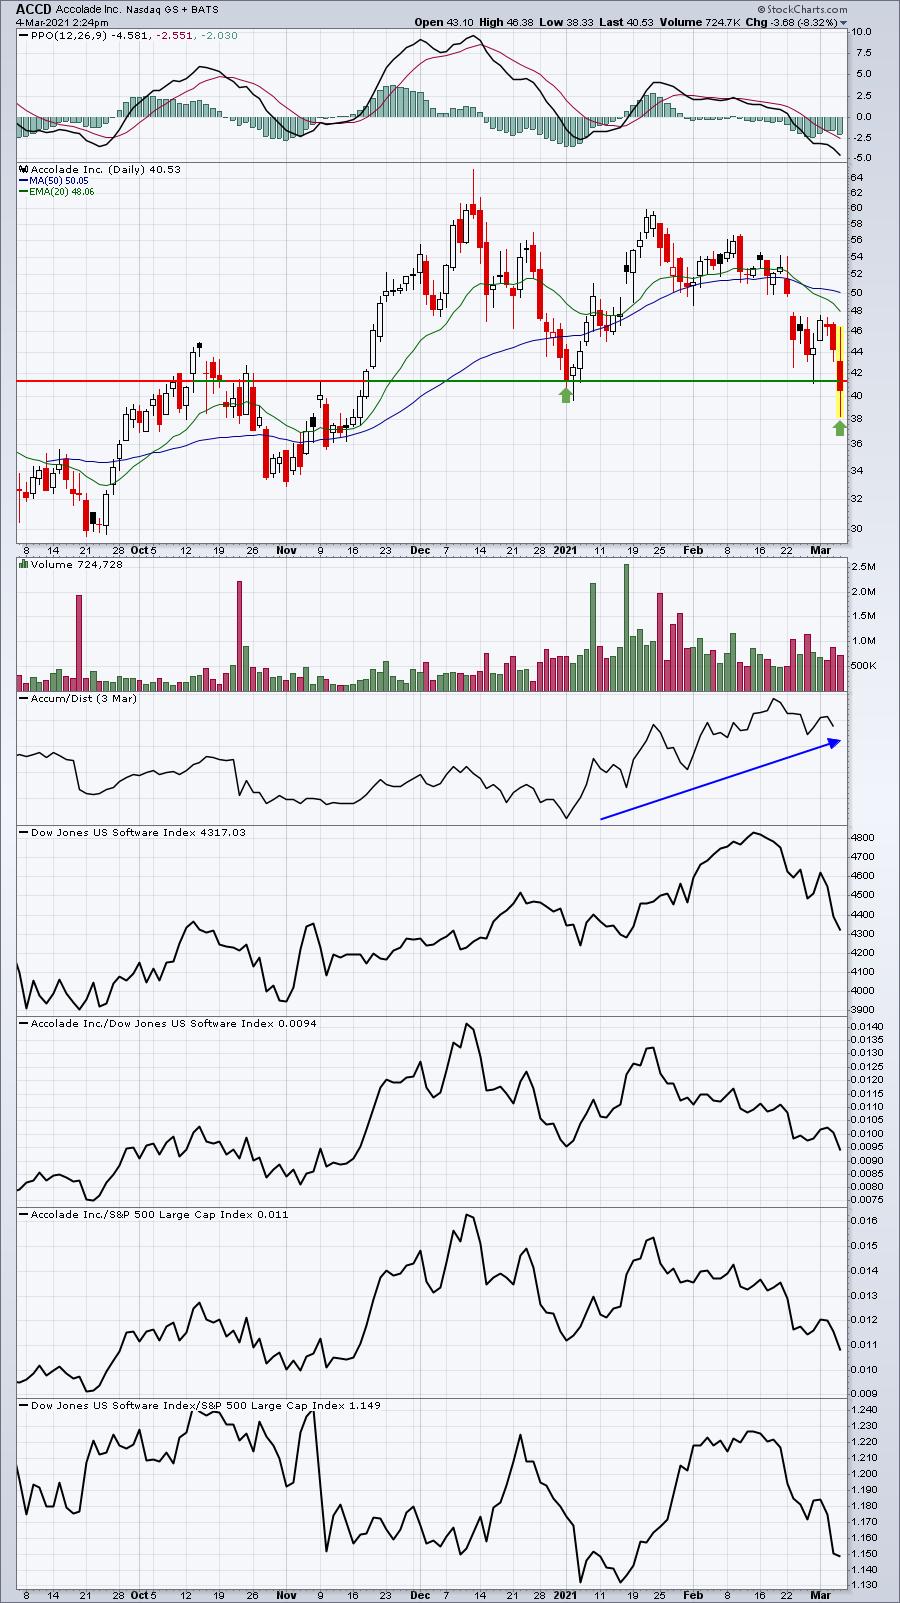
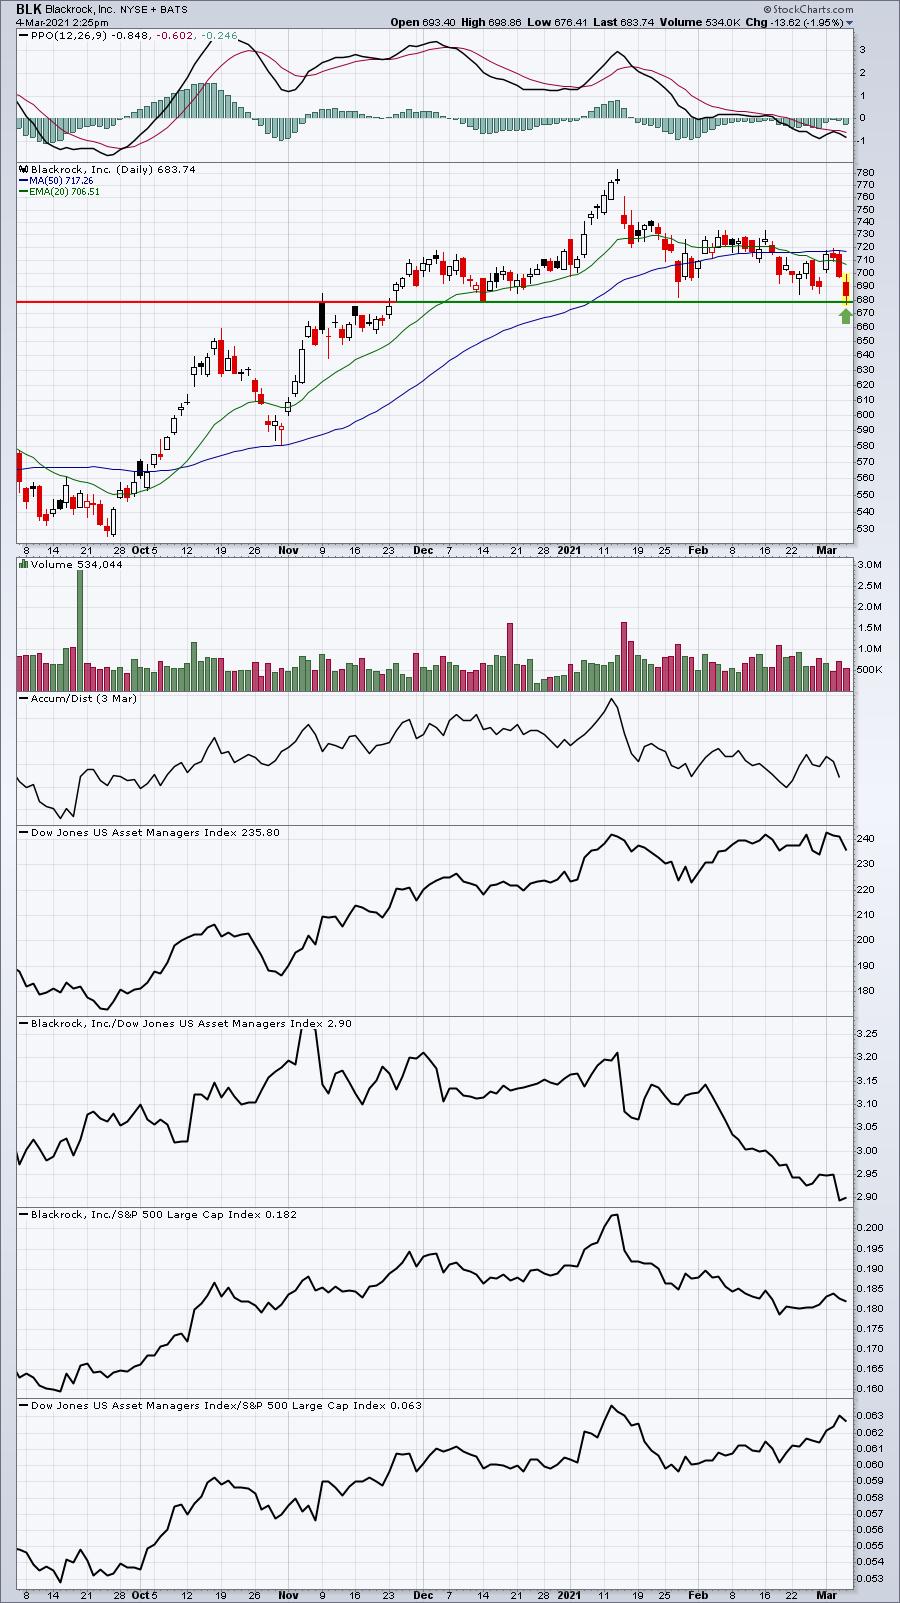
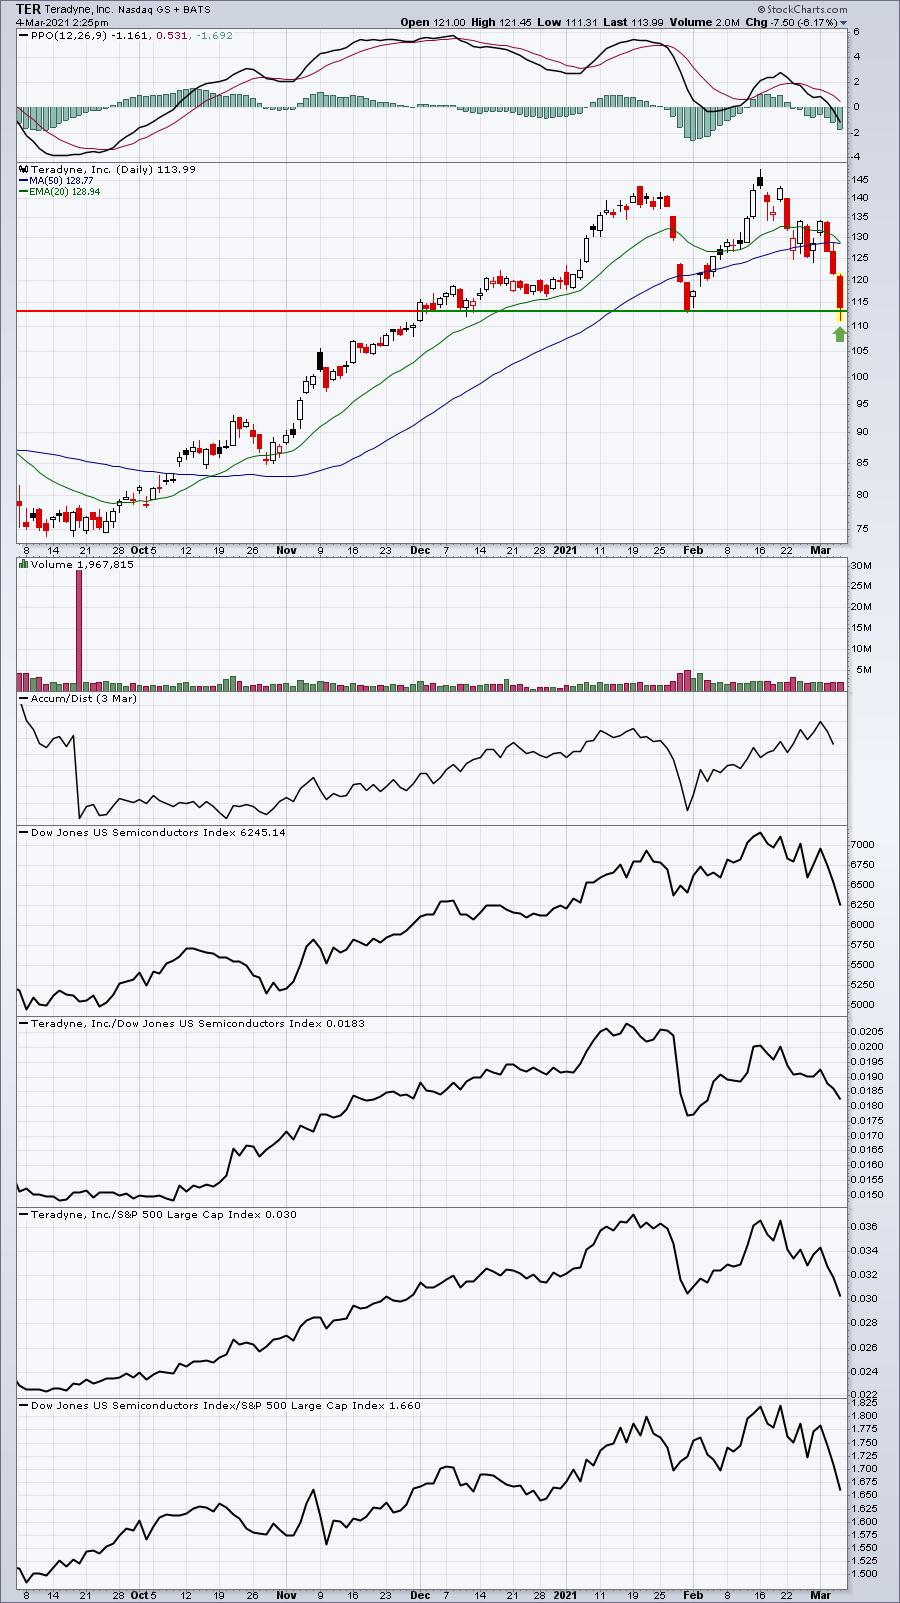
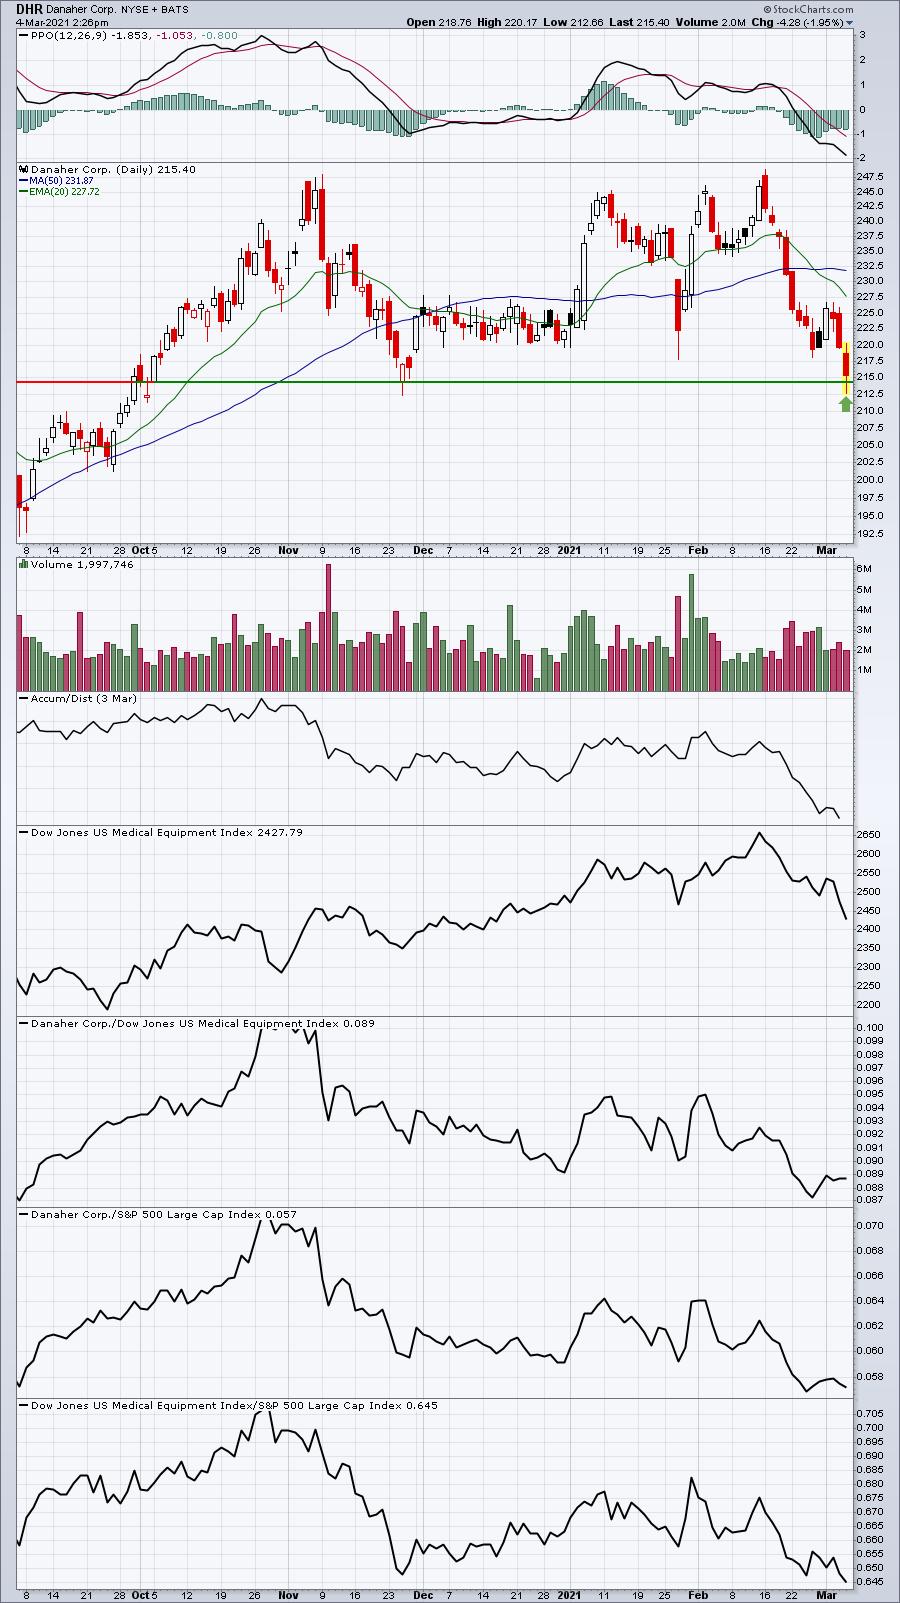
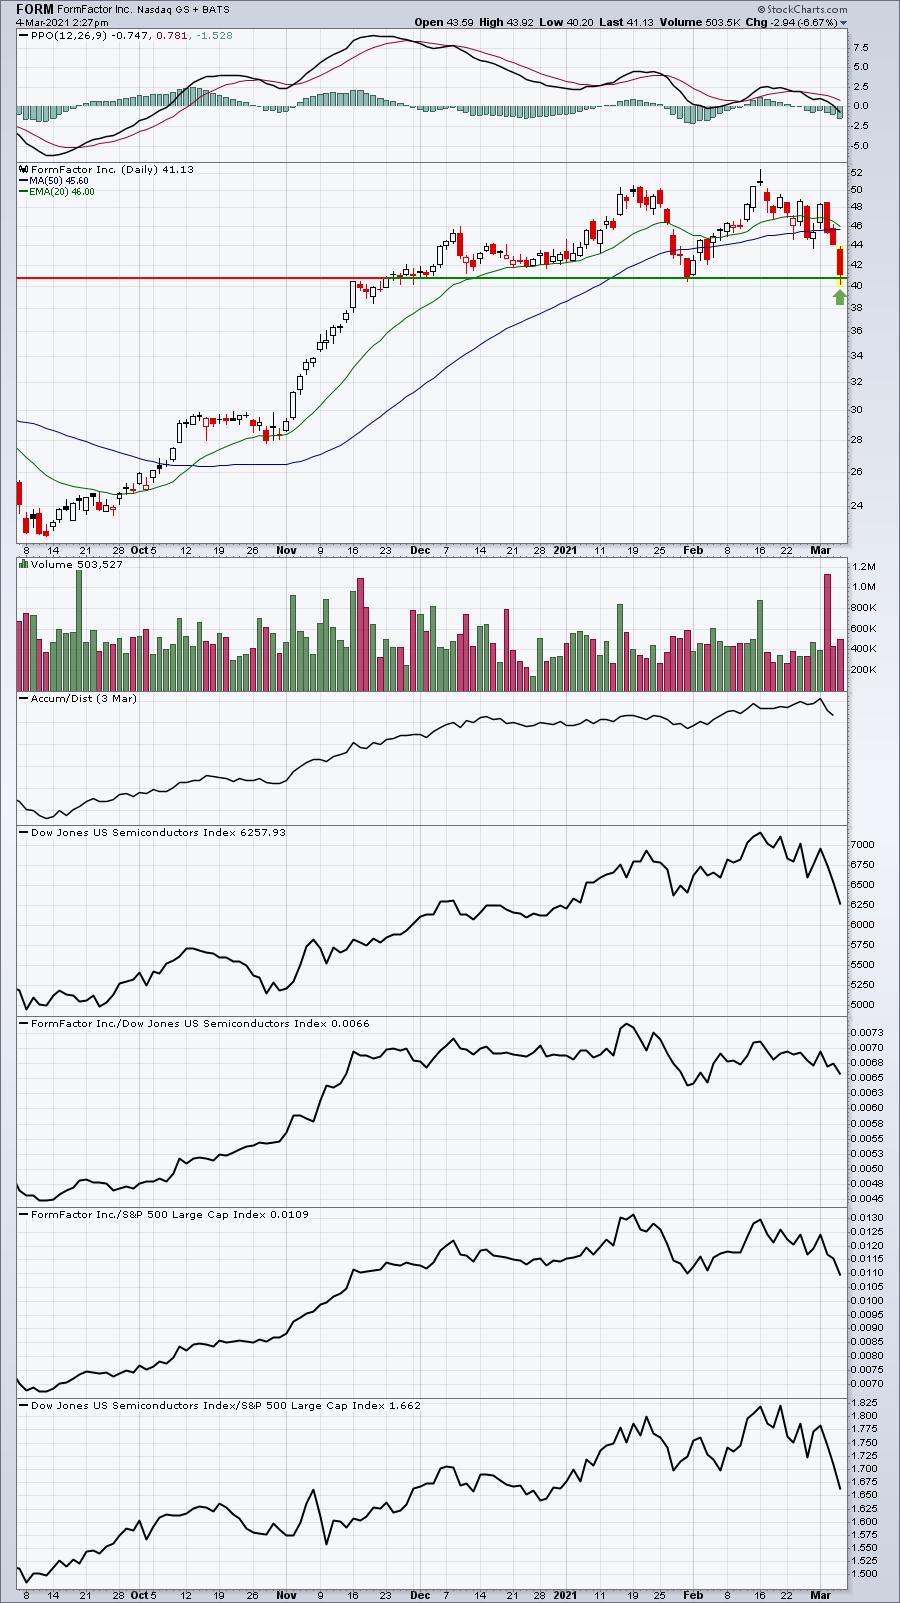
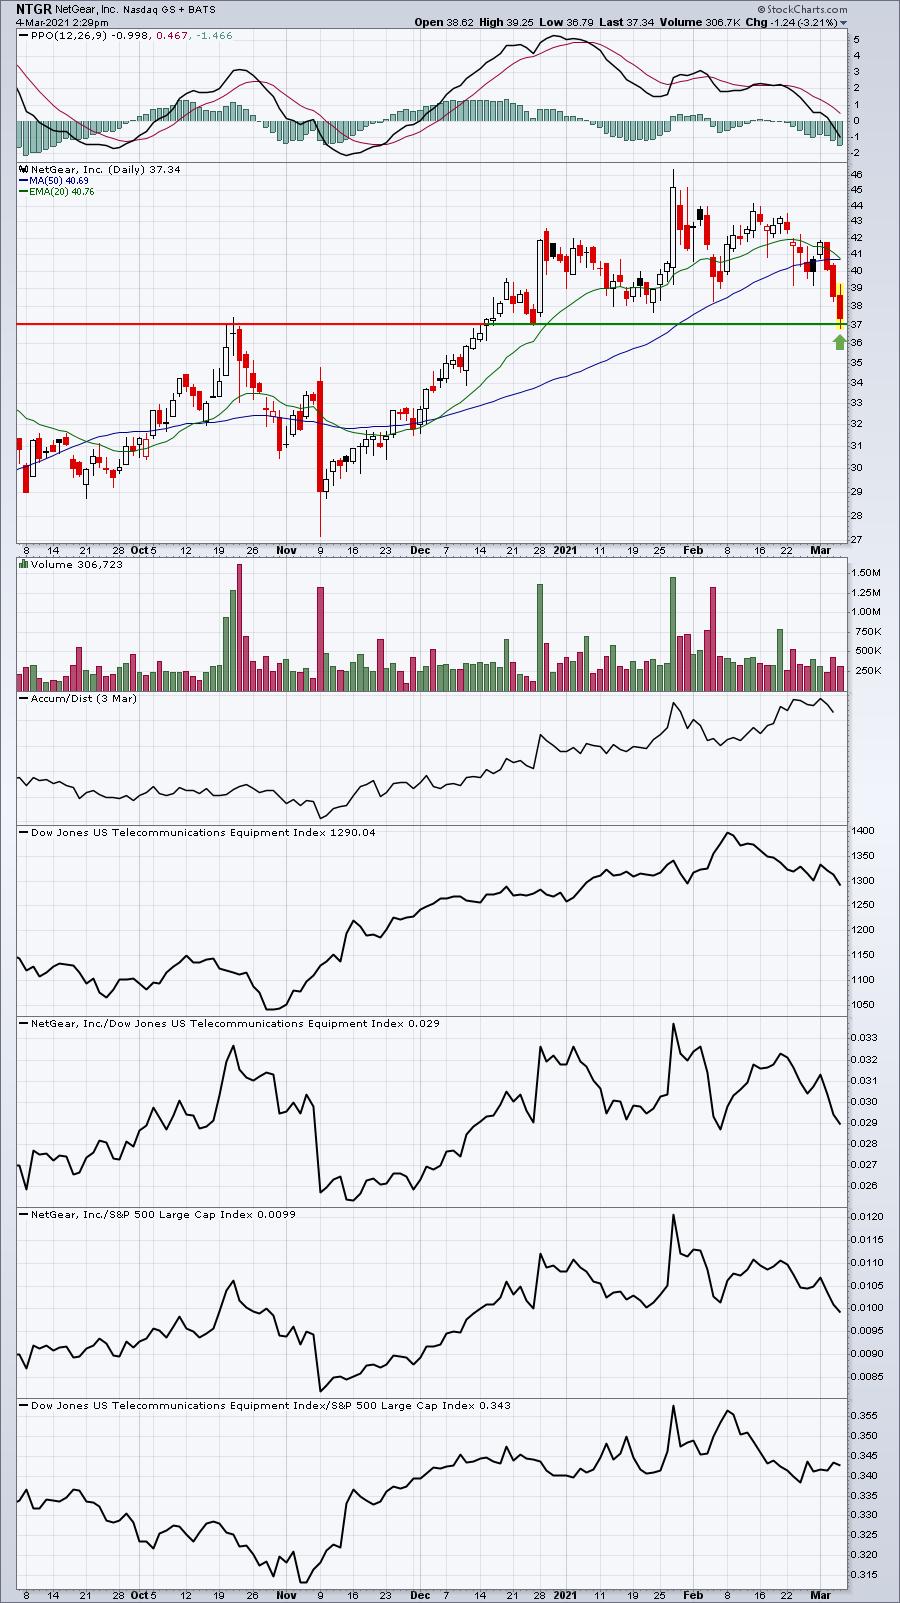
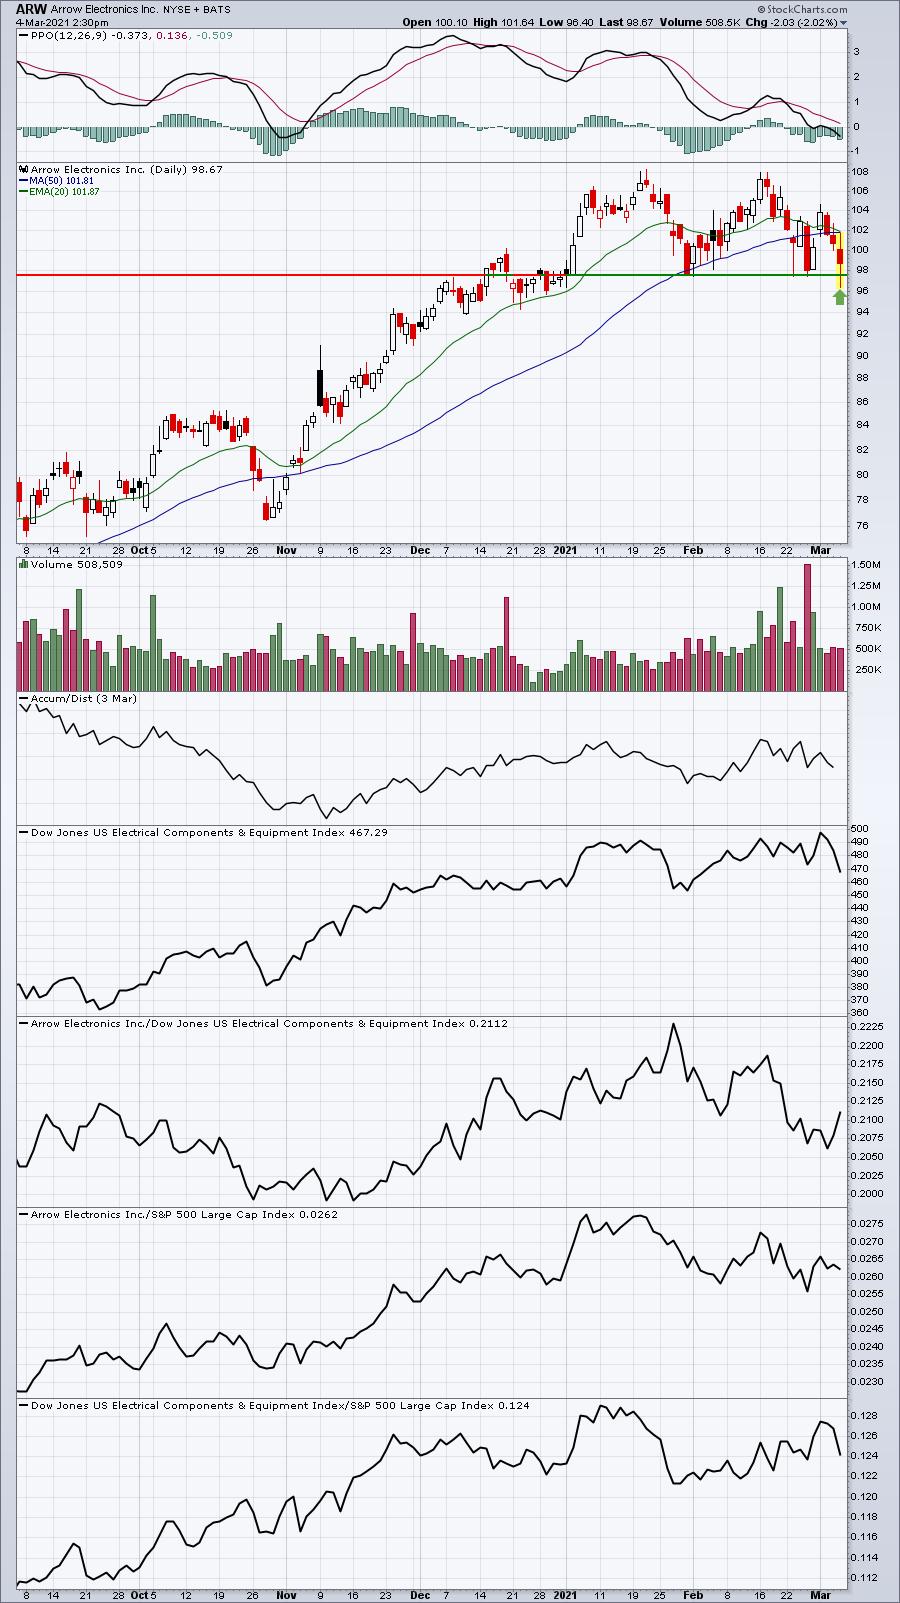
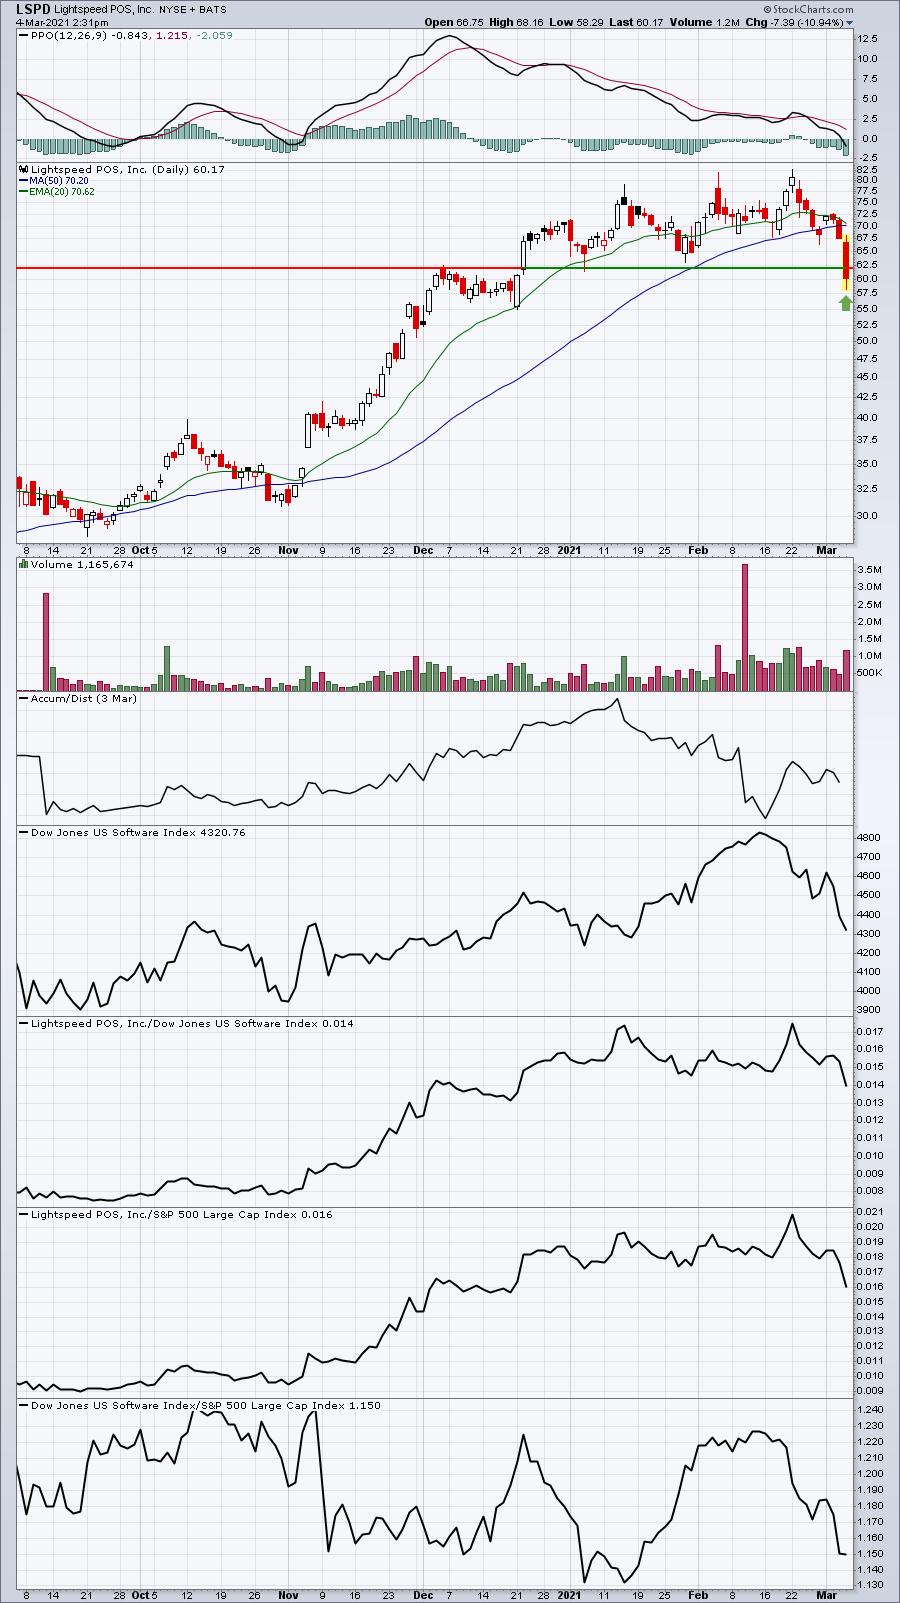
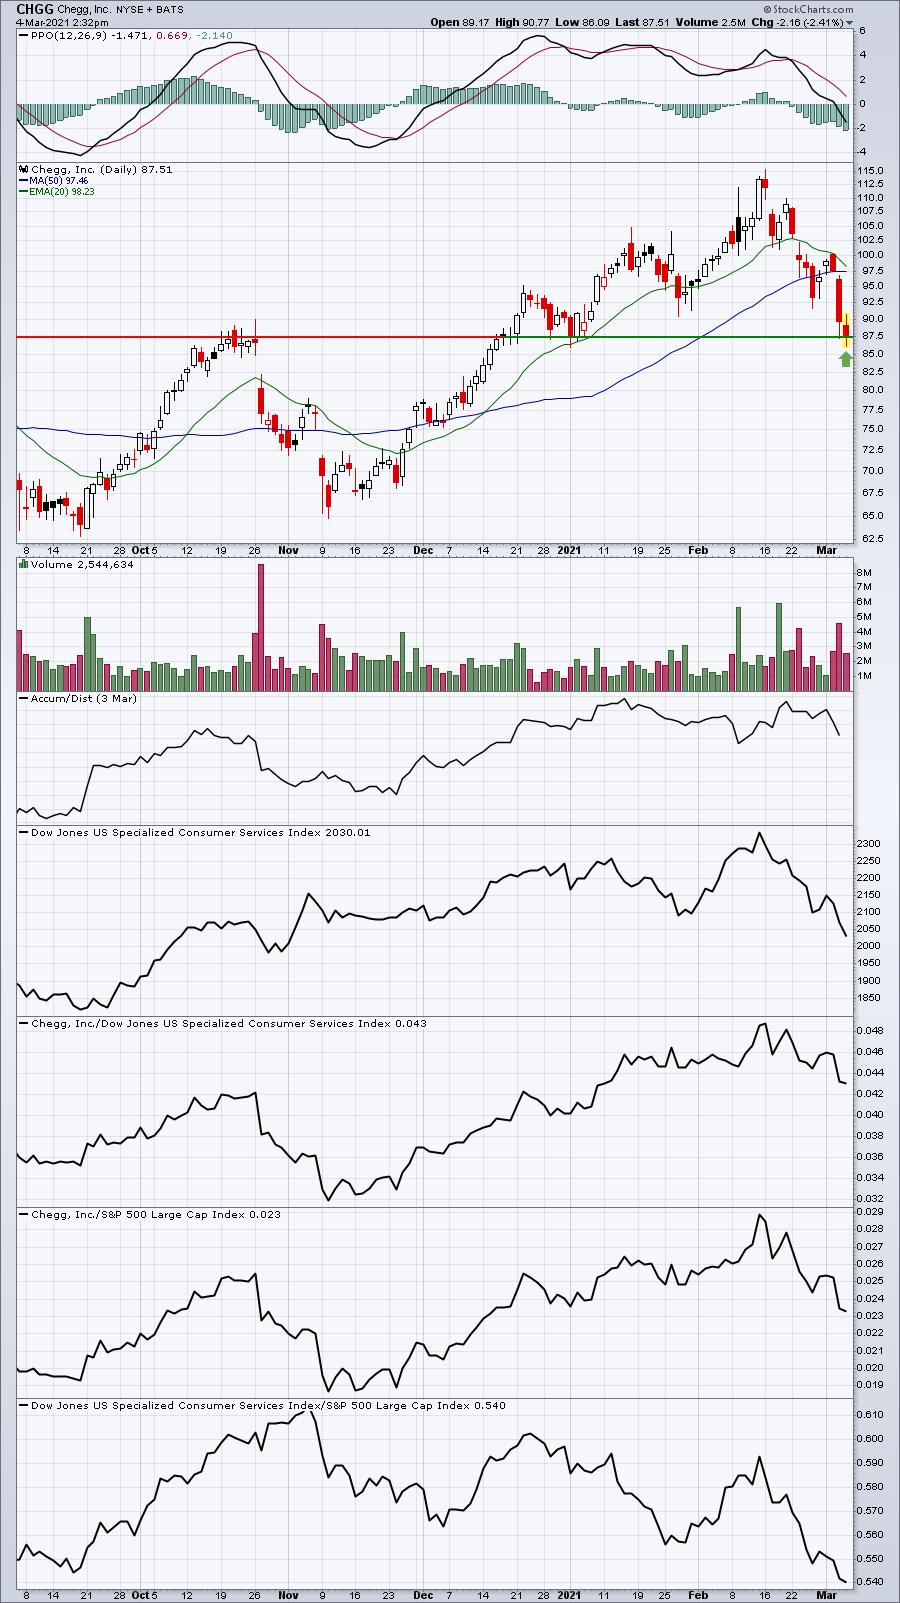
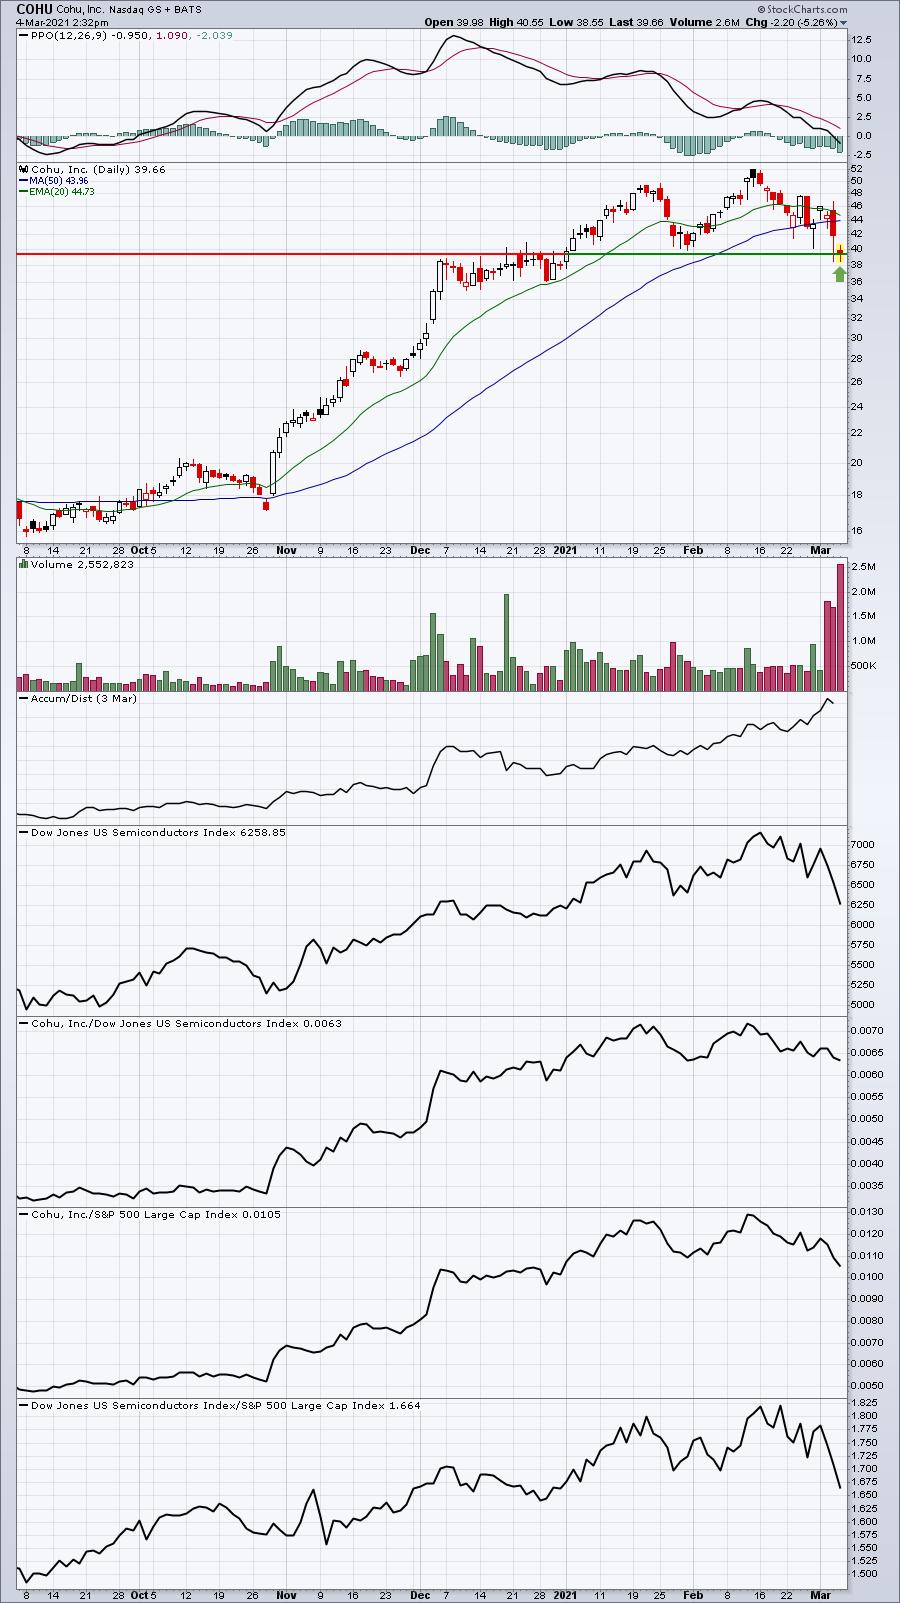
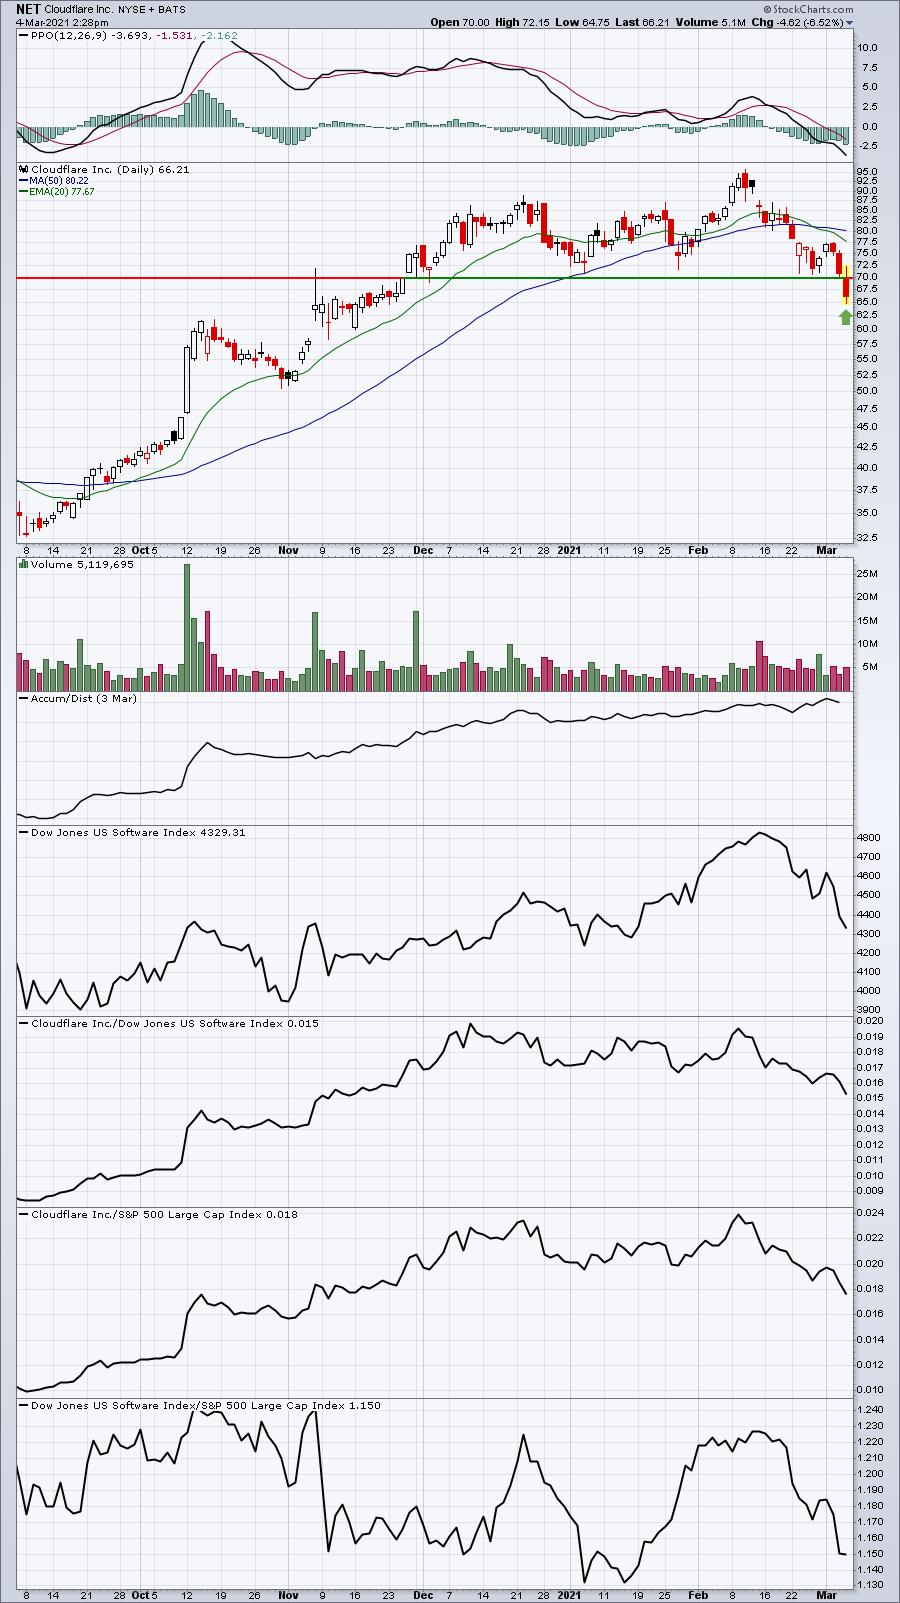
I'm seeing intraday breakdowns on a number of charts. While jumping in on an intraday basis can be extremely risky, I do like jumping in towards the close if we see "false breakdowns." A false breakdown is one where we fall below key, easily-identifiable price support intraday, only to rally back in afternoon trading to close above it. That is normally the market maker recipe for a significant bottom. Will it happen today? I don't know, but ahead of a decent nonfarm payrolls report in the morning would be fitting for these thieves. They love to buy in the final hour and then profit on a huge gap higher in the morning. It's happened plenty of times in the past.
Anyhow, here are a dozen examples of POTENTIAL false breakdowns (some may require recoveries into the close today):
ACCD:
BLK:
TER:
DHR:
FORM:
NTGR:
ARW:
LSPD:
CHGG:
COHU (mentioned yesterday):
NET:
YETI:
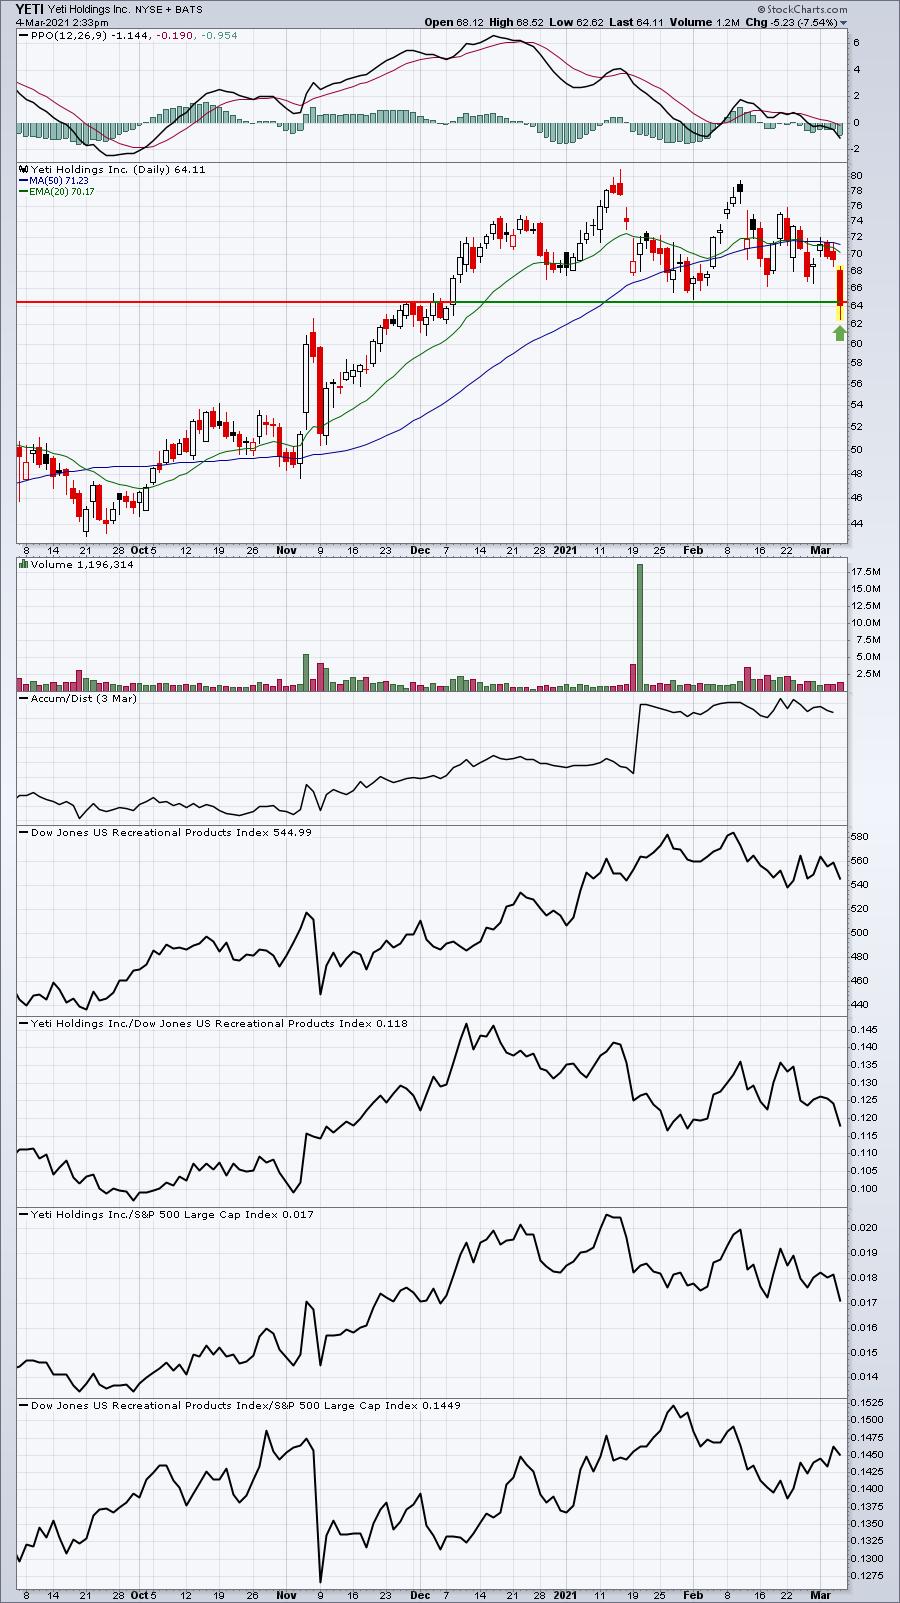
While we provide a TON of research here at EarningsBeats.com, I'd like to think that our members are smarter than everyone else who's investing/trading. There are SO many little tricks that market makers use to swindle us out of our shares. The above companies may or may not reverse at today's level. Maybe we have more selling to go. But I believe it's imperative that we learn to recognize when the market makers are hands-off or on vacation, and when they're buying stocks hand over fist.
I hope these visualizations help in some way as we try to navigate this latest stock market episode.
Earnings Reports
Here are the key earnings reports for the next two days, featuring stocks with market caps of more than $10 billion. I also include a few select companies with market caps below $10 billion. Finally, any portfolio stocks that will be reporting results are highlighted in BOLD. If you decide to hold a stock into earnings, please understand the significant short-term risk that you are taking. Please be sure to check for earnings dates for any companies you own or are considering owning.
Thursday, March 4:
AVGO, COST, KR, WORK, COO, BURL, ARGX, TTC, GWRE, GPS, CIEN, SDGR, BJ, SDC, FLGT, MIK, PRPL, VERI
Friday, March 5:
GSX, BIG, HIBB
Economic Reports
Initial jobless claims: 745,000 (actual) vs. 760,000 (estimate)
Q4 productivity (2nd estimate): -4.2% (actual) vs. -4.7% (estimate)
January factory orders: +2.6% (actual) vs. +2.0% (estimate)
Happy trading!
Tom