
EB Daily Market Report - Friday, March 5, 2021
Executive Market Summary
- Futures were hovering around the flat line most of the morning, then initially turned red after a very strong February jobs market was released before moving positive again
- Nonfarm payrolls came in at 379,000, more than doubling the 175,000 estimate
- The strength in jobs has the 10-year treasury yield ($TNX) on the move higher, rising 5 basis points to 1.60%
- NASDAQ futures are weaker again based on the higher treasury yields
- Crude oil ($WTIC, +2.74%) is on the move towards $66 per barrel as investors look to much stronger economic activity ahead
- Asian markets were lower overnight and European markets are mixed with the German DAX ($DAX) down fractionally
Market Outlook
That was a big jobs report this morning. Unfortunately, it plays into the current narrative of higher treasury yields and certainly could result in more unwinding out of growth stocks. Longer-term, however, this is GREAT news. Adding nearly 400,000 jobs during February, while restrictions remain in place across the country, clearly demonstrates the future economic activity ahead, in my opinion. I believe everything continues to play out exactly as I've expected it would. I still see GDP growth surging in the second half of this year. While investors may be spooked short-term by rising rates, I still look ahead and see surging growth with still-near-record interest rates.
Everything is always a hurdle for equities it seems. It was bad when rates were falling, now it's bad when rates are rising. I honestly cannot see the market selling off for any extended period. There's simply too much liquidity and the rotation from the bond market cannot be ignored as we move forward. Billions and billions will pour into U.S. equities in the months ahead.
The bigger question, in my view, and as I've pointed out many times since the positive vaccine news hit in November is this: Where does our leadership come from in the next two weeks? Two months? Two years? While growth stocks are currently being repriced to the downside, I do not see this as a long-term theme. We'll reach a point, likely sooner rather than later, when institutions will see this as a tremendous opportunity to jump back in. Stick with the leaders.
Don't be surprised by more whipsaw action near-term, though. Fear is still relatively high and it's March, which can be a bit treacherous for our more aggressive areas. Opportunities will be significant, however, as we move towards April earnings season.
Sector/Industry Focus
An area like internet ($DJUSNS) is at a fairly significant short-term fork-in-the-road. I see a short-term trendline support level being tested, but if it breaks, it could lead to further selling and possibly the establishment of a lower support line in a channel. If I base the channel formation on the two most significant price highs, it looks something like this:
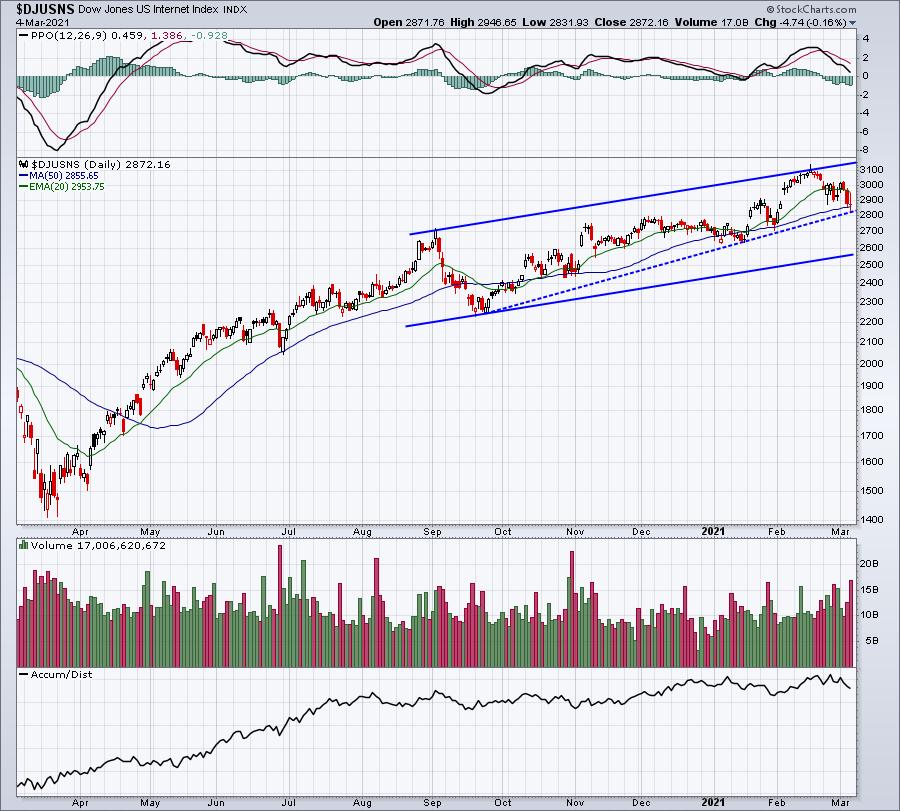
That blue-dotted trendline is the short-term trend I was referring to. If that breaks, it doesn't suggest that we'd return all the way down to test that lower channel support, but it certainly could mean that the group trades lower to test one of the recent price lows, perhaps near 2700.
ChartLists/Strategies
I'm not going to provide any specific stock trading ideas this morning without seeing the action, but one thing I would do is run our High Volume scan from our website near 10am ET against our Strong Earnings ChartLists (SECL) and see which stocks have traded 40% of their average daily volume in the first 30 minutes of trading. The scan in my StockCharts.com account would look like this:
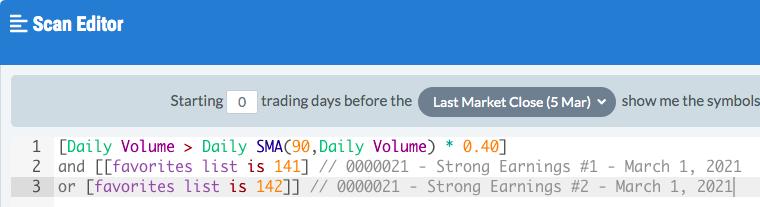
Your "favorites list" will be different in your account than it is in mine. This scan will not work in your account if you type exactly the scan syntax above. You need to make sure you copy the first line, but then go to the scan drop down menus and use the two SECLs that you've downloaded into your own account. Also, be sure to use "or" between your two SECLs, not "and". Finally, be sure to put an extra bracket before your first SECL list and after your second SECL.
If the stock market performs well today, I want to see which stocks are showing heavy volume. That will begin to provide us clues as to where some of the institution is going.
Earnings Reports
Here are the key earnings reports for the next two days, featuring stocks with market caps of more than $10 billion. I also include a few select companies with market caps below $10 billion. Finally, any portfolio stocks that will be reporting results are highlighted in BOLD. If you decide to hold a stock into earnings, please understand the significant short-term risk that you are taking. Please be sure to check for earnings dates for any companies you own or are considering owning.
Friday, March 5:
GSX, BIG, HIBB
Monday, March 8:
XPEV, WISH, SFIX, CASY
Economic Reports
February nonfarm payrolls: 379,000 (actual) vs. 175,000 (estimate)
February private payrolls: 465,000 (actual) vs. 183,000 (estimate)
February unemployment rate: 6.2% (actual) vs. 6.3% (estimate)
February average hourly earnings: +0.2% (actual) vs. +0.2% (estimate)
Happy trading!
Tom