
EB Daily Market Report - Wednesday, March 10, 2021
Executive Market Summary
- Futures were strong, continuing Tuesday's advance as all of our major indices opened higher
- The Dow Jones is showing excellent relative strength and on its way to its first-ever close above 32000
- Commodities are mostly on the rise as crude oil ($WTIC), gold ($GOLD), silver ($SILVER), and copper ($COPPER) all higher
- The 10-year treasury yield ($TNX) is down 2 basis points, falling back to 1.52%
- A big inflation test was passed this morning as the headline CPI came in even with expectations; Core CPI came in at +0.1% and below expectations
- Energy (XLE, +2.20%), materials (XLB, +2.03%), and financials (XLF, +2.00%) are the top performing sectors today; technology (XLK, +0.0%) is even, but all other sectors are higher
- Mosaic (MOS, +6.73%), an Income Portfolio component stock, is the 2nd best performing stock on the S&P 500
Market Outlook
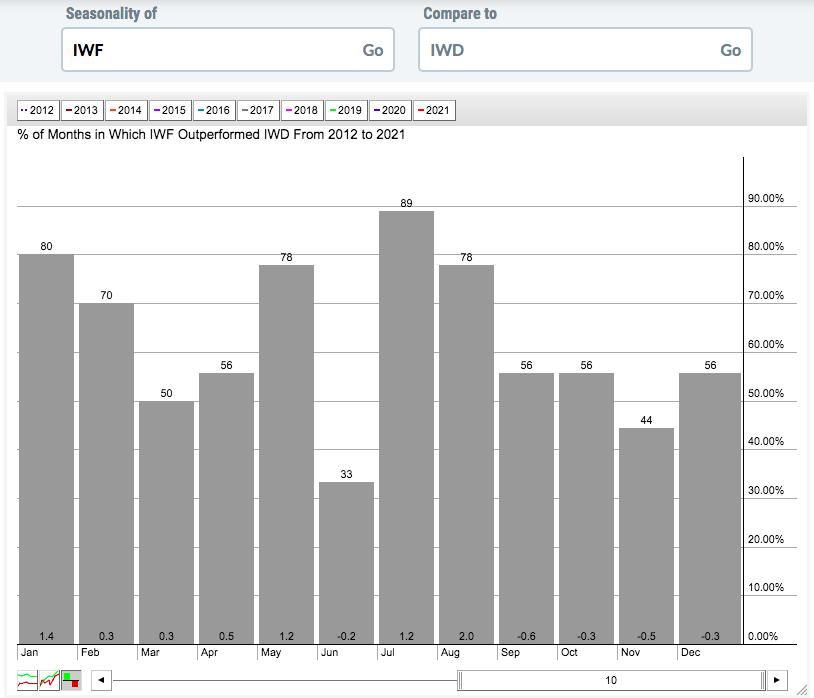
I thought now would be a good time to explain the difference between growth vs. value (IWF:IWD) during secular bull markets vs. secular bear markets. The first chart shows the monthly relative performance of IWF vs. IWD over the past 10 years (current secular bull market):
Now let's break down the amount of relative outperformance by the month of the calendar quarter:
- 1st month (Jan, Apr, Jul, Oct): +2.8%
- 2nd month (Feb, May, Aug, Nov): +3.0%
- 3rd month (Mar, Jun, Sep, Dec): -0.8%
Now let's look at this same relative performance chart for the prior 10 years (secular bear market):
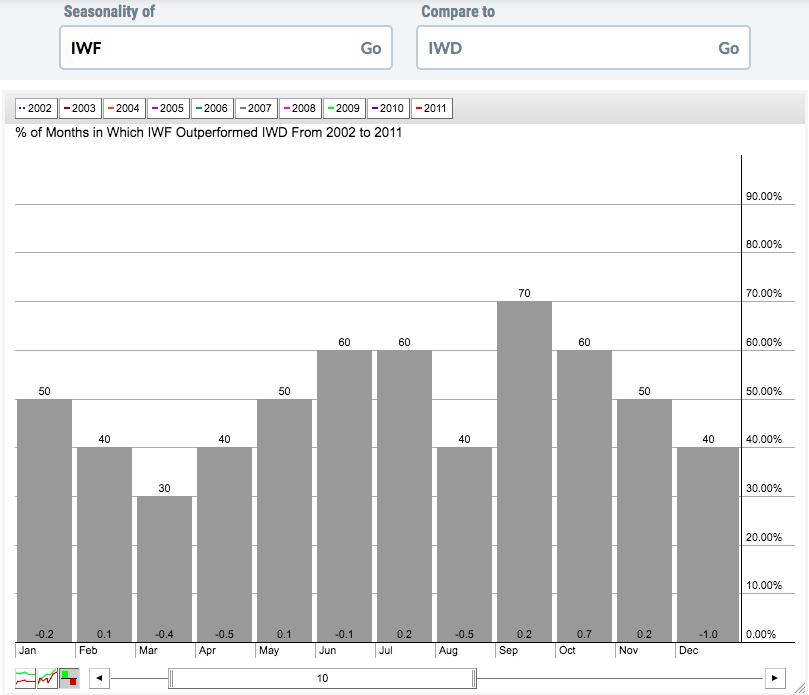
Again, let's break down the amount of relative outperformance by the month of the calendar quarter:
- 1st month (Jan, Apr, Jul, Oct): +0.2%
- 2nd month (Feb, May, Aug, Nov): -0.1%
- 3rd month (Mar, Jun, Sep, Dec): -1.3%
Two points here.
(1) It's quite clear that NO MATTER THE MARKET, the third month of each calendar quarter is weak for growth stocks relative to value stocks.
(2) Growth stocks wildly outperform value stocks during secular bull markets, but that outperformance typically occurs during the first two months of a calendar quarter.
Because of the above, we need to remain cautious during March, but the horizon remains quite bullish.
Sector/Industry Focus
Restaurants and bars ($DJUSRU) have been consolidating mostly in sideways consolidation, but that could be about to change. We're on the verge of a breakout to all-time highs:
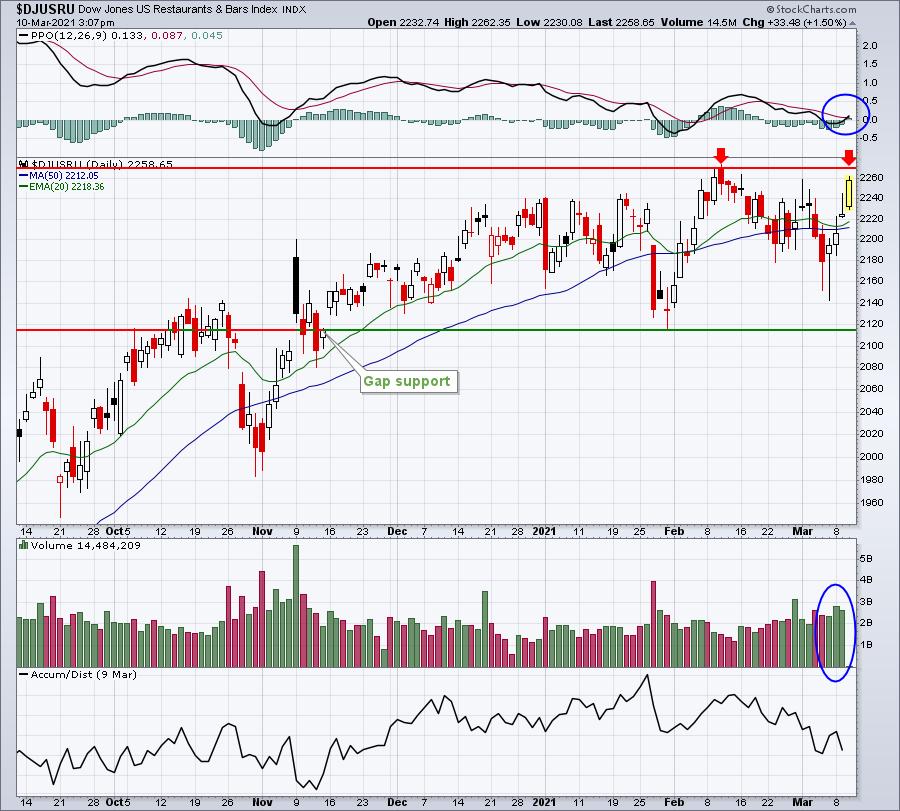
The PPO is near its centerline and just turning higher. A breakout of a base like this should most definitely be respected.
ChartLists/Strategies
I mentioned the restaurants & bars above as a group on the verge of a potential breakout. One restaurant on our Strong Earnings ChartList that could certainly benefit is ARMK:
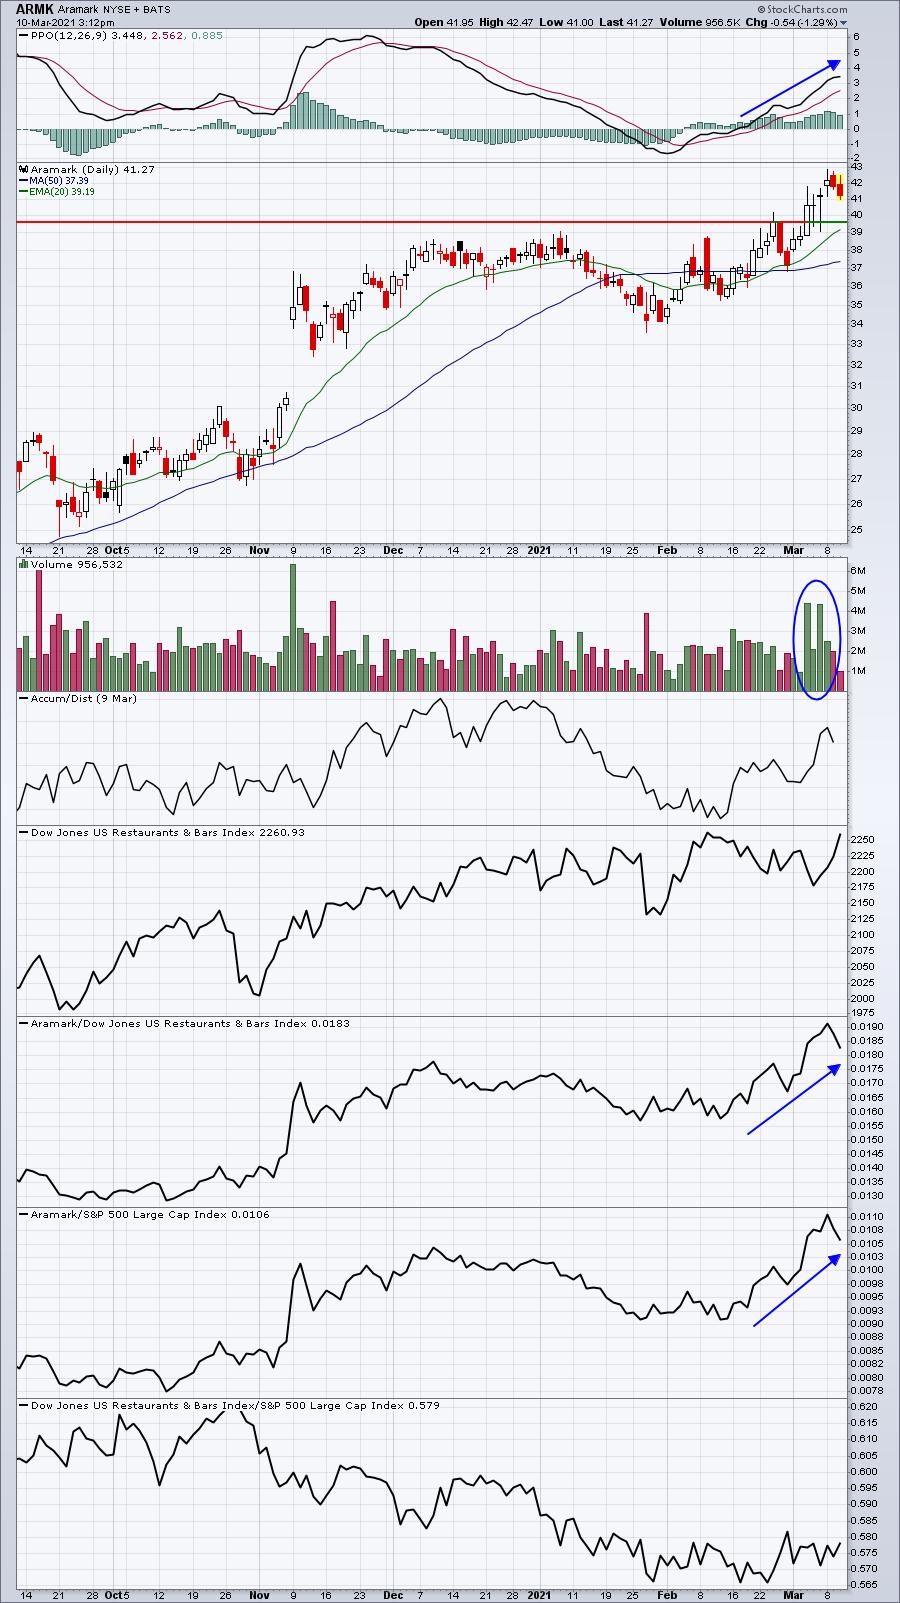
Volume was strong to confirm the recent breakout above 40.00 and ARMK's relative strength is apparent towards the bottom of the chart. Technically, the 39.50-40.00 area would represent best entry. Watch the rising 20 day EMA for solid support as well.
Earnings Reports
Here are the key earnings reports for the next two days, featuring stocks with market caps of more than $10 billion. I also include a few select companies with market caps below $10 billion. Finally, any portfolio stocks that will be reporting results are highlighted in BOLD. If you decide to hold a stock into earnings, please understand the significant short-term risk that you are taking. Please be sure to check for earnings dates for any companies you own or are considering owning.
Wednesday, March 10:
ORCL, FNV, GDS, CPB, BLDP, ASAN, CLDR, SKLZ, SGRY, UNFI, AMC, CVGW
Thursday, March 11:
JD, DOCU, ULTA, STNE, WPM, GDRX, MTN, YSG, EXPI, CELH, DOMO, ZUO, ZUMZ
Economic Reports
February CPI: +0.4% (actual) vs. +0.4% (estimate)
February Core CPI: +0.1% (actual) vs. +0.2% (estimate)
Happy trading!
Tom